Problem statement
Recently I was asked by a customer what would be the best way to get alerted by VMware Aria Operations when a Windows VM stopped because of a Blue Screen of Death (BSoD) or a Linux machine suddenly quit working due to a Kernel Panic.
Even if it looks like a piece of cake (we have tons of the metrics and properties collected by Aria Operations), it turns out that it is not that simple to recognize such crashes without looking at the console.
So, challenge accepted:-)
In this blog post I am focusing on Windows BSoD and the overall idea was to figure out the metrics which combined are indicating a BSoD occurrence.
NOTE: Windows as well as Linux will restart a crashed OS with default settings and the restart usually is quick enough to remain “undetected” by Symptom Definitions unless you are using Near-Real Time Monitoring in VMware Aria Operations SaaS. A restart can also be initiated by vCenter HA settings in case of missing heartbeats from the OS.
My “Windows BSoD” Approach
I quickly created a Windows Server 2019 VM with this configuration:
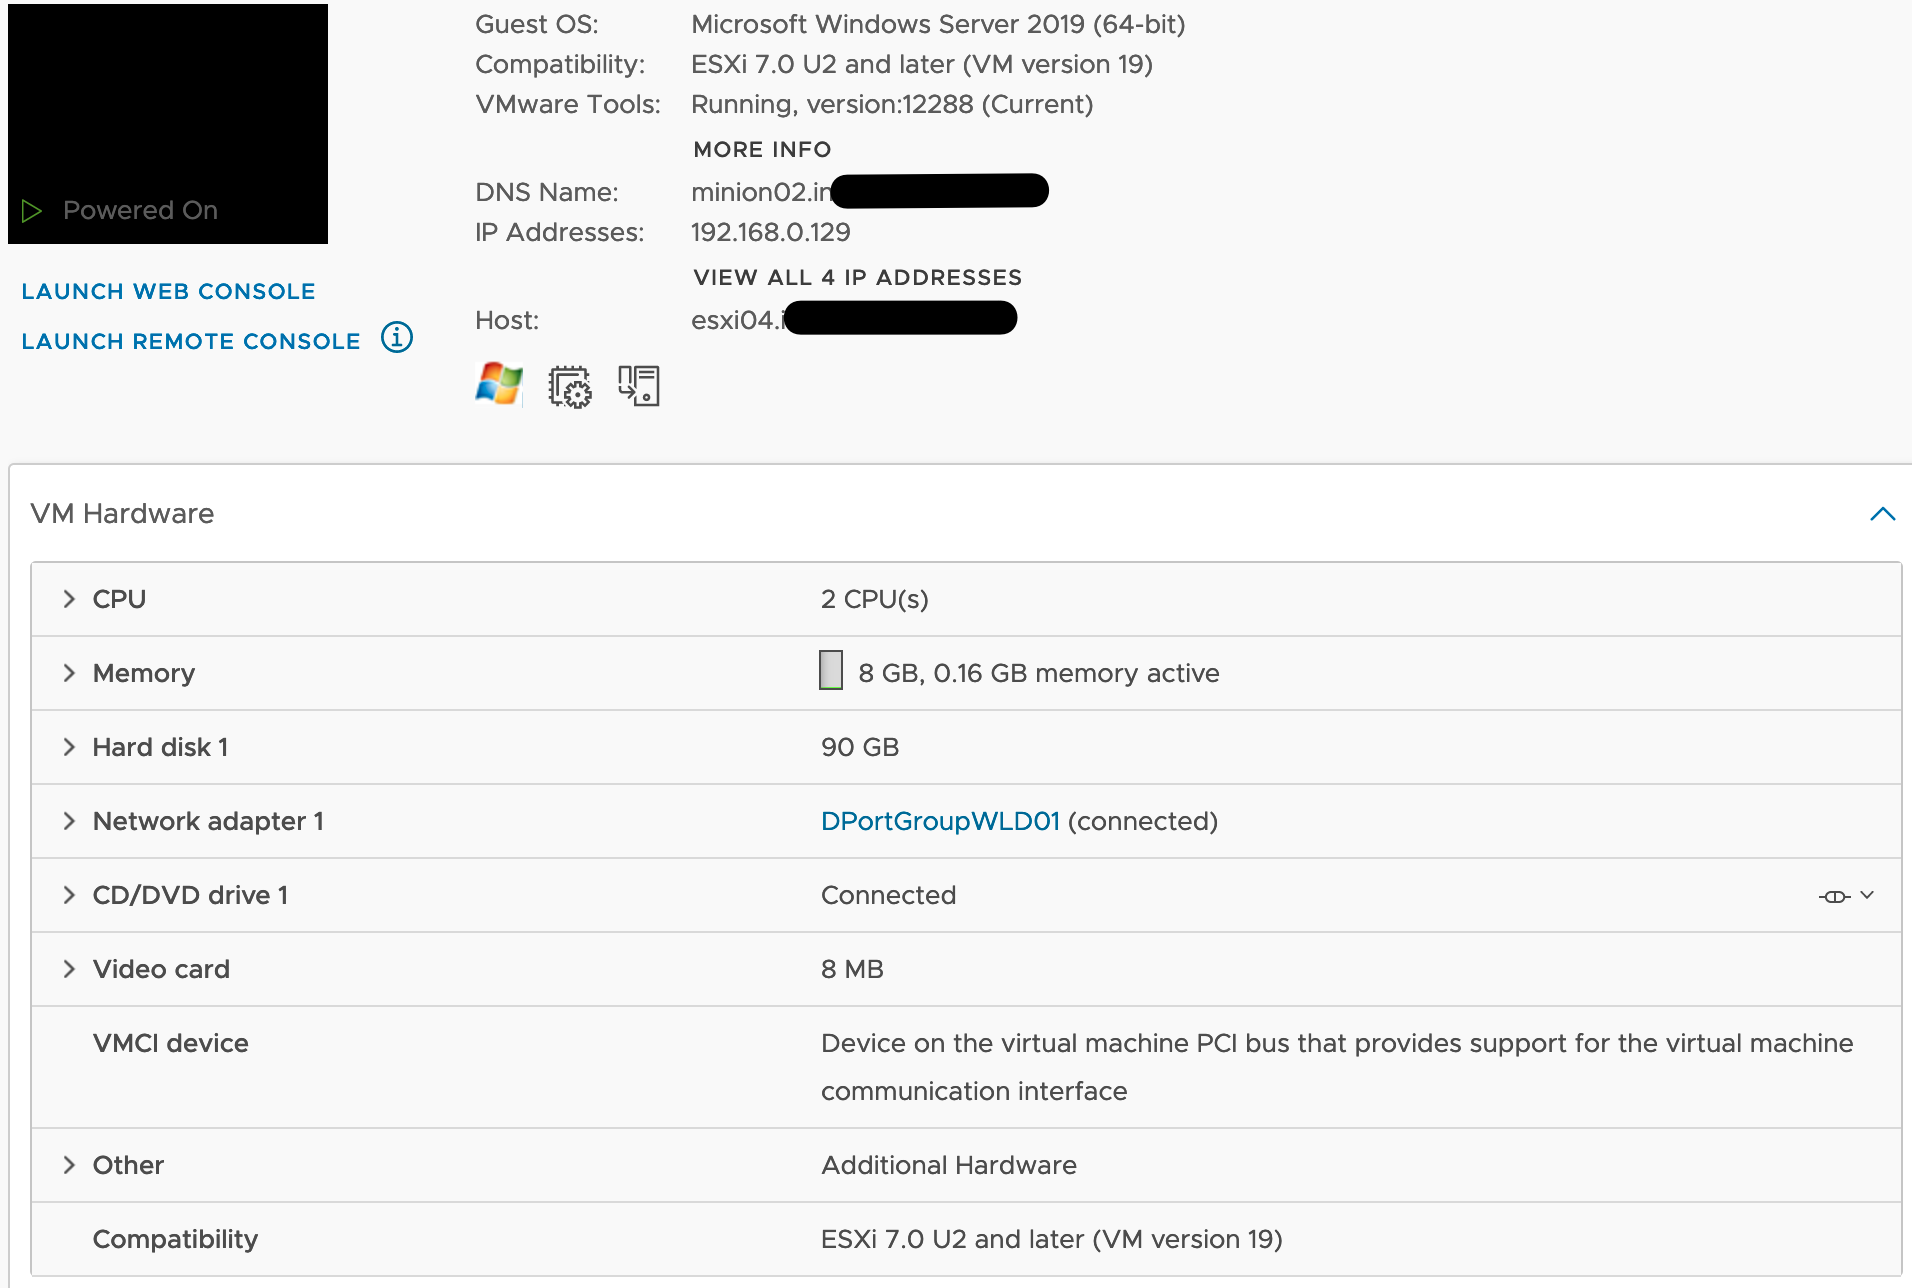
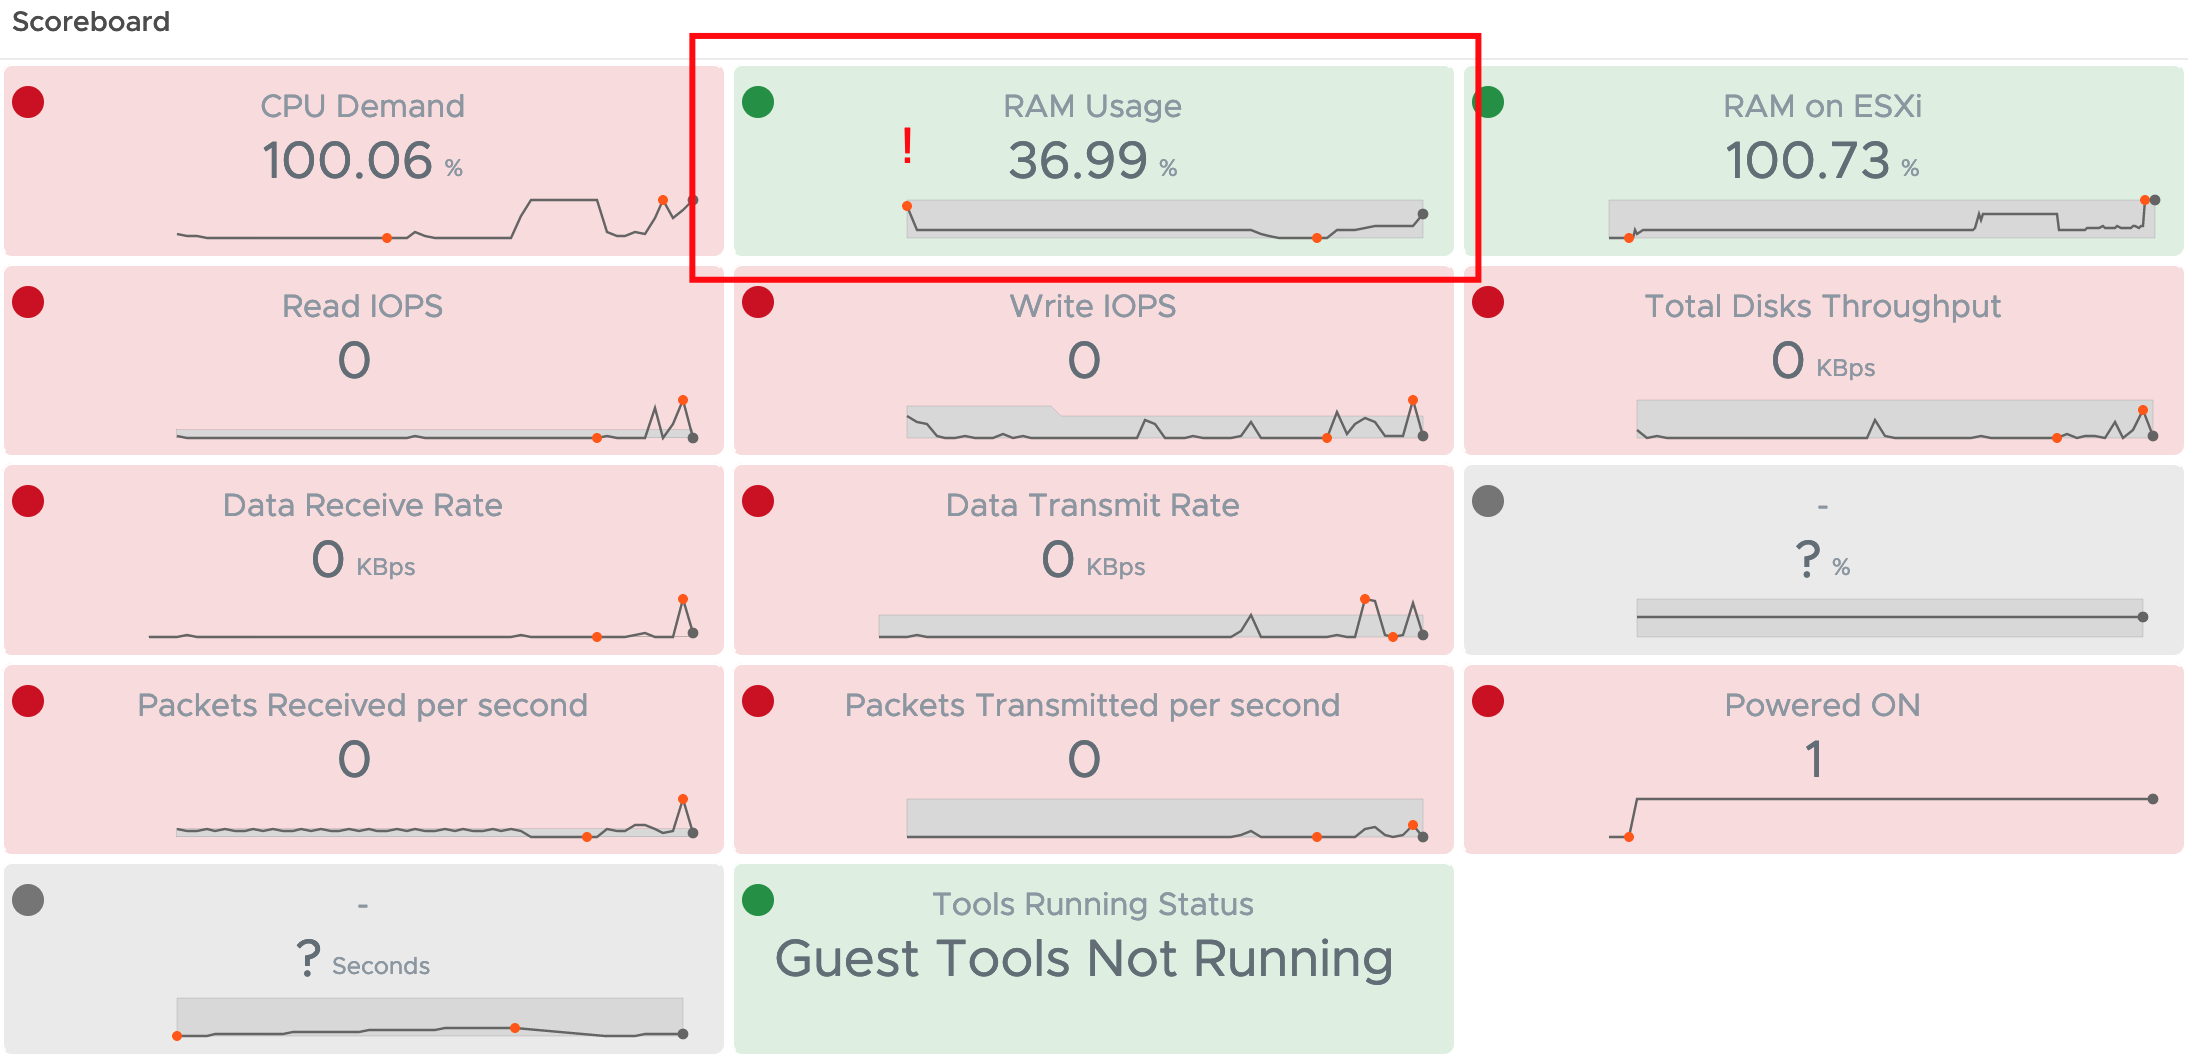
And with the help of tools like Testlimit and DiskSpd plus some usual activities on the VM I created a “quick and dirty” baseline using metrics shown in the next picture (please ignore the color coding in the following picture for a moment). You will notice that in the Scoreboard the VMTools status is missing. I was not sure if I should include it or not as “tools not running” does not necessarily mean that the OS crashed, it could be also a crashed service.

Blue Screen of Death Examples
NotMyFault is a perfect tool to crash Windows in various ways. As I wanted to check if different BSoD types have different symptoms I used that tool to force few crashes and collected a set of metrics for comparison.
First crash type.
I started with probably the most known Blue Screen:

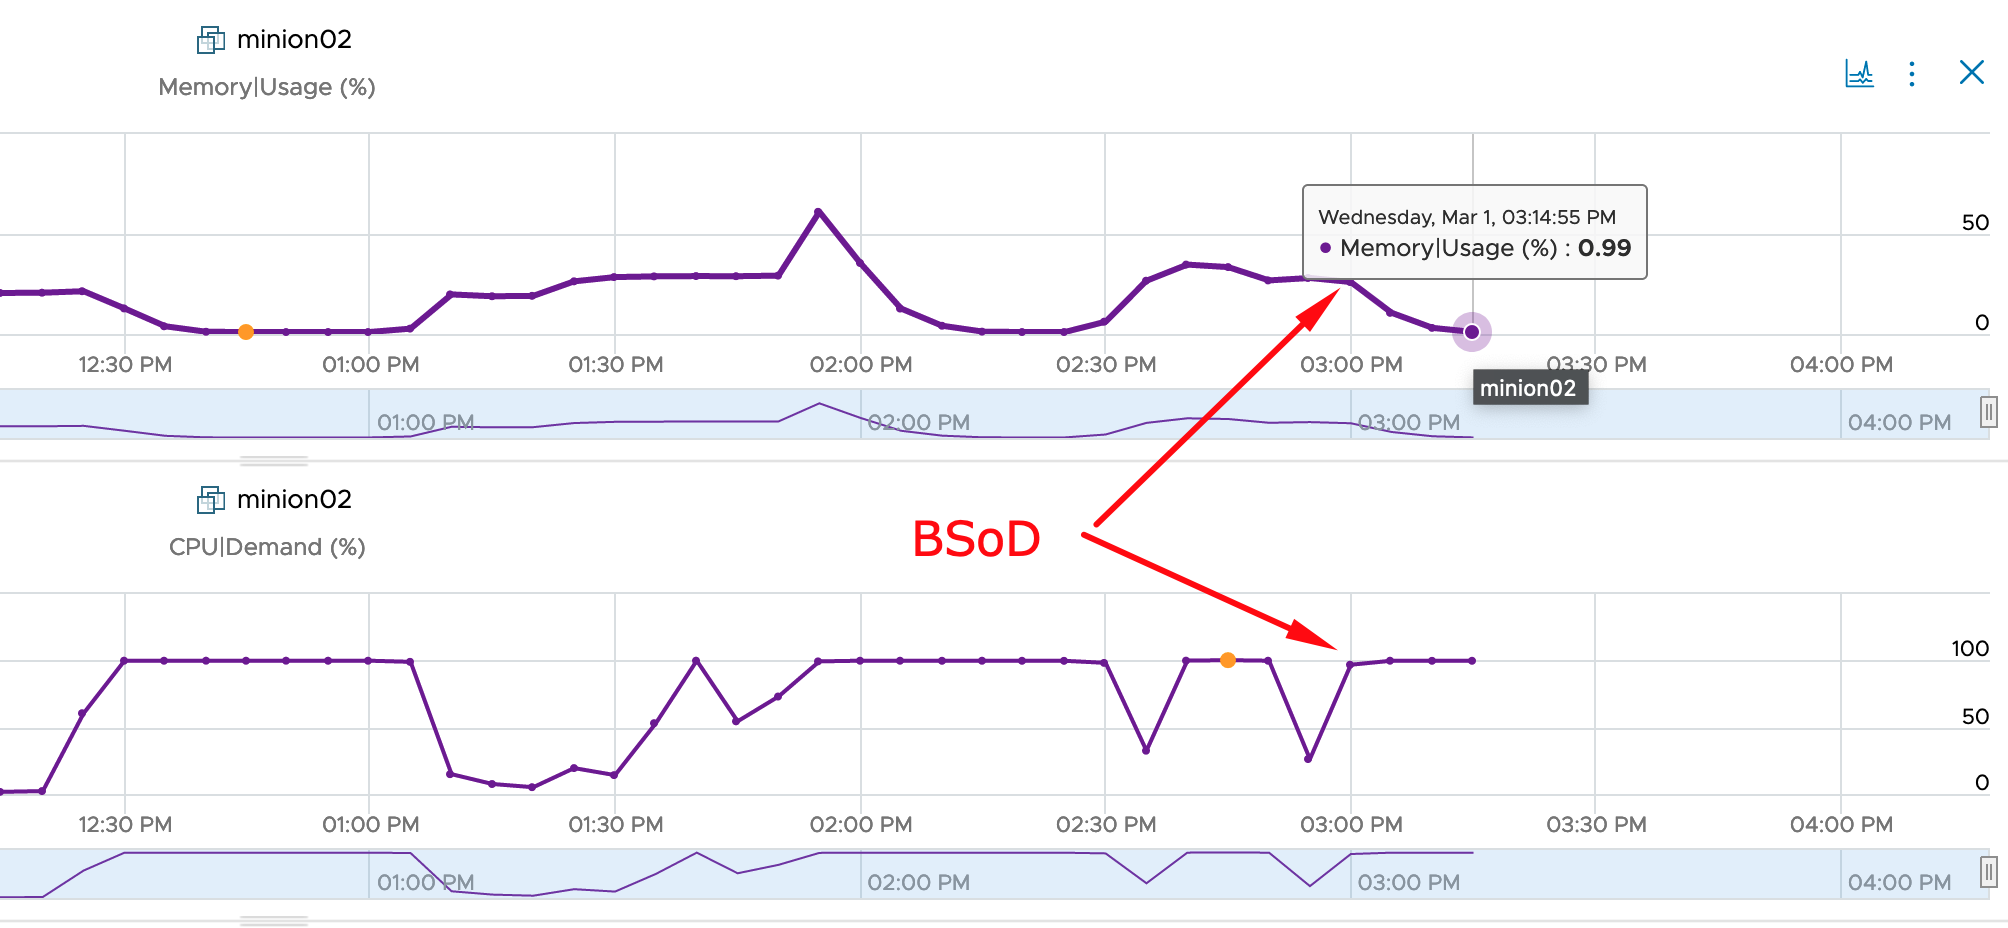
The first surprise was that the CPU Demand of the VM immediately increased to almost 100%. To ensure that this is not related to the fact that Windows is collecting data after the crash for some time, I checked this metric after two collections cycles (10 minutes) and it did not go down. Second finding is that the RAM Usage is only slowly decreasing, I assume this is simply due the the fact that memory is a really virtualized resource whereas CPU cycles inside the VM are actual cycles on the ESXi CPU. I also added the Guest Tools Status to the Scoreboard but I would not use it as symptom in an Alert Definition.
Second crash type.

As you can see in the next picture, the metrics are behaving similarly to the first crash. Of course no disk and network usage at all was expected but to see that the CPU Demand and RAM Usage are following the same pattern is interesting and very promising symptom.

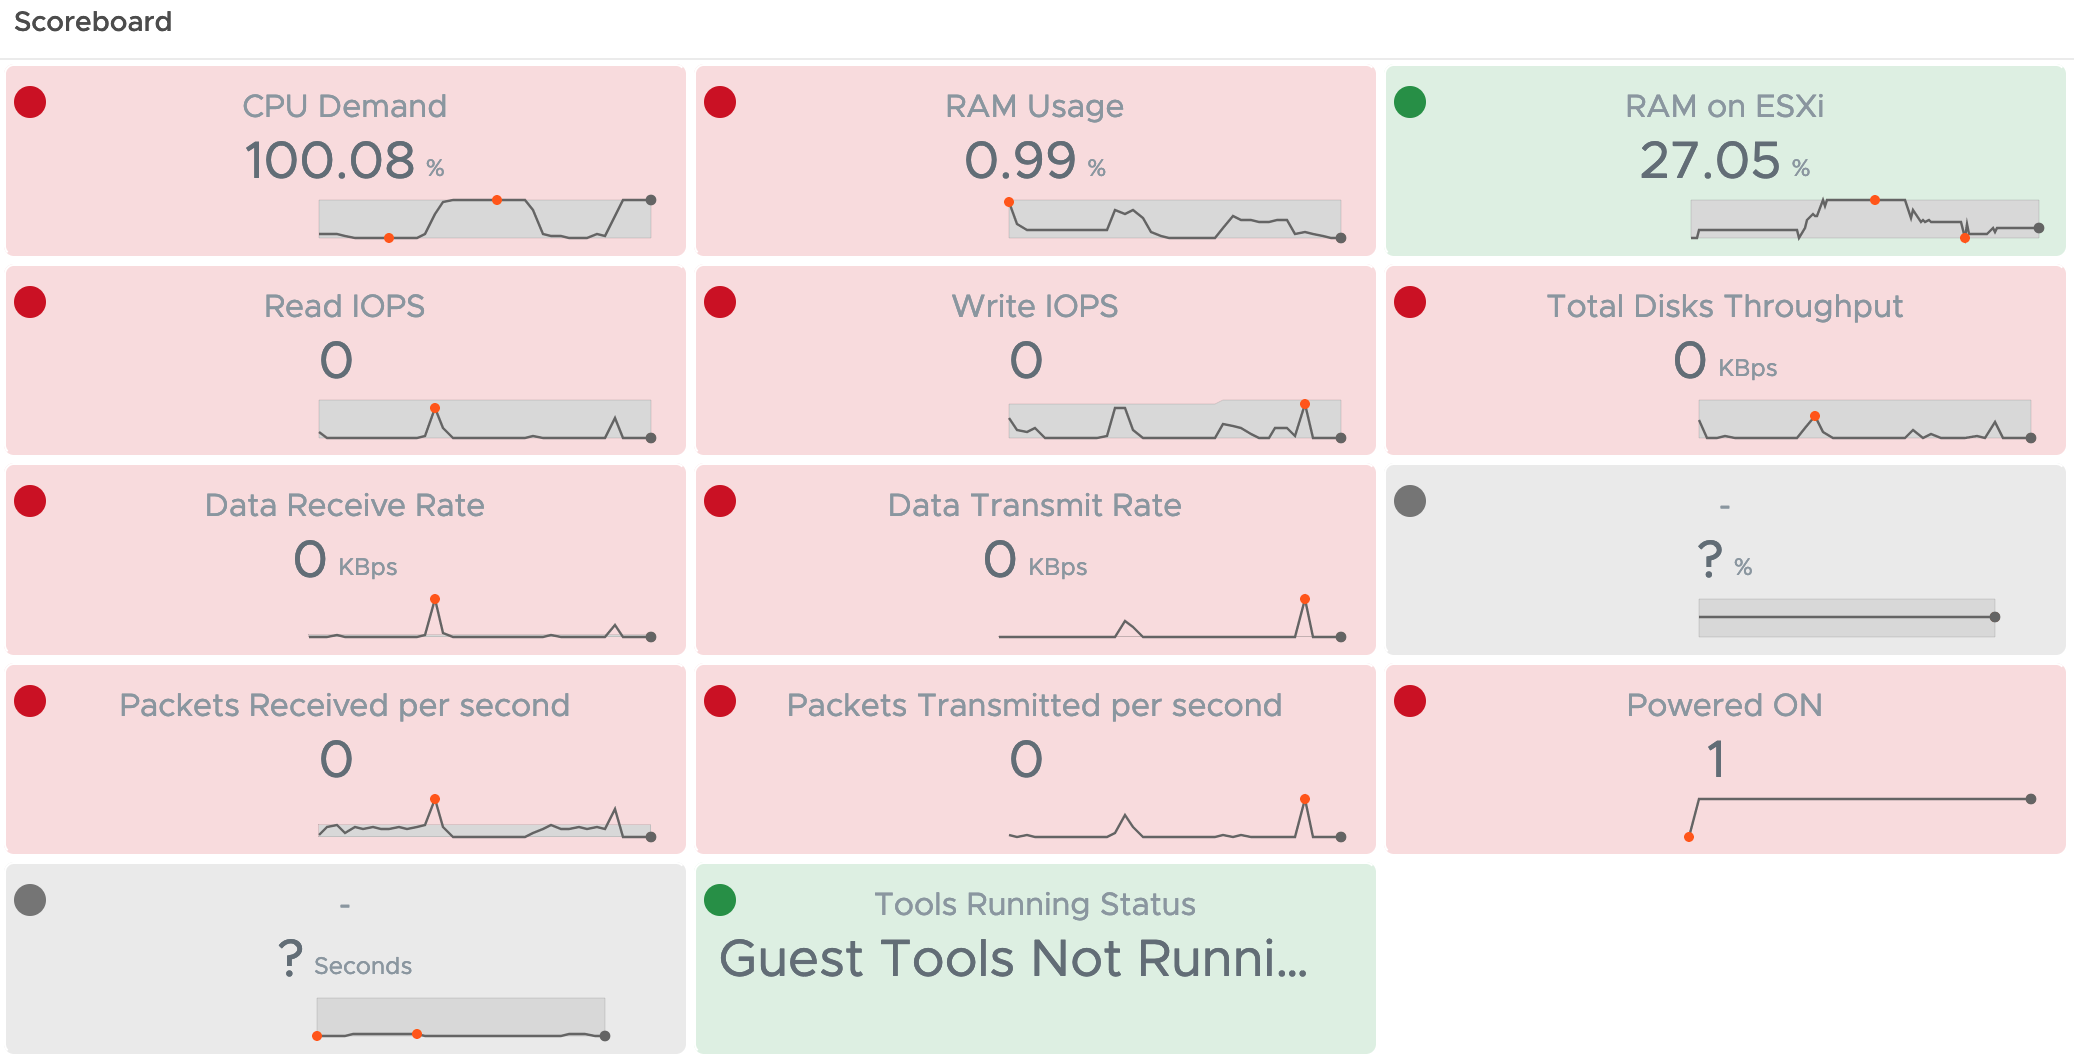
This time I waited few more collection cycles to see how far the RAM usage will decrease and apparently it will go down to approx. 0.99% after >4 cycles.
Third crash type.

This BSoD type again resulted in the same metrics values.

RAM on ESXi as metric seems to be dependent on the memory usage of the VM before the crash. I did not fully test it but Aria Operations Metric Correlation feature shows the same pattern for the respective metrics.

Just to be sure that the RAM Usage metric values do not change with different memory configurations of the VM, I did two more tests, the first one with 4GB RAM configured and the second with 17GB to check the metric with an odd RAM config.

And here the 17GB RAM config.
Constraints, assumptions and conclusions
Please be aware that I did not test every possible scenario, this is what I used:
- Windows 2019 Server Datacenter as OS
- VM Version 19
- VMware ESXi, 7.0.3, 20328353
- 3 different BSoD types tested
- VMTools not used as symptom
- OS Uptime not used as symptom as the metric is not available after OS crashed
- No Guest metrics used as such metrics will not be available after OS crashed
With the observations made during the crash tests I created 6 new Symptom Definitions and an Alert Definition using these new symptoms and one Condition for the power state of the VM. In the following two pictures you see the symptom and alert definitions.

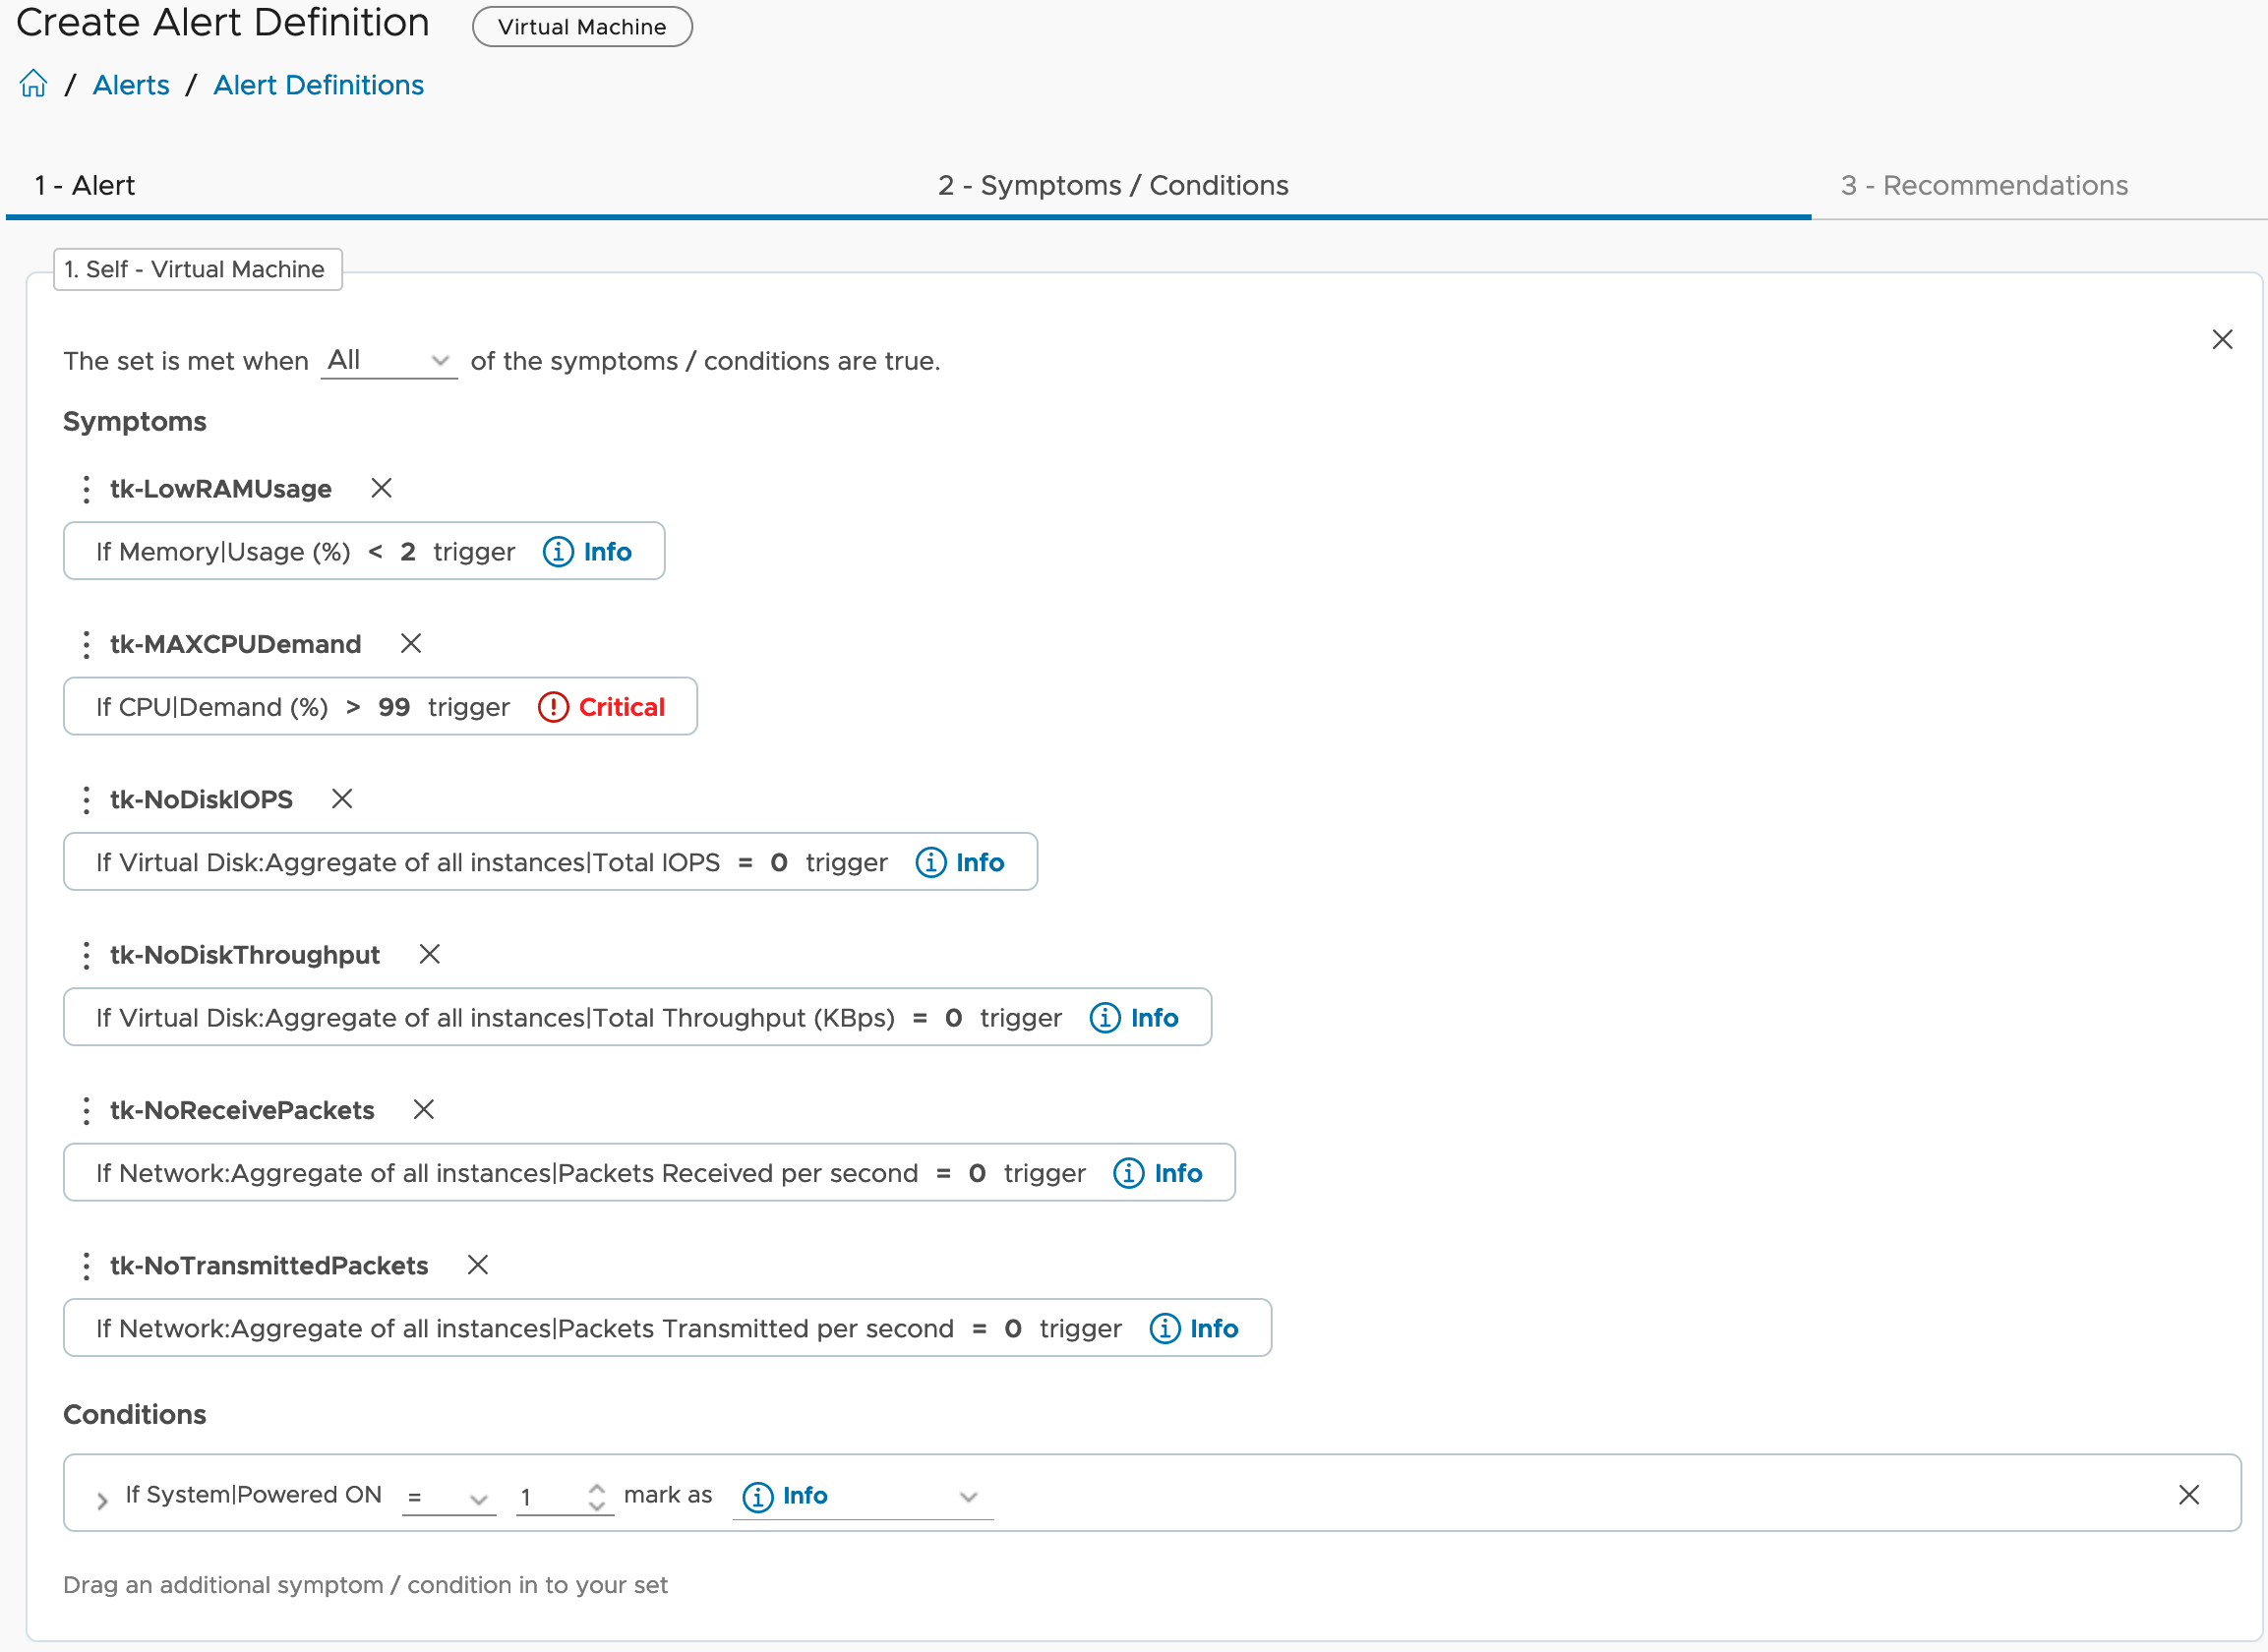
DO NOT forget to activate your new symptoms and alert definition in the Aria Operations Policy assigned to your VMs!
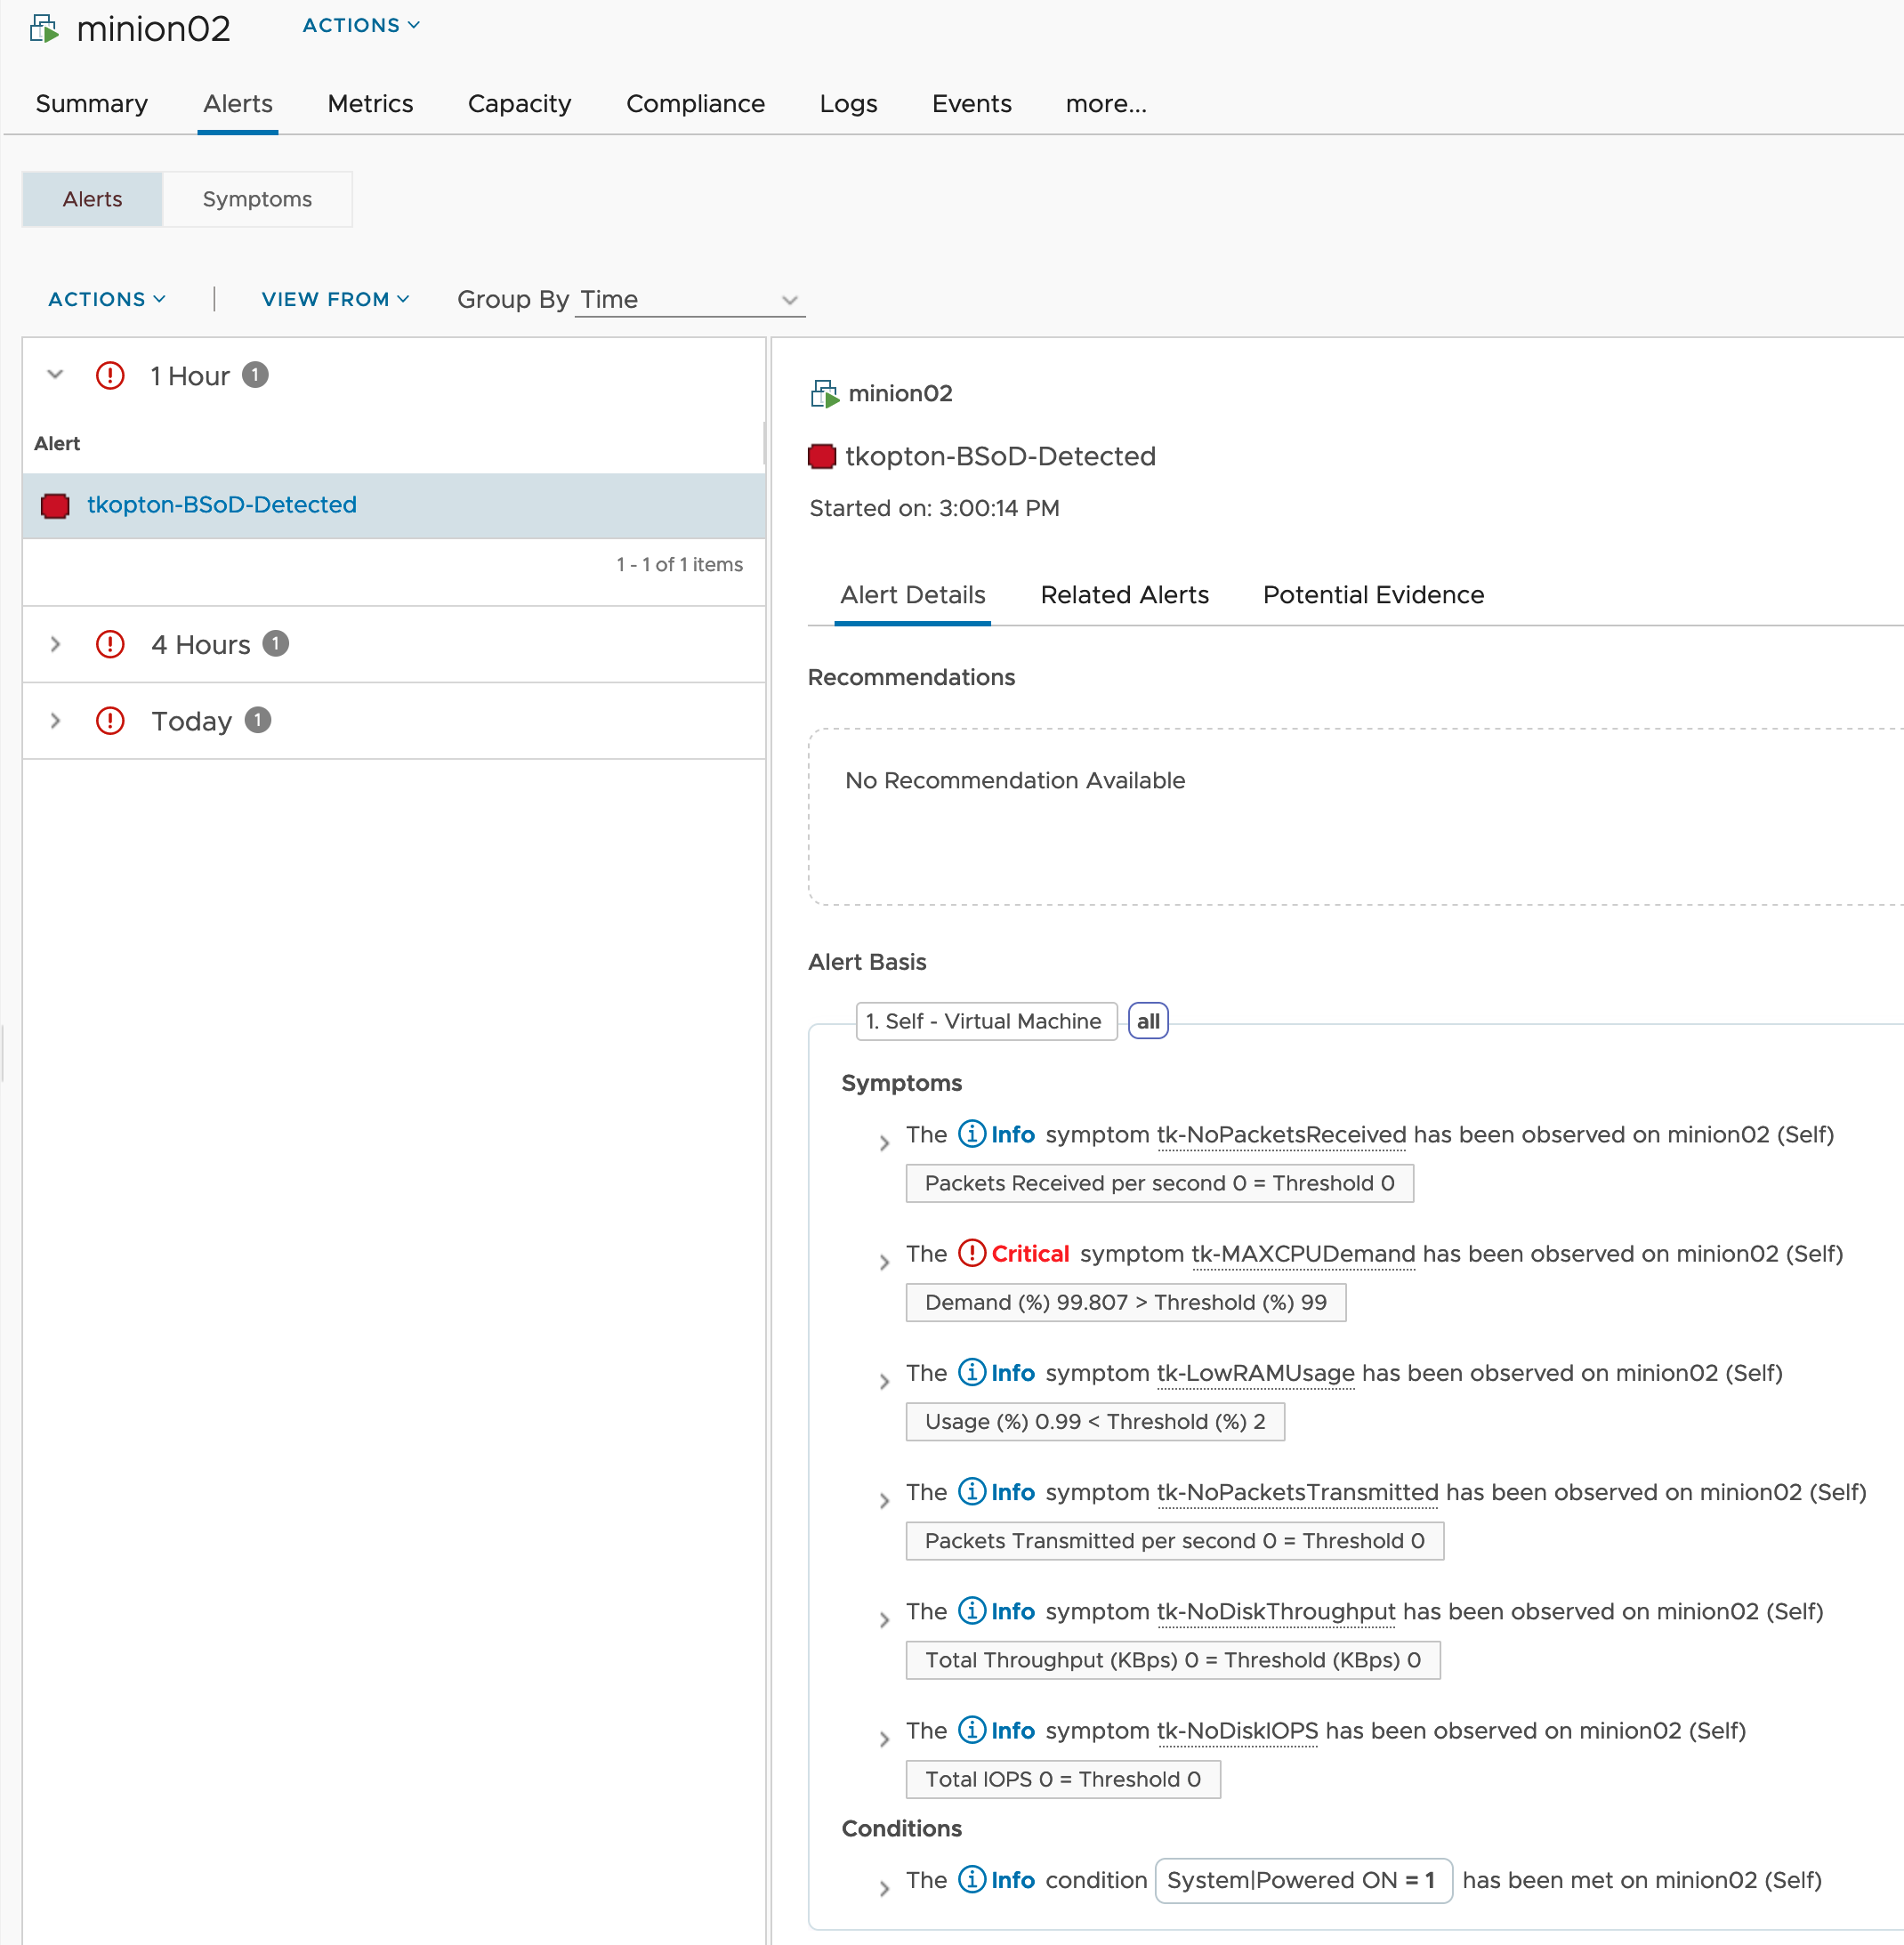
This is how the symptoms looks like on a crashed Windows Server 2019 VM.
Please be aware that the highlighted low memory usage symptom requires several collection cycles to become active. If you need fast response, remove it from the Alert Definition.

The small dashboard I created is shown in the next picture.
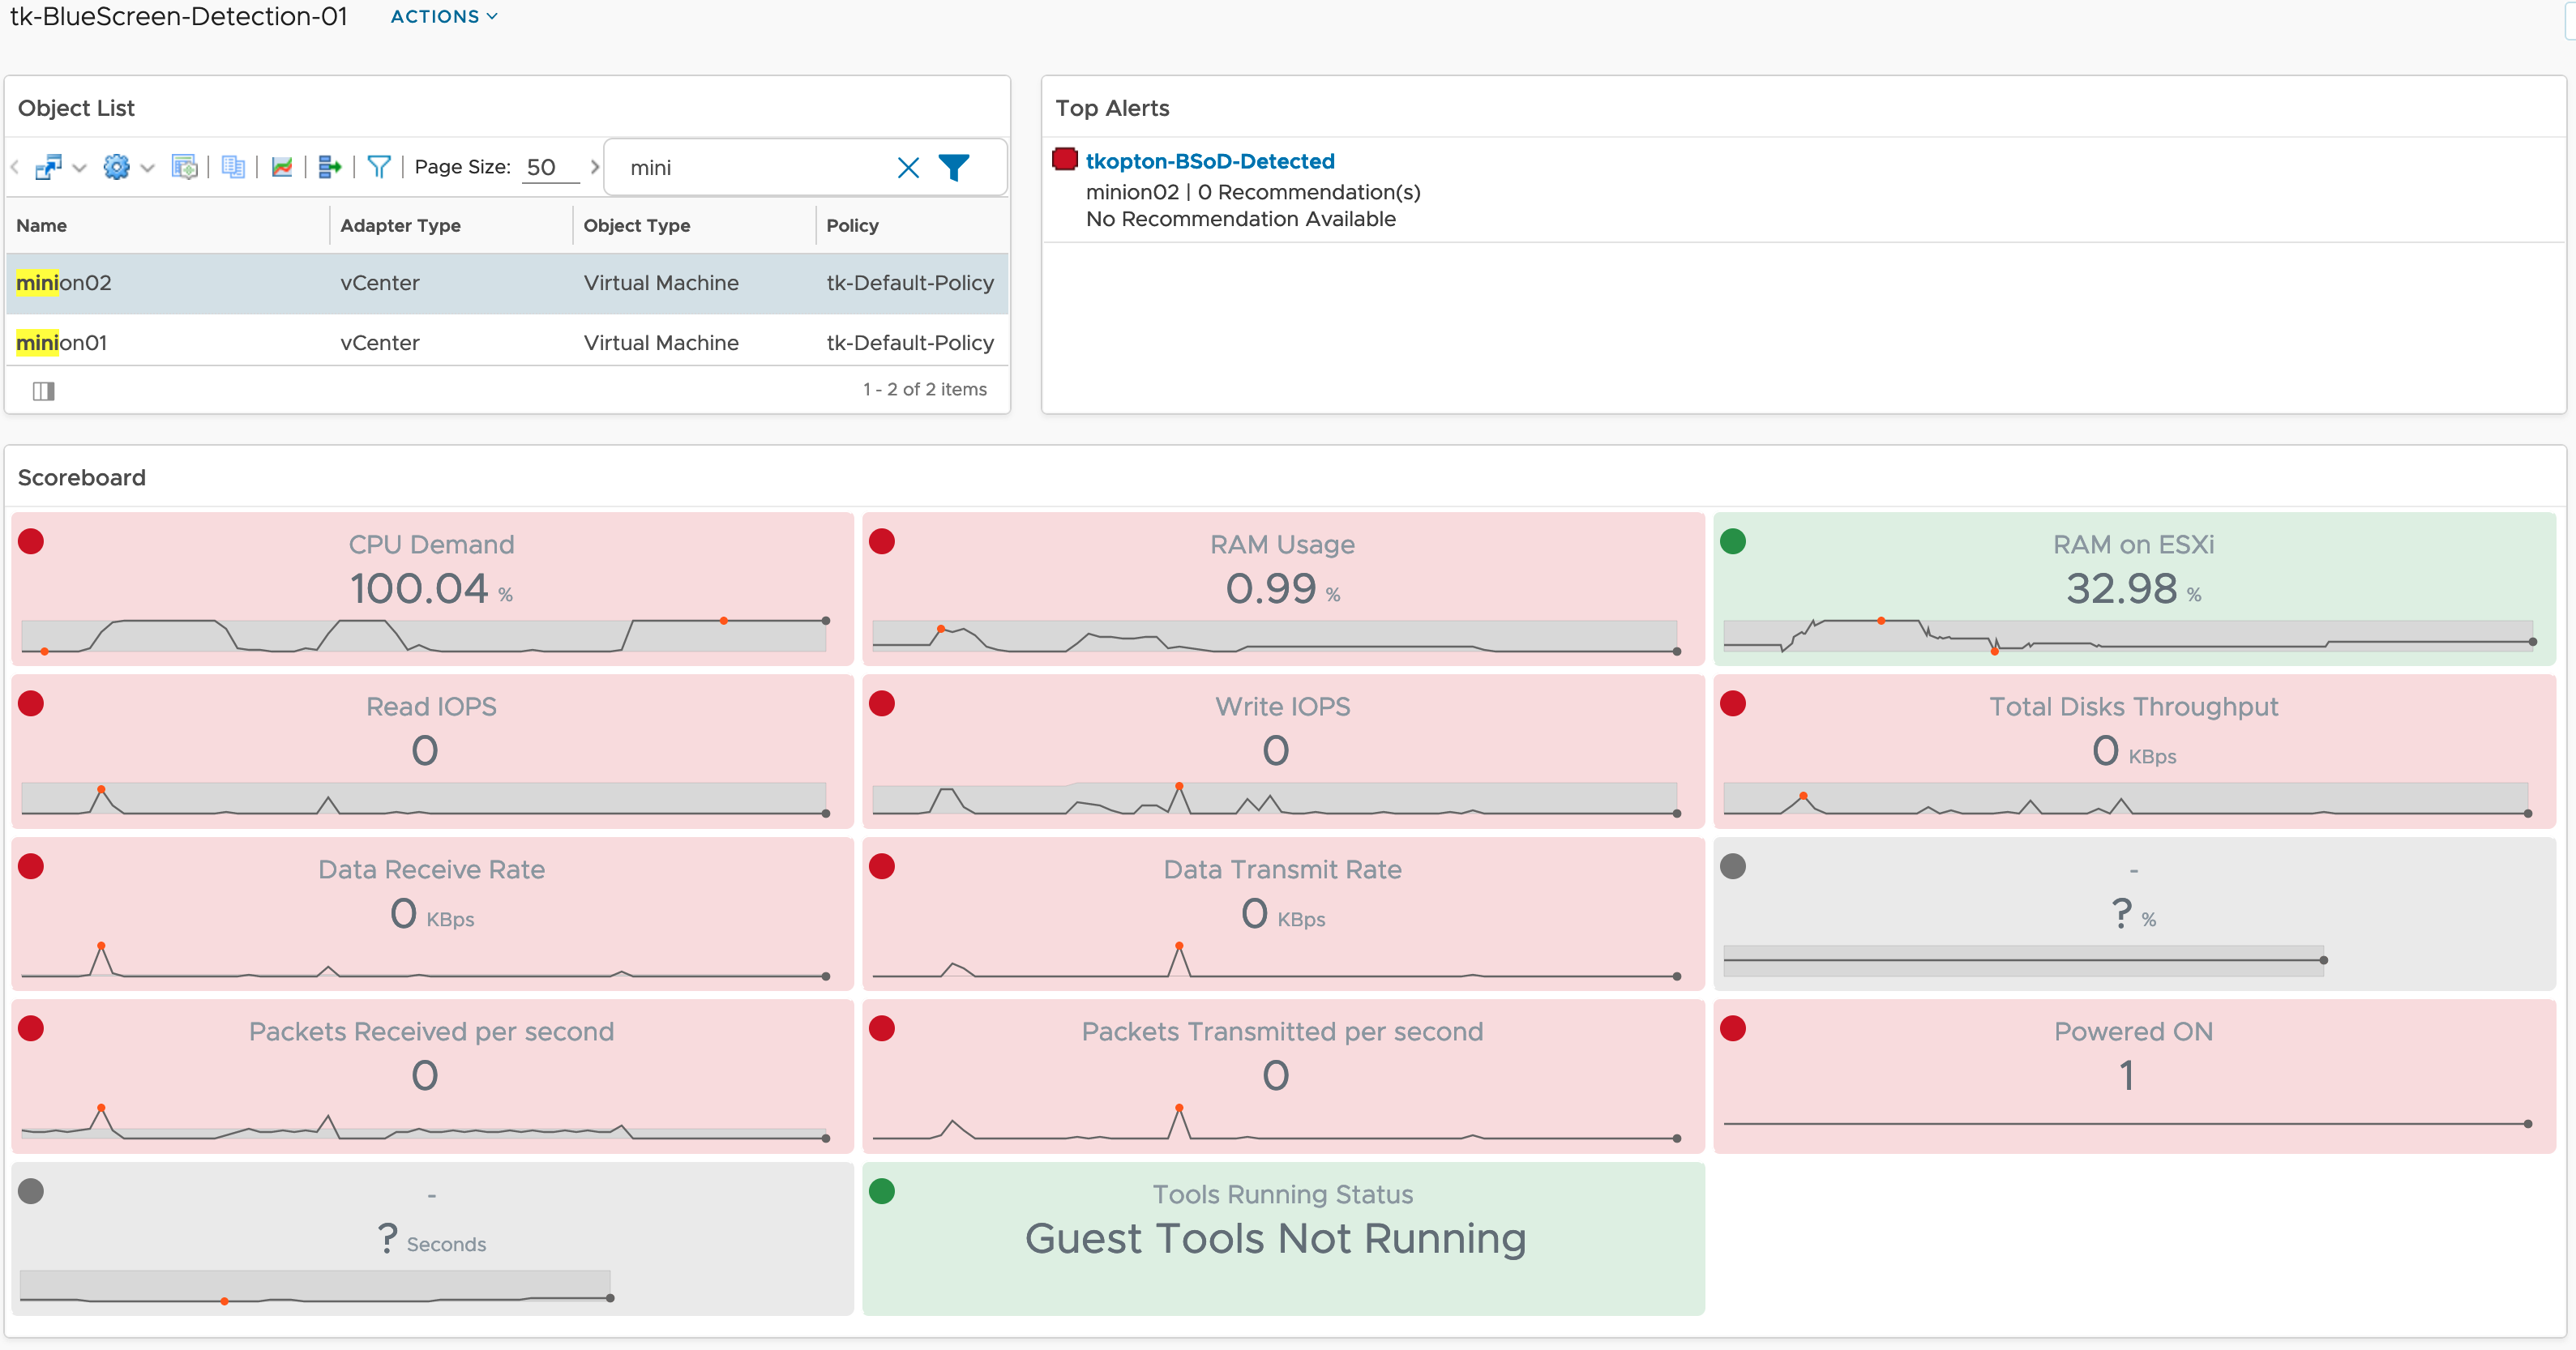
You can download the content from VMware Code.
Update 03.03.2023
One of my fellow colleagues (thank you Brandon) suggested to test the behavior with VMTools not running at all as it will have impact on memory usage metrics. Brandon also suggested to add or replace CPU Demand with CPU Usage as demand will be affected by high CPU usage on the ESXi host. I have added this metric to the Metric Configuration file and uploaded it to VMware Code.
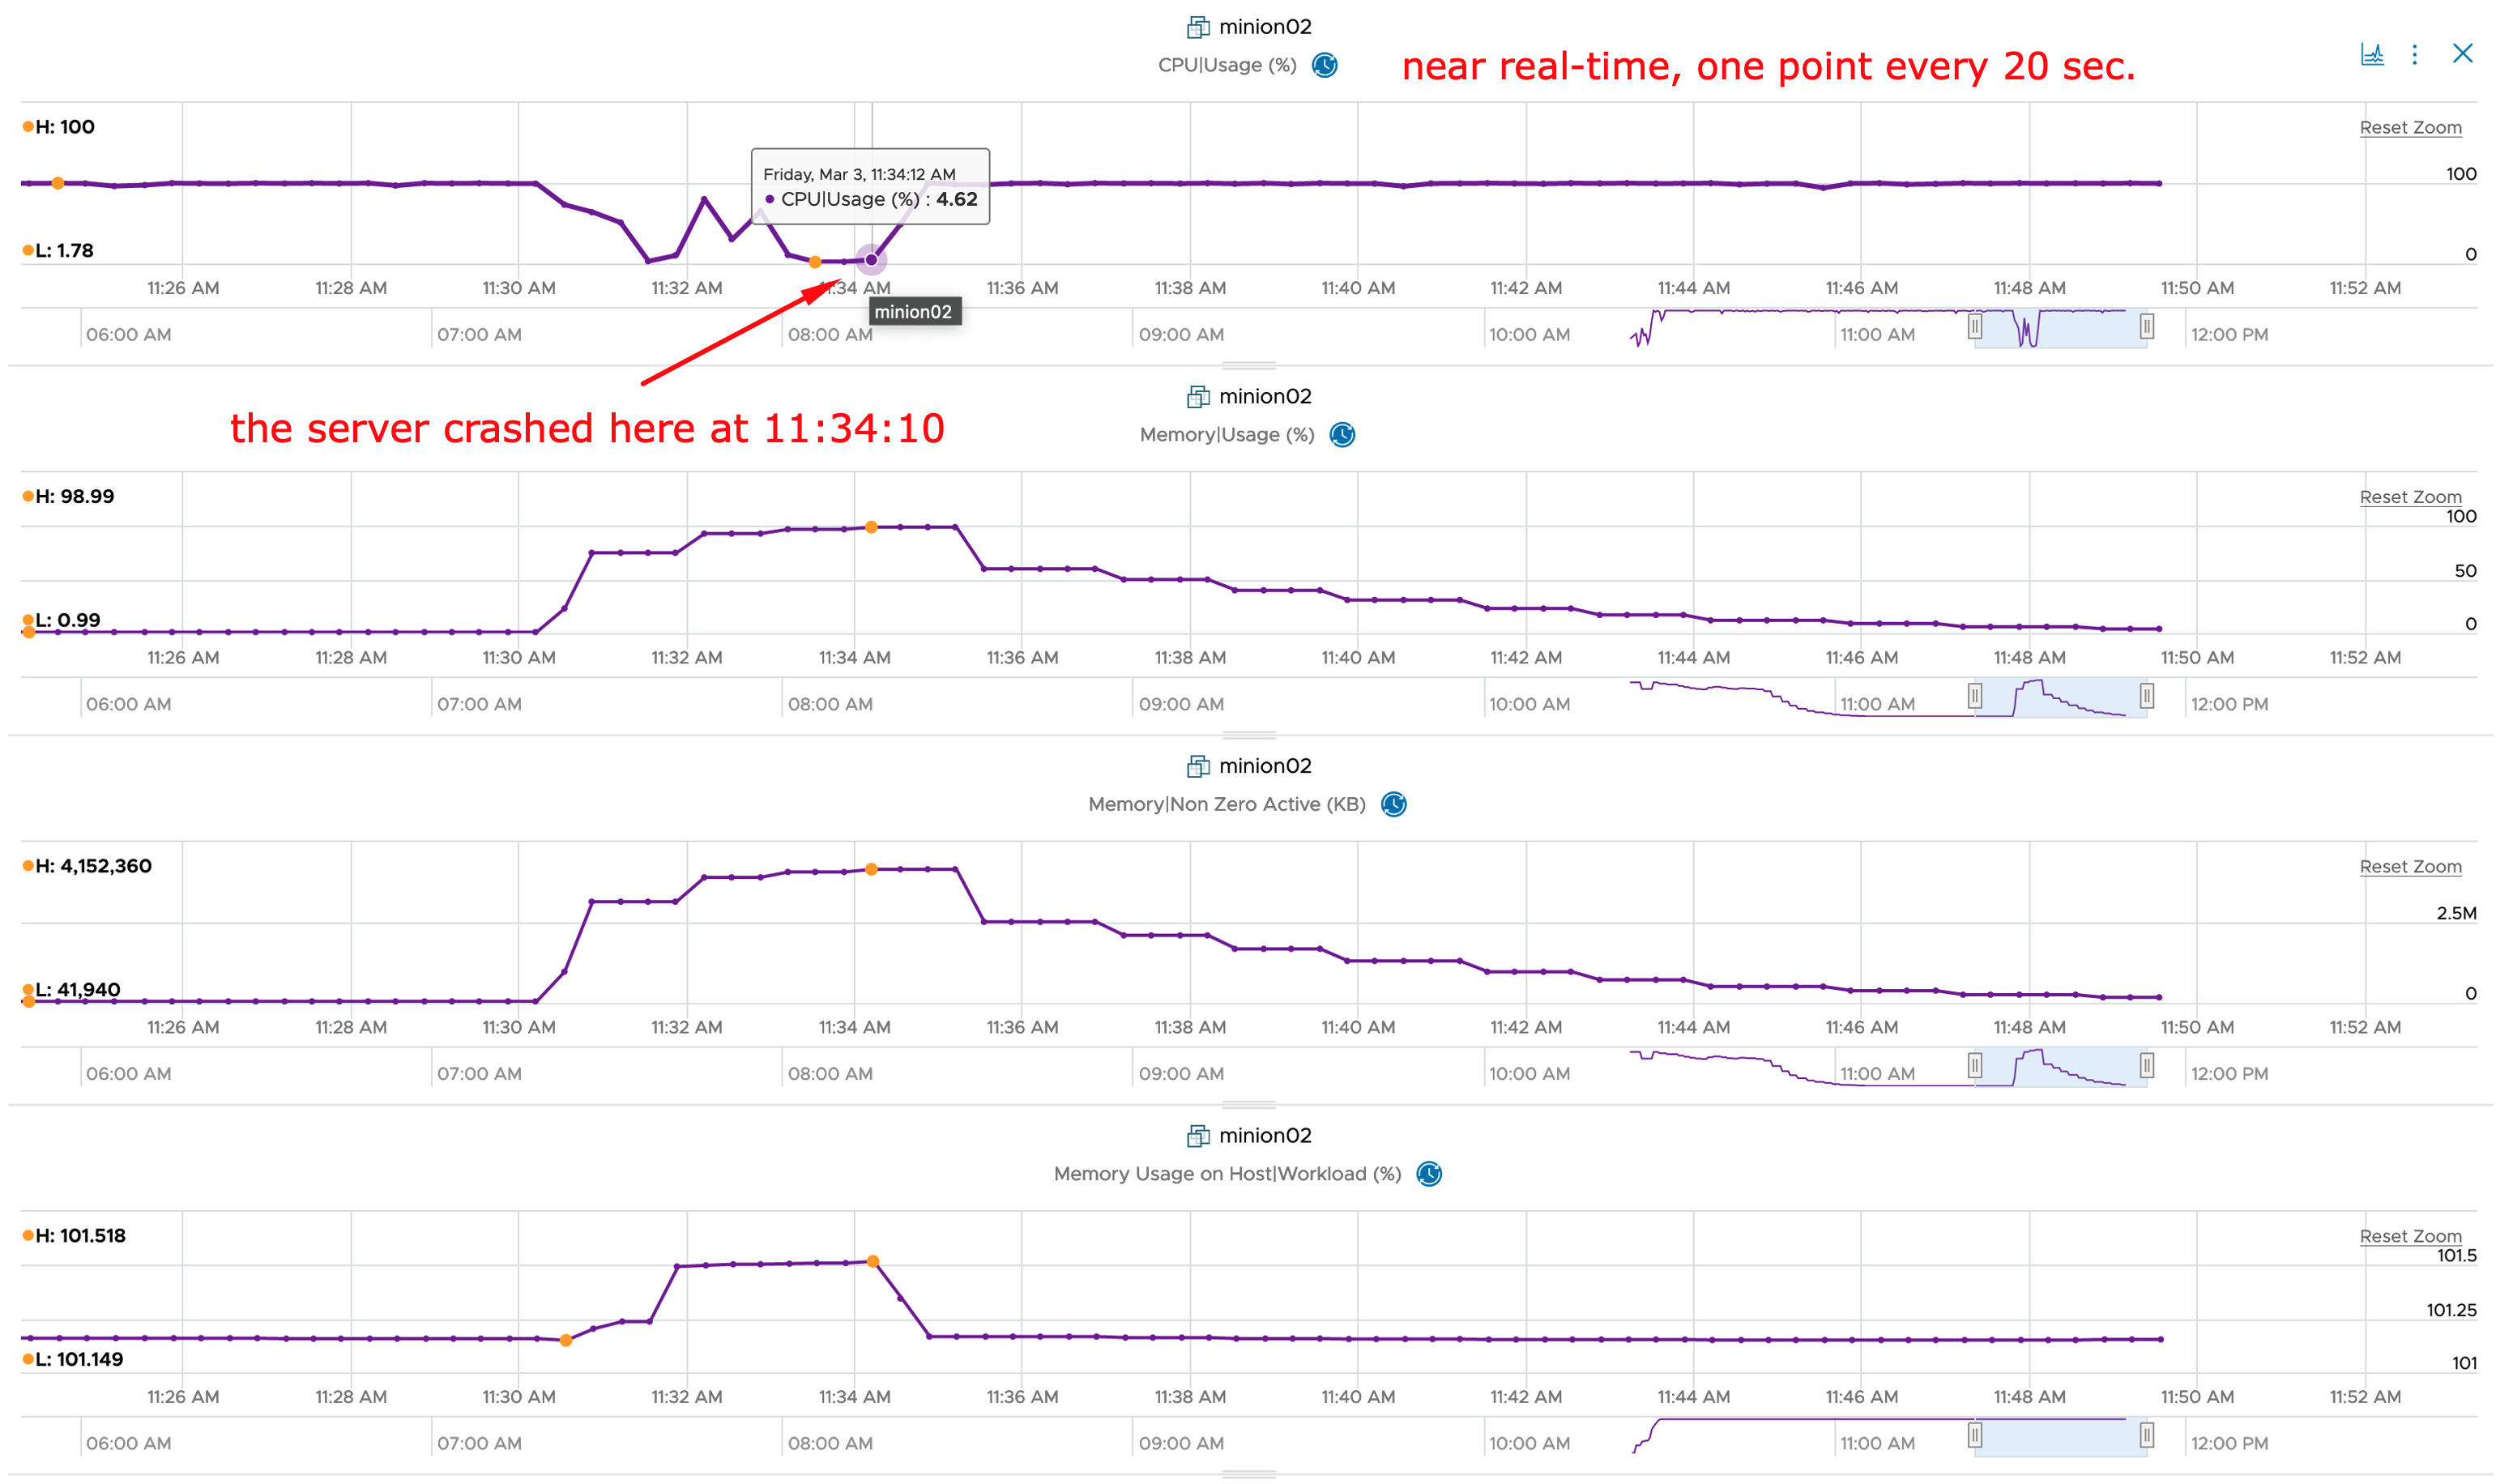
NOTE: CPU, Disk and Network metrics are basically instantly affected by the crash, whereas memory slowly converges toward 0.
As you can see in the following screenshot, you can use CPU Usage instead of CPU Demand as it will also increase to 98-100% after the BSoD.

I would like to mention once again that the CPU metrics are available basically right after the crash and if you use Aria Operations SaaS, which is definitely the recommended way of using Aria Operations, you will get the symptoms triggered roughly after 40-60 seconds.
The memory metrics, as you can see in the next picture, will need several minutes to decrease to a level near 0.
Stay safe.
Thomas – https://twitter.com/ThomasKopto