As is likely known to everyone, the integration between VMware Aria Operations and Aria Operations for Logs involves forwarding alarms generated in Aria Operations for Logs to Aria Operations. If the integration has also established the link between the origin of the log message that triggered the alarm and the object in Aria Operations, the alarm in Aria Operations will be specifically “attached” to the correct object.
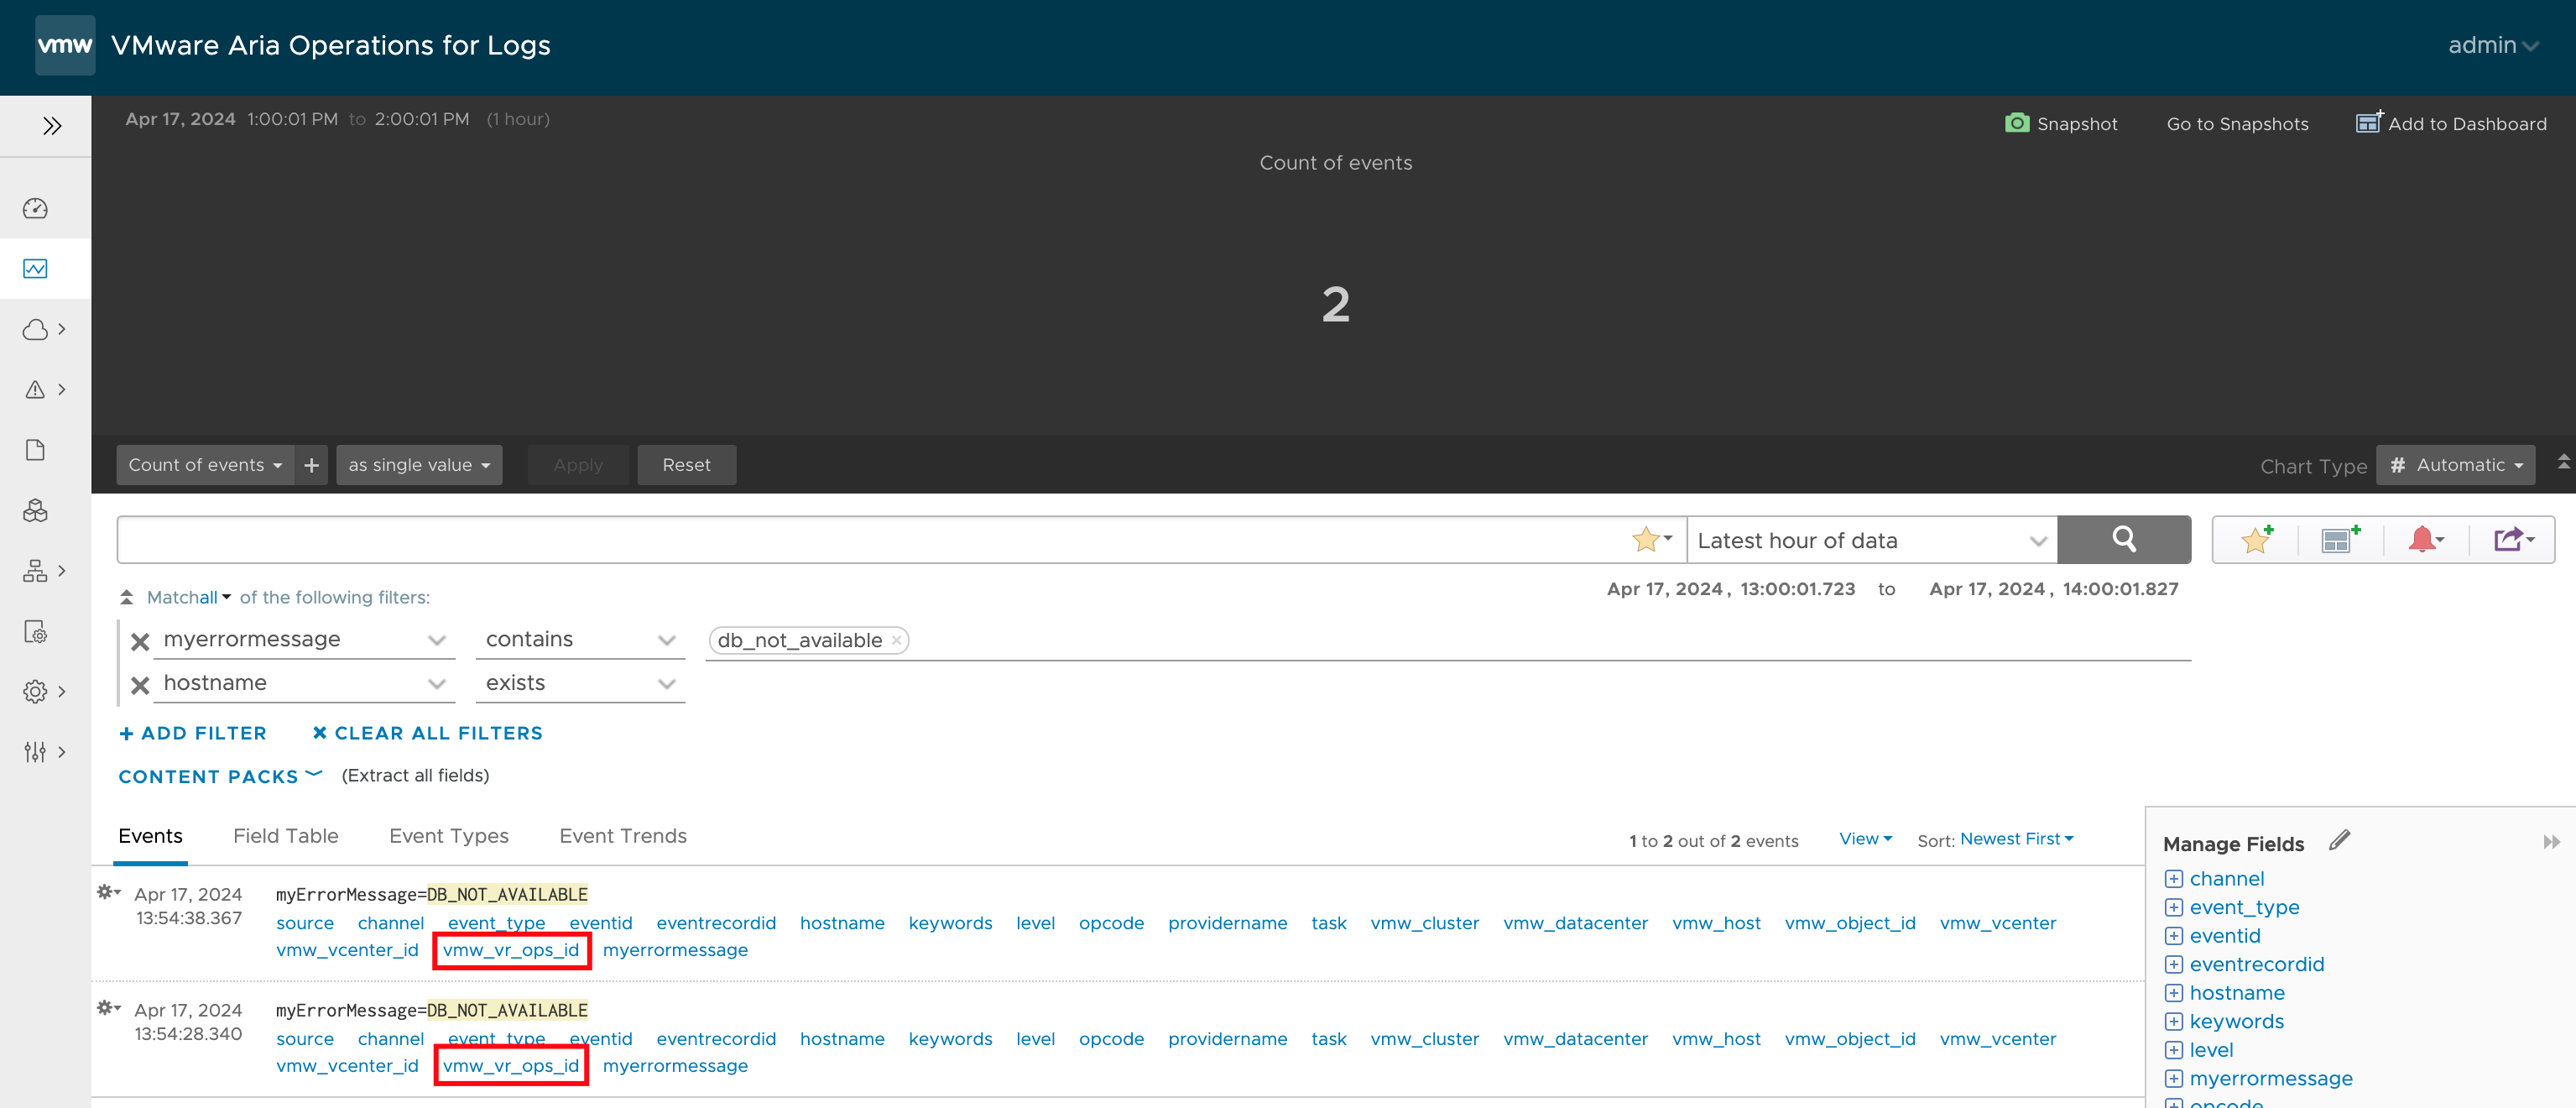
As seen in the following two images, the static field vmw_vr_ops_id ensures that the alarm triggered in Aria Operations for Logs appears as a Notification Event on the affected object in Aria Operations. In my case a virtual machine experiencing issues with an application.
Figure 01: Log messages in Aria Operations for Logs triggering a configured alert.Figure 02: Notification Event in Aria Operations.
This functionality is completely sufficient for many use cases and helps to quickly detect problems and identify their root causes.
However, there are specific use cases that cannot be implemented with it. One such use case, for example, is the requirement to attach an Aria Operations Notification to such alarms, which in turn would trigger actions such as Webhooks. As of today, the configuration of Notifications does not allow Notification Events to be used as Alert Definitions under Category.
So, if we want to use Notifications for alarms coming from Aria Operations for Logs, we need to create an Alert Definition in Aria Operations, and for that, we need a Symptom. The task, therefore, is to build a Symptom from a Notification Event.
In my example, I want to build a Symptom from the Aria Operations for Logs Alarm, which arrives as a Notification Event in Aria Operations, as shown in the following image. As we can see, the name of the alarm in Aria Operations for Logs is tk-FailedESXiLoginAttempt on ${hostname}.
Figure 03: Alert definition in Aria Operations for Logs.
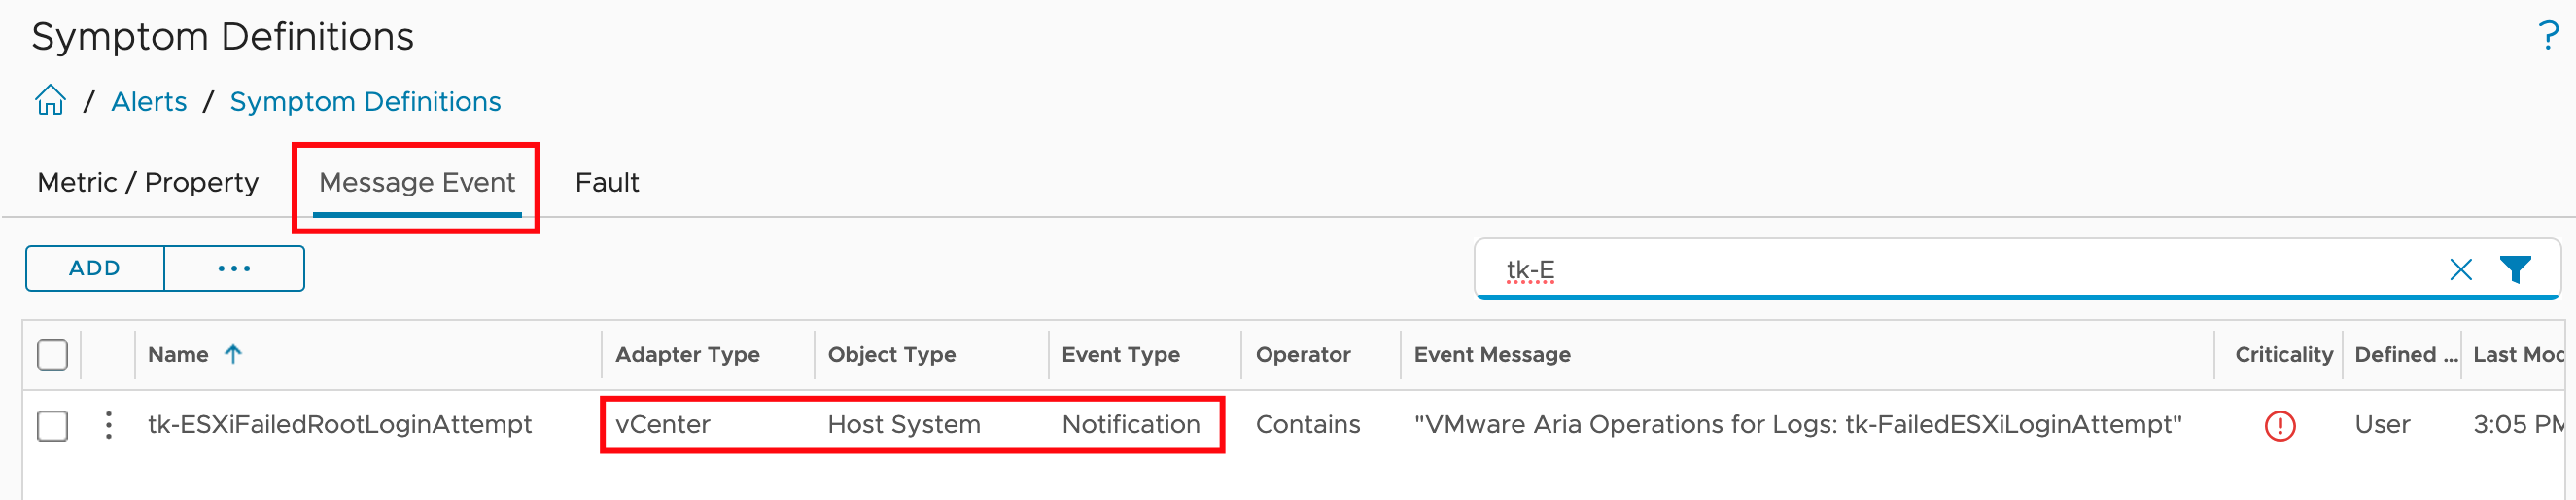
The Symptom in Aria Operations is based on a Message Event and has the Adapter, Object, and Event Types as depicted in the following image.
Figure 04: Message Event based Symptom definition in Aria Operations.
The details of the Symptom are shown in the following image. It is important to use contains as the condition here because Aria Operations for Logs replaces the field ${hostname} with the FQDN corresponding to the affected ESXi system. The string in the Contains condition is VMware Aria Operations for Logs: tk-FailedESXiLoginAttempt.
NOTE: This is the string as it is currently transmitted by Aria Operations for Logs at the time of writing this post.
Figure 05: Condition in the Symptom definition in Aria Operations.
Now, with this Symptom, an Alert Definition can be created in Aria Operations. The next images show the Alert Definition in my example.
Figure 06: Alert definition in Aria Operations.Figure 07: Details of the Alert definition in Aria Operations.
With that, the Alert Definition can be further customized as usual, for example, by adding a Notification to it.
And this is how it looks in Aria Operations when someone attempts to log in to an ESXi host via SSH with an incorrect password.
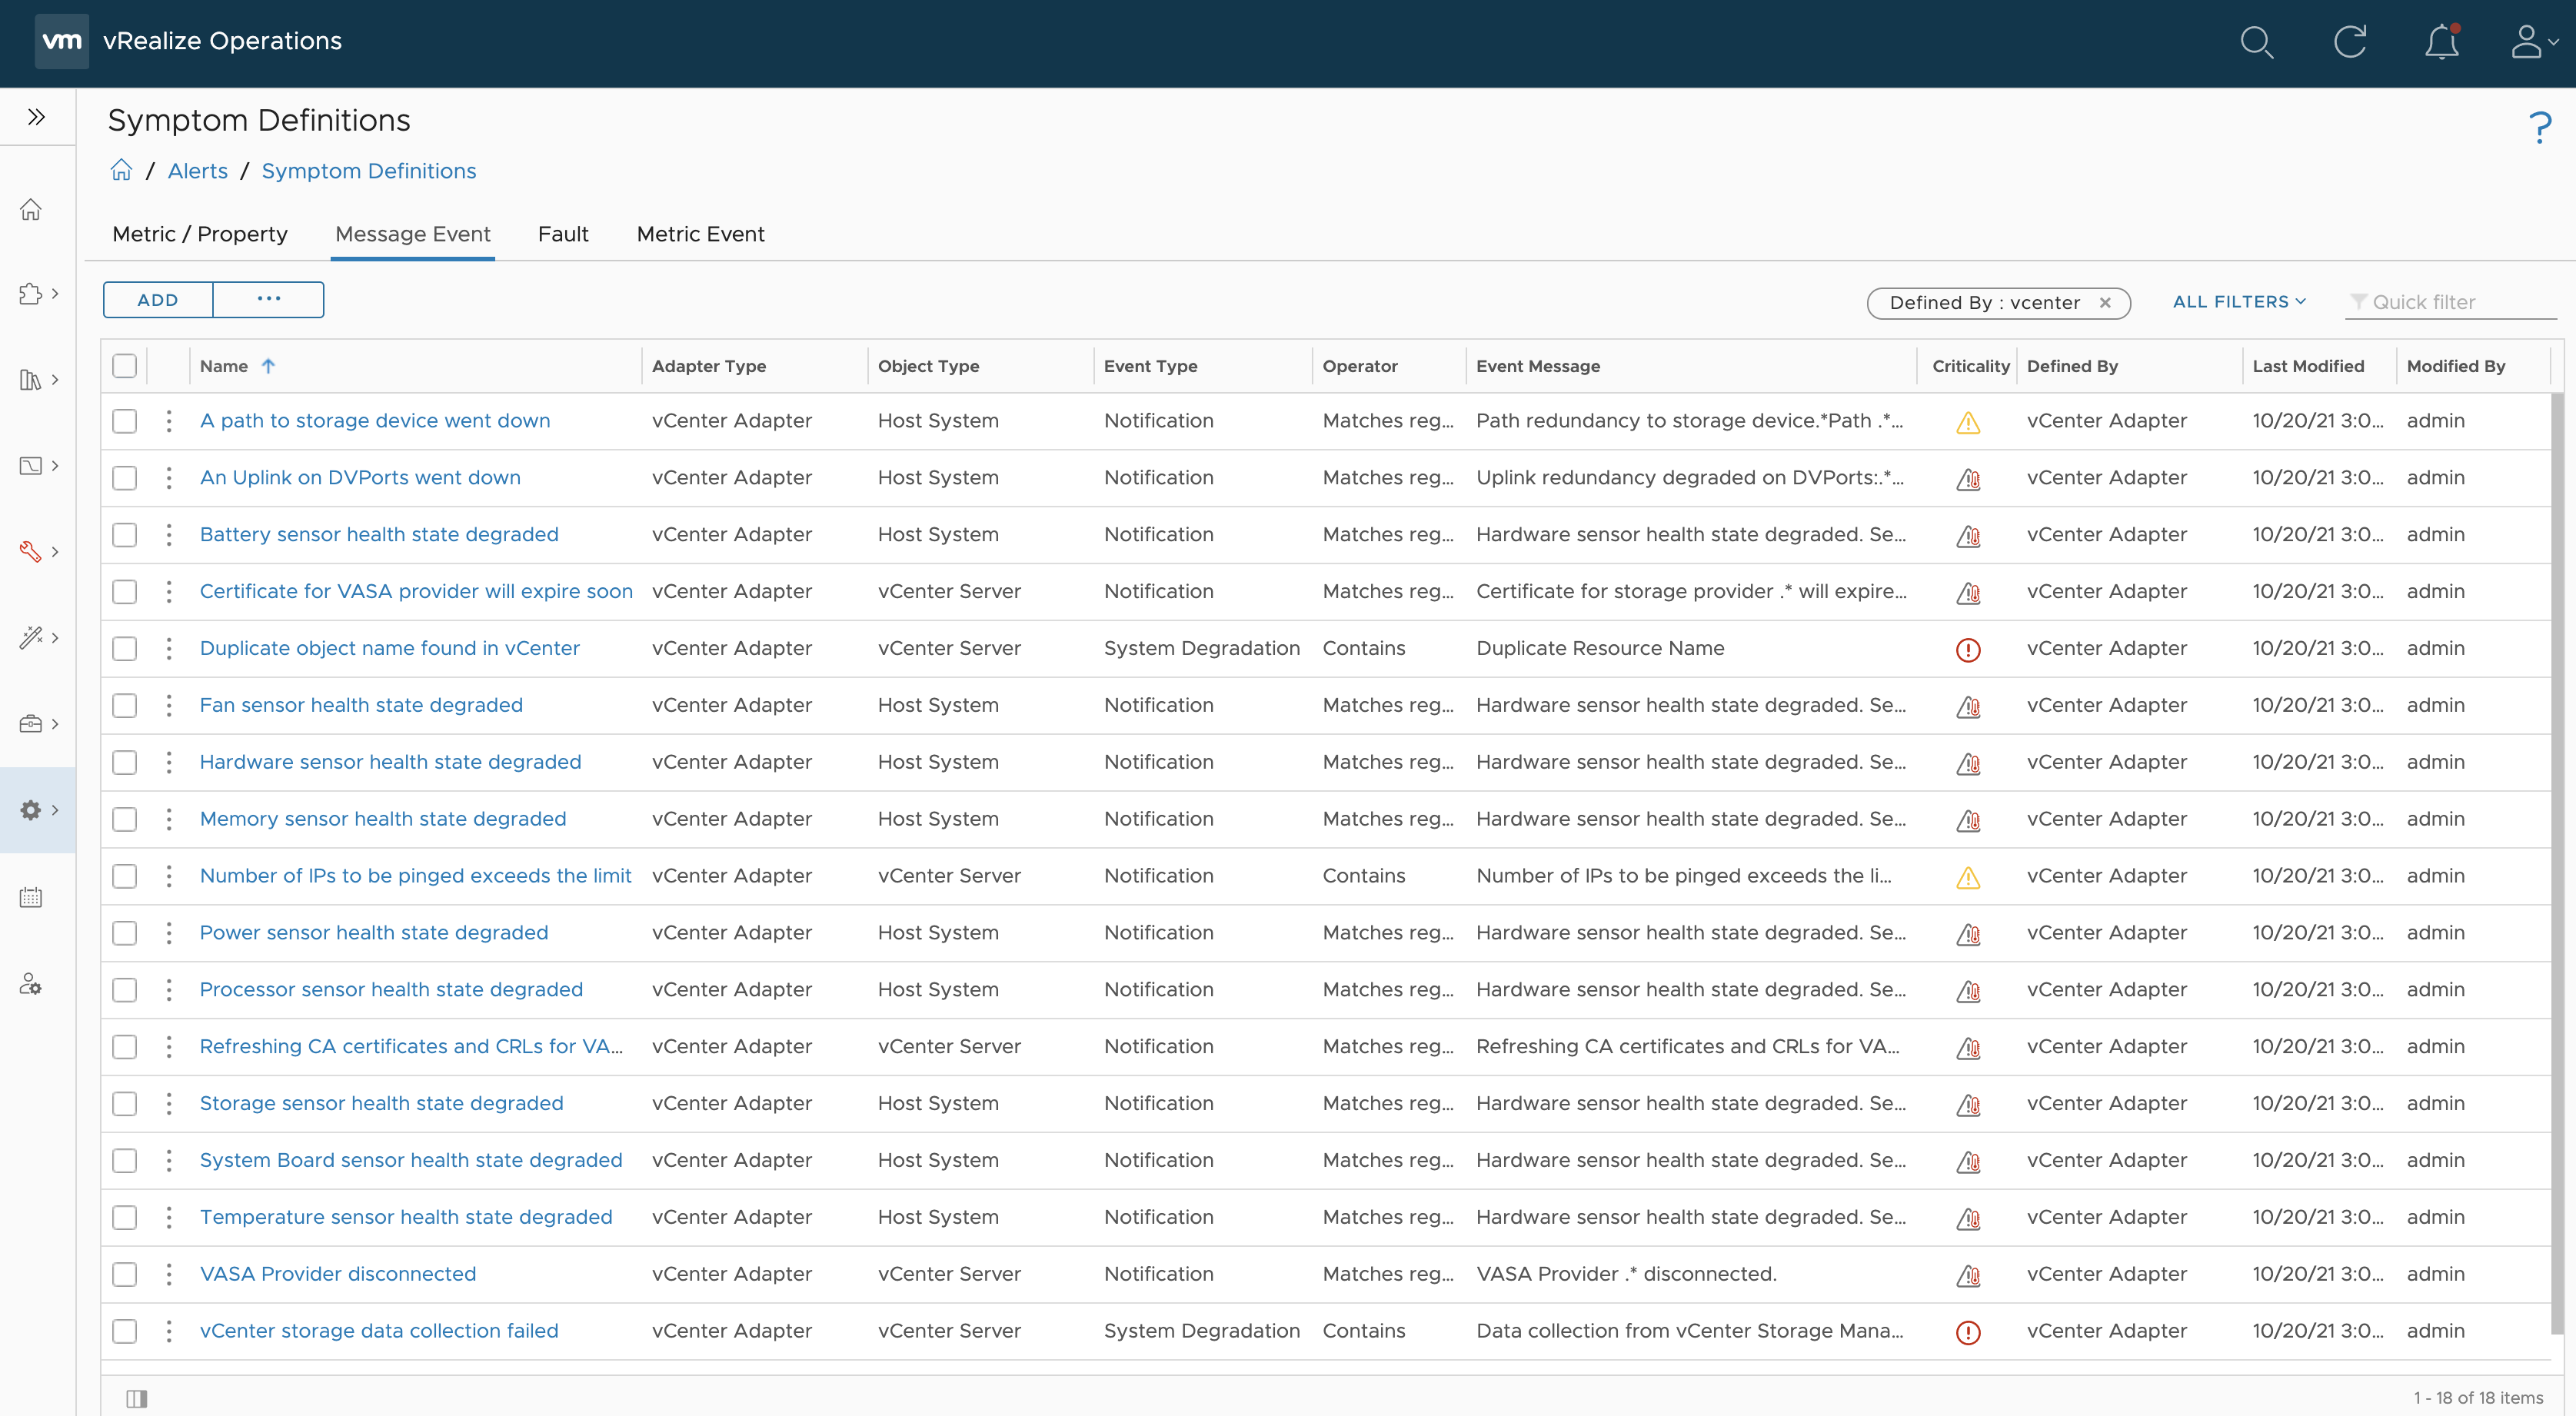
As you probably know vRealize Operations provides several symptom definitions based on message events as part of the vCenter Solution content OOTB. You can see some of them in the next picture.
Figure 1: vCenter adapter message event symptoms.
These events are used in alert definitions to raise vReaalize Operations alarms any time one of those events is triggered in any of the managed vCenter instances.
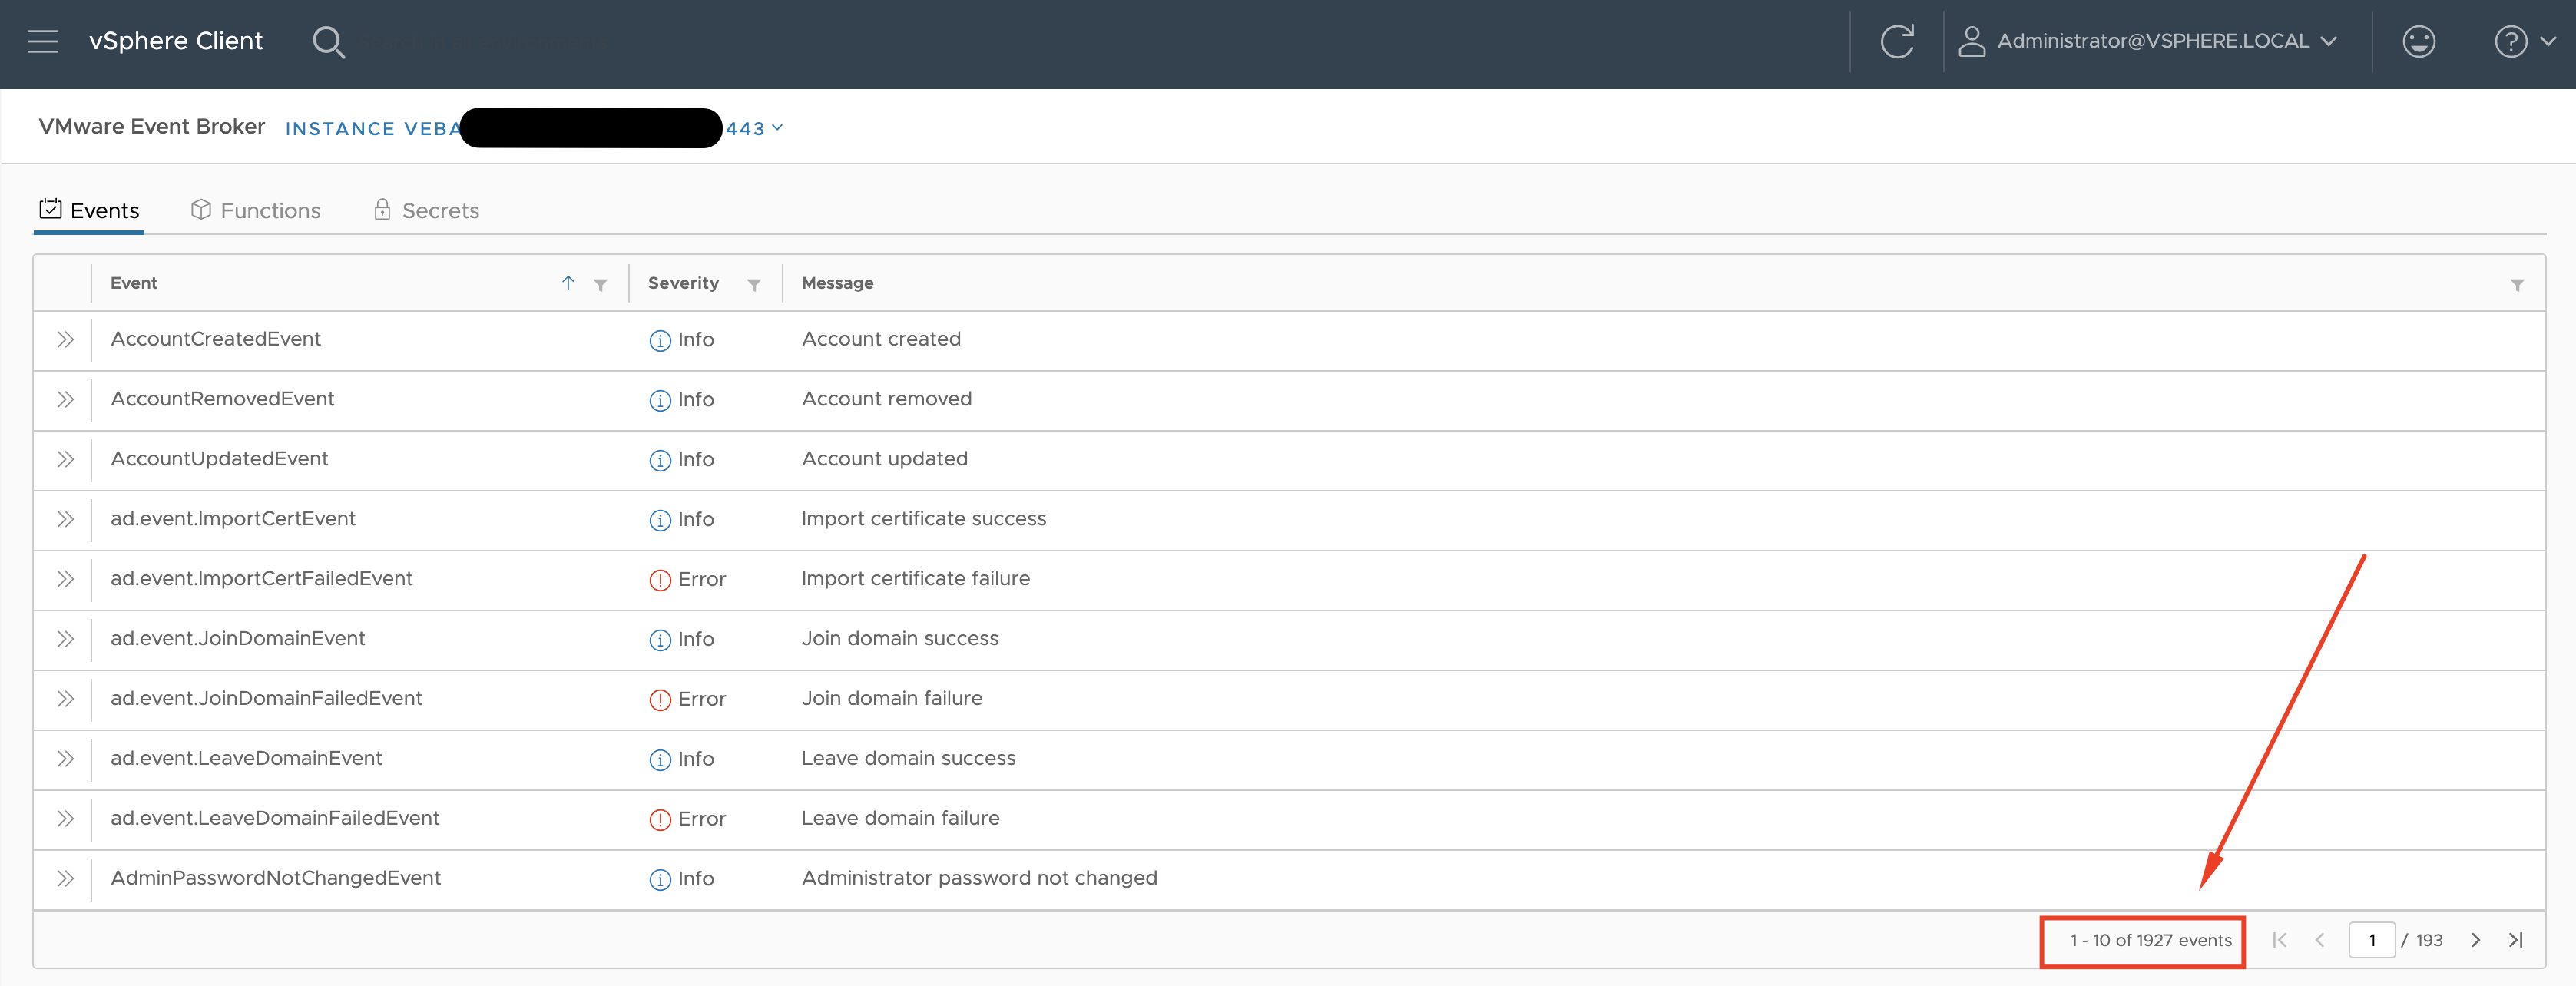
If you take a look into vCenter events in the Monitoring tab or check the available events as presented by the VMware Event Broker Appliance (VEBA) integration, you will see that there are tons of other events you may want to use to raise alerts.
Figure 2: vCenter events in VEBA plugin.
Unfortunately, this is not always as easy as creating a new message event symptom definition in vROps. Not every event is intercepted by vRealize Operations.
Now, you could of course use VEBA to run functions triggered by such events and let the functions raise alerts, create tickets, etc. This is definitely a great option and how to do that using VEBA functions and vROps is something I am planning to describe in an upcoming blog post. But there are also other ways to achieve that.
If you run vRealize Log Insight integrated with vRealize Operations in your environment, and this is a highly recommended setup, you have another, very easy option, to raise alerts on any available vCenter event, as long as that event is logged by the vCenter instance. That should be the case for all or at least the majority of the events.
In the next picture, you see all the various events I have received in my vRLI coming from vCenter in the last 48 hours. For a better visibility, I have excluded all events generated by vim.event.eventex.
Figure 3: vCenter events in vRealize Log Insight.
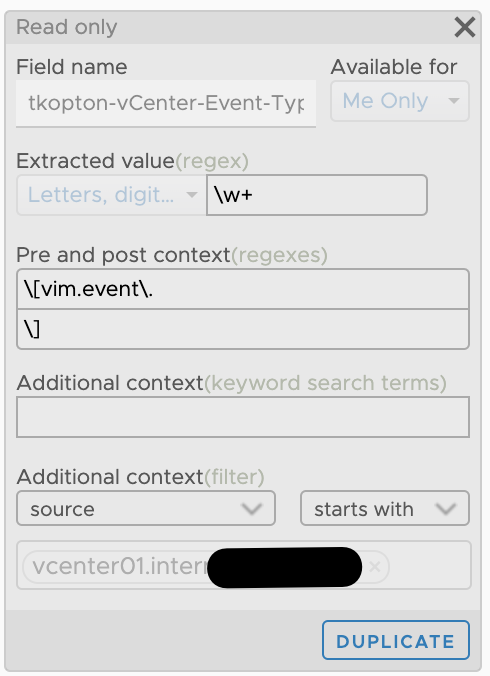
To search, filter, and display such events using their type I have created the following extracted field in vRLI:
Figure 4: vRealize Log Insight extracted field for vCenter events.
This extracted field makes it now easy to create alert definitions in vRLI.
Let us assume our use case is: “I need an alert every time any vSphere cluster configuration has been changed.“
The corresponding event in vCenter is created by vim.event.ClusterReconfiguredEvent and send to vRLI as a log message
And this is the corresponding log message in vRLI after I have changed the DRS configuration of one of my clusters.
Figure 5: ClusterReconfiguredEvent message in vRLI.
To get such events as an alarm in vRealize Operations in general we need two things:
vRealize Operations integration in vRealize Log Insight. With that integration vRLI is capable of mapping vCenter objects that are sources of messages to their objects in vROps. With this feature vRLI alarms can be forwarded to vROps and attached to exactly that object which is the original source of the message received by vRLI.
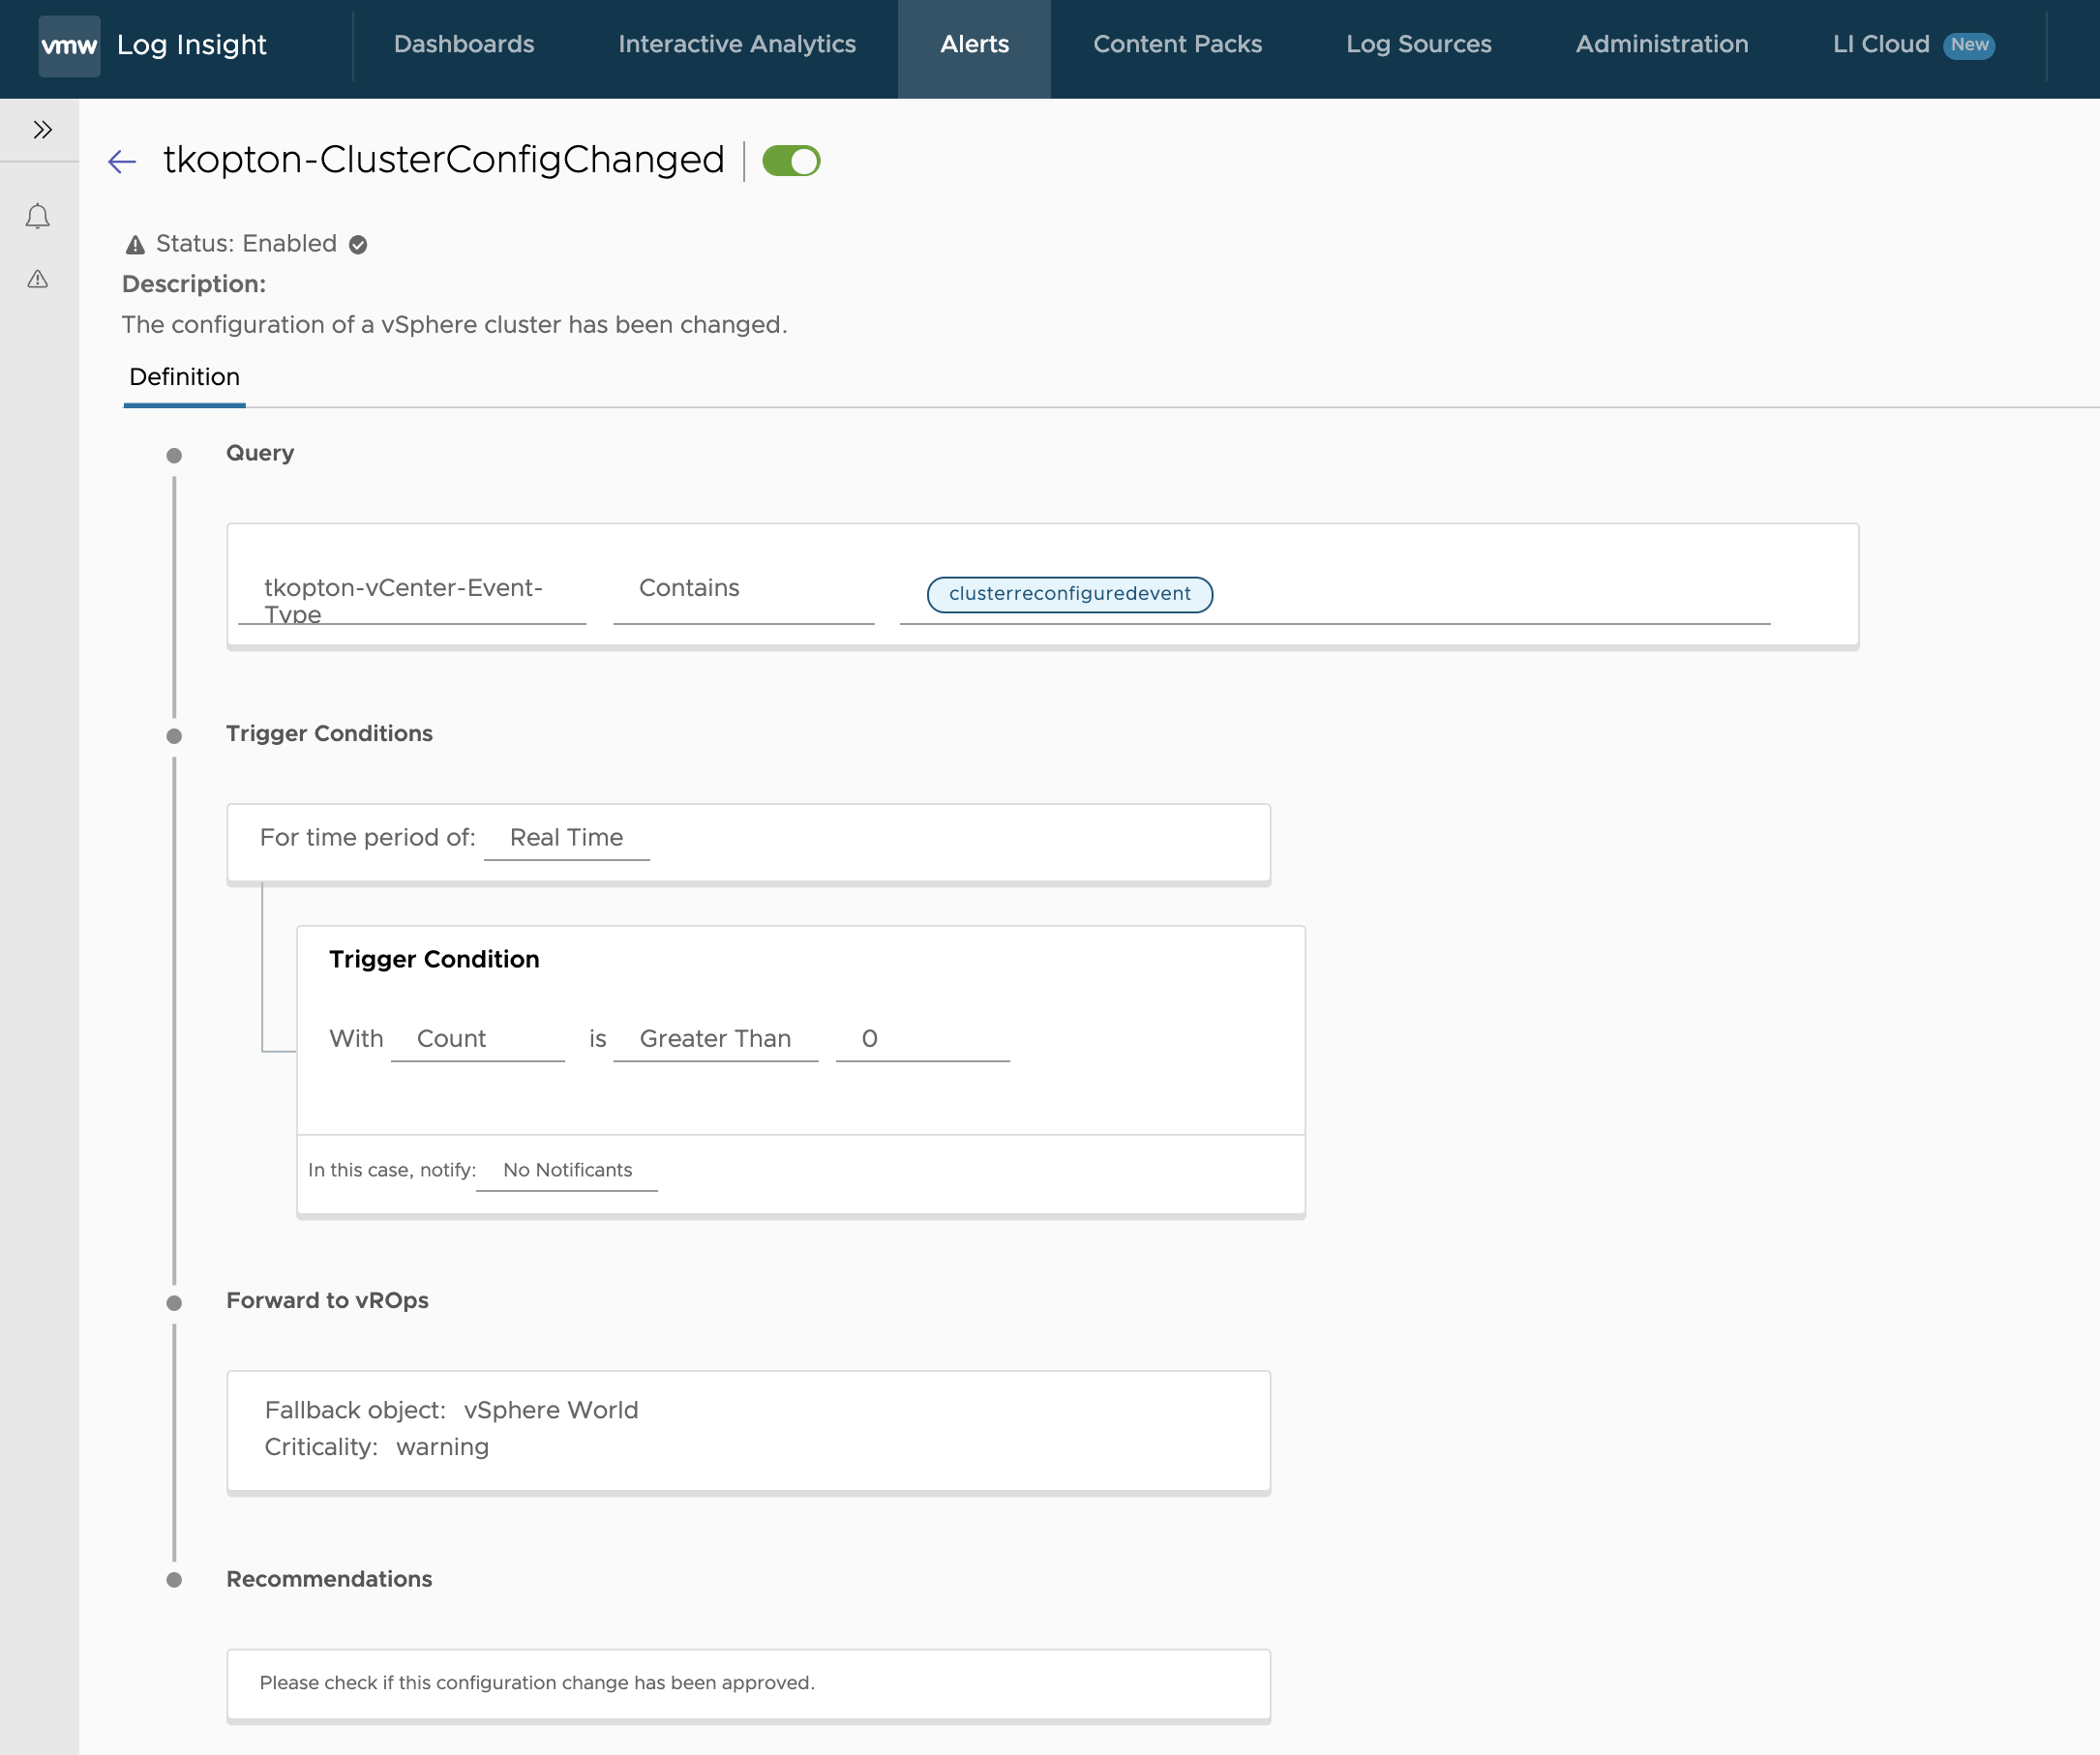
Alarm definition in vRealize Log Inisght that will be triggered every time an event of type vim.event.ClusterReconfiguredEvent has been received and this alarm will be forwarded to vROps. For this alert definitions we will use the extracted field described in figure 4.
But there is still a little more work we need to do to implement a solution that really fulfills our requirement: get an alert every time a cluster configuration change happened.
Let us assume the following situation. Someone is changing the configuration of one or several clusters very frequently. Our vRLI alert definition looks like shown in the next picture.
Figure 6: First alert definition in vRealize Log Insight.
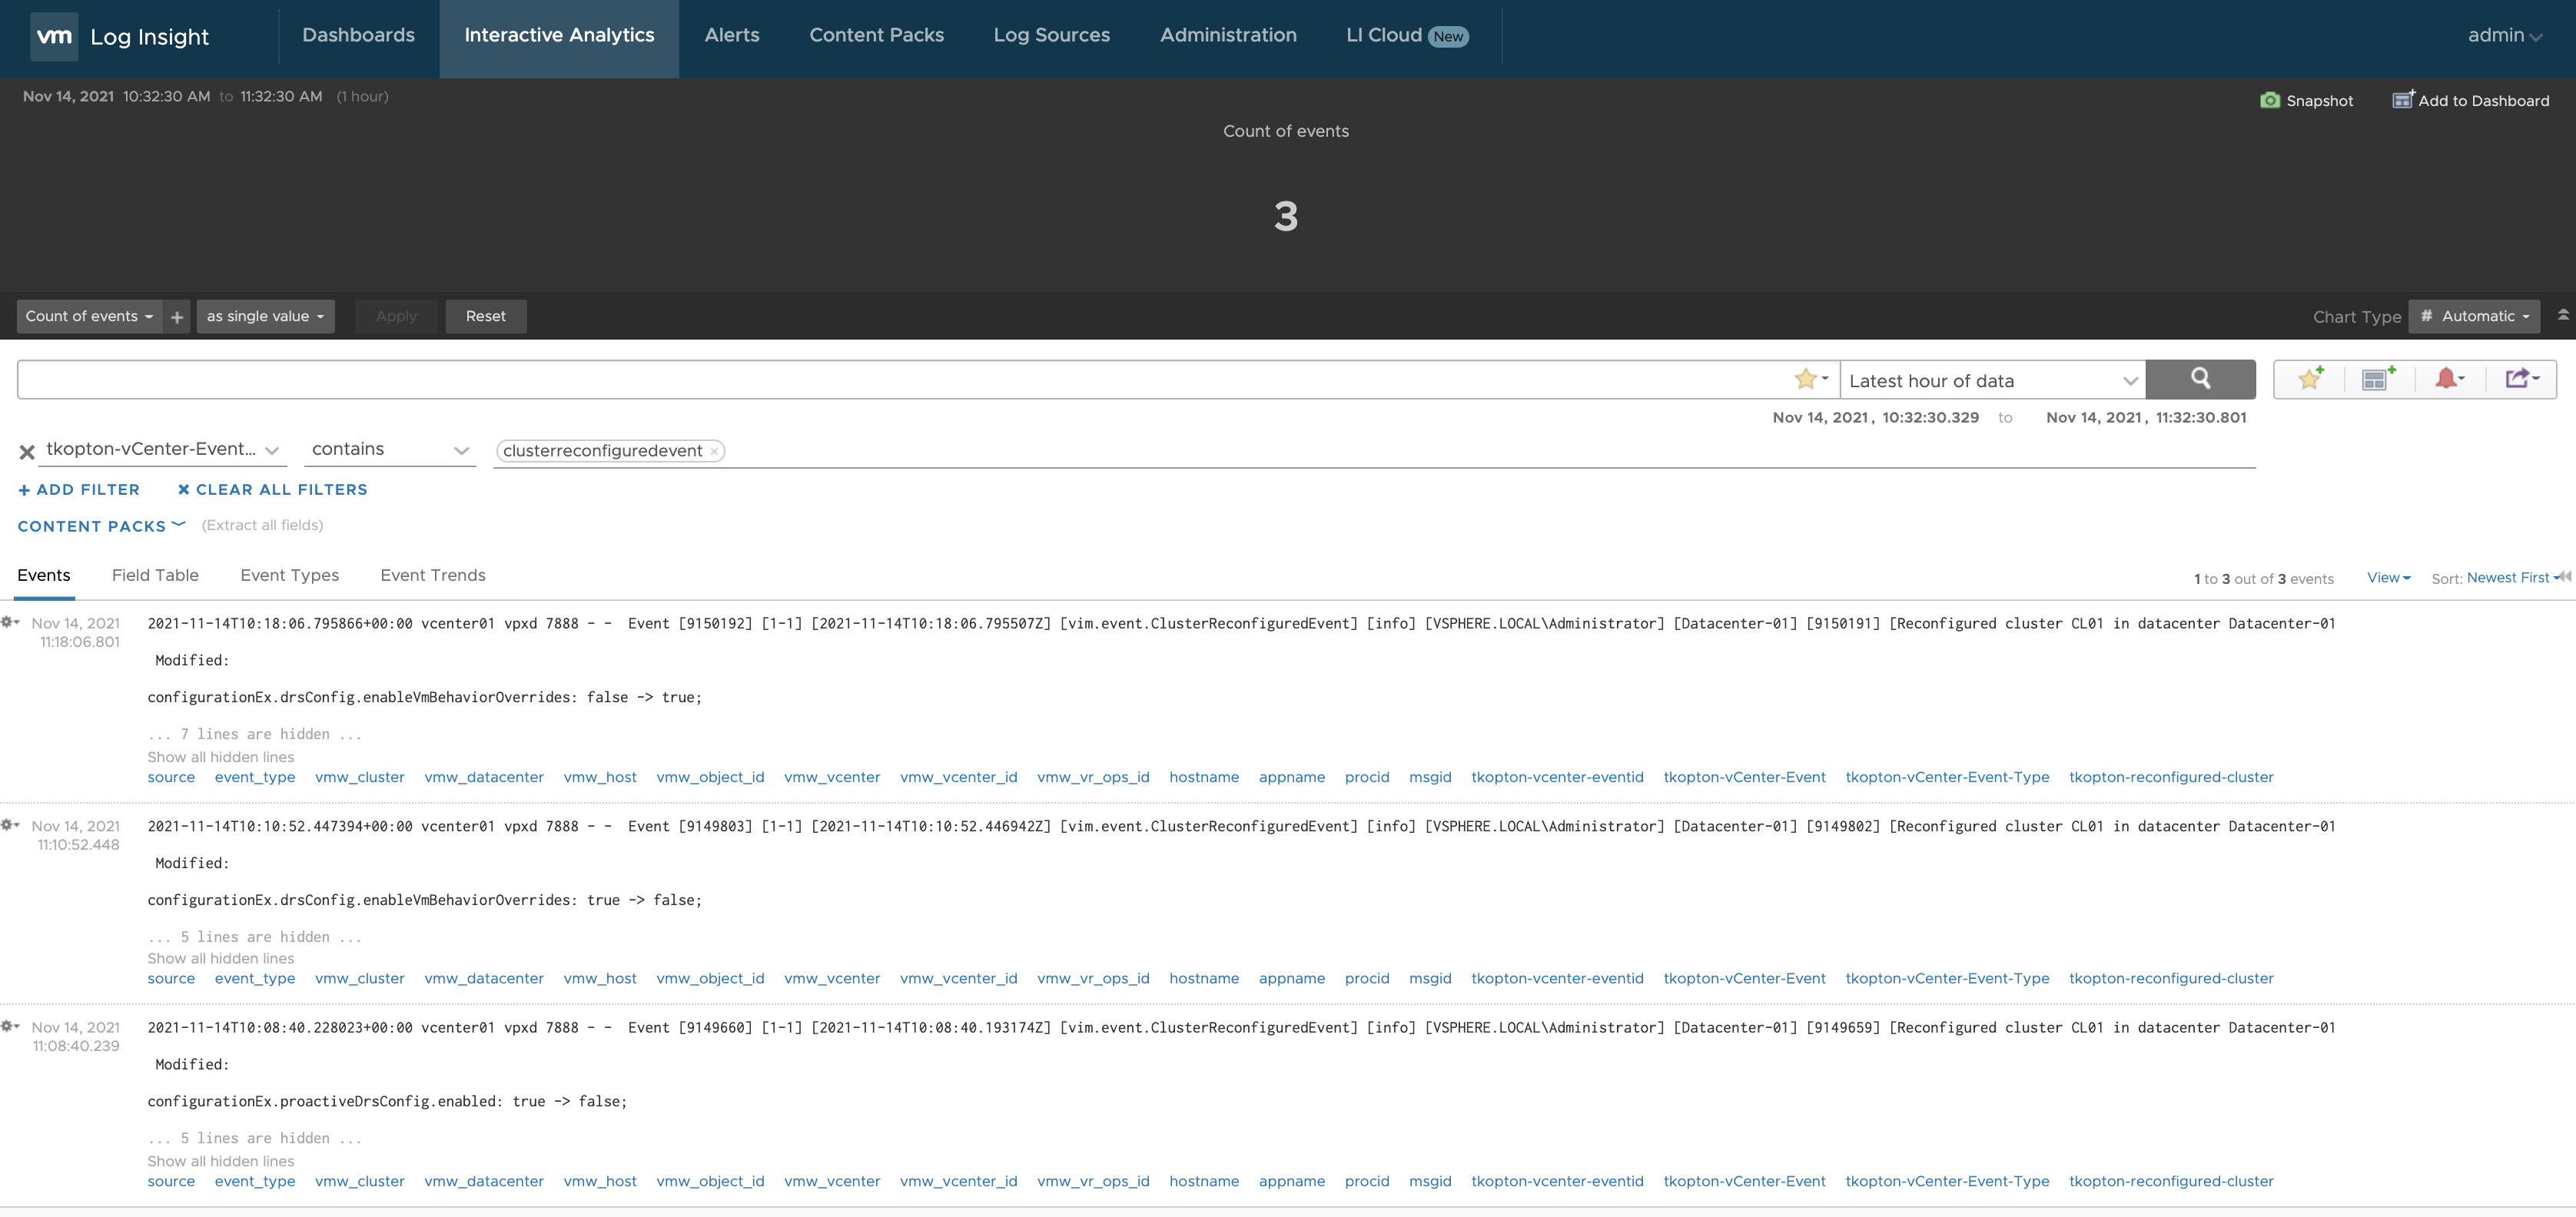
And if we now run a query on this alert definition we will see that vRLI is properly triggering the alarms. In the picture, we see the three alarms raised because of three changes during 10 minutes.
Figure 7: Event messages triggering alarms in vRLI.
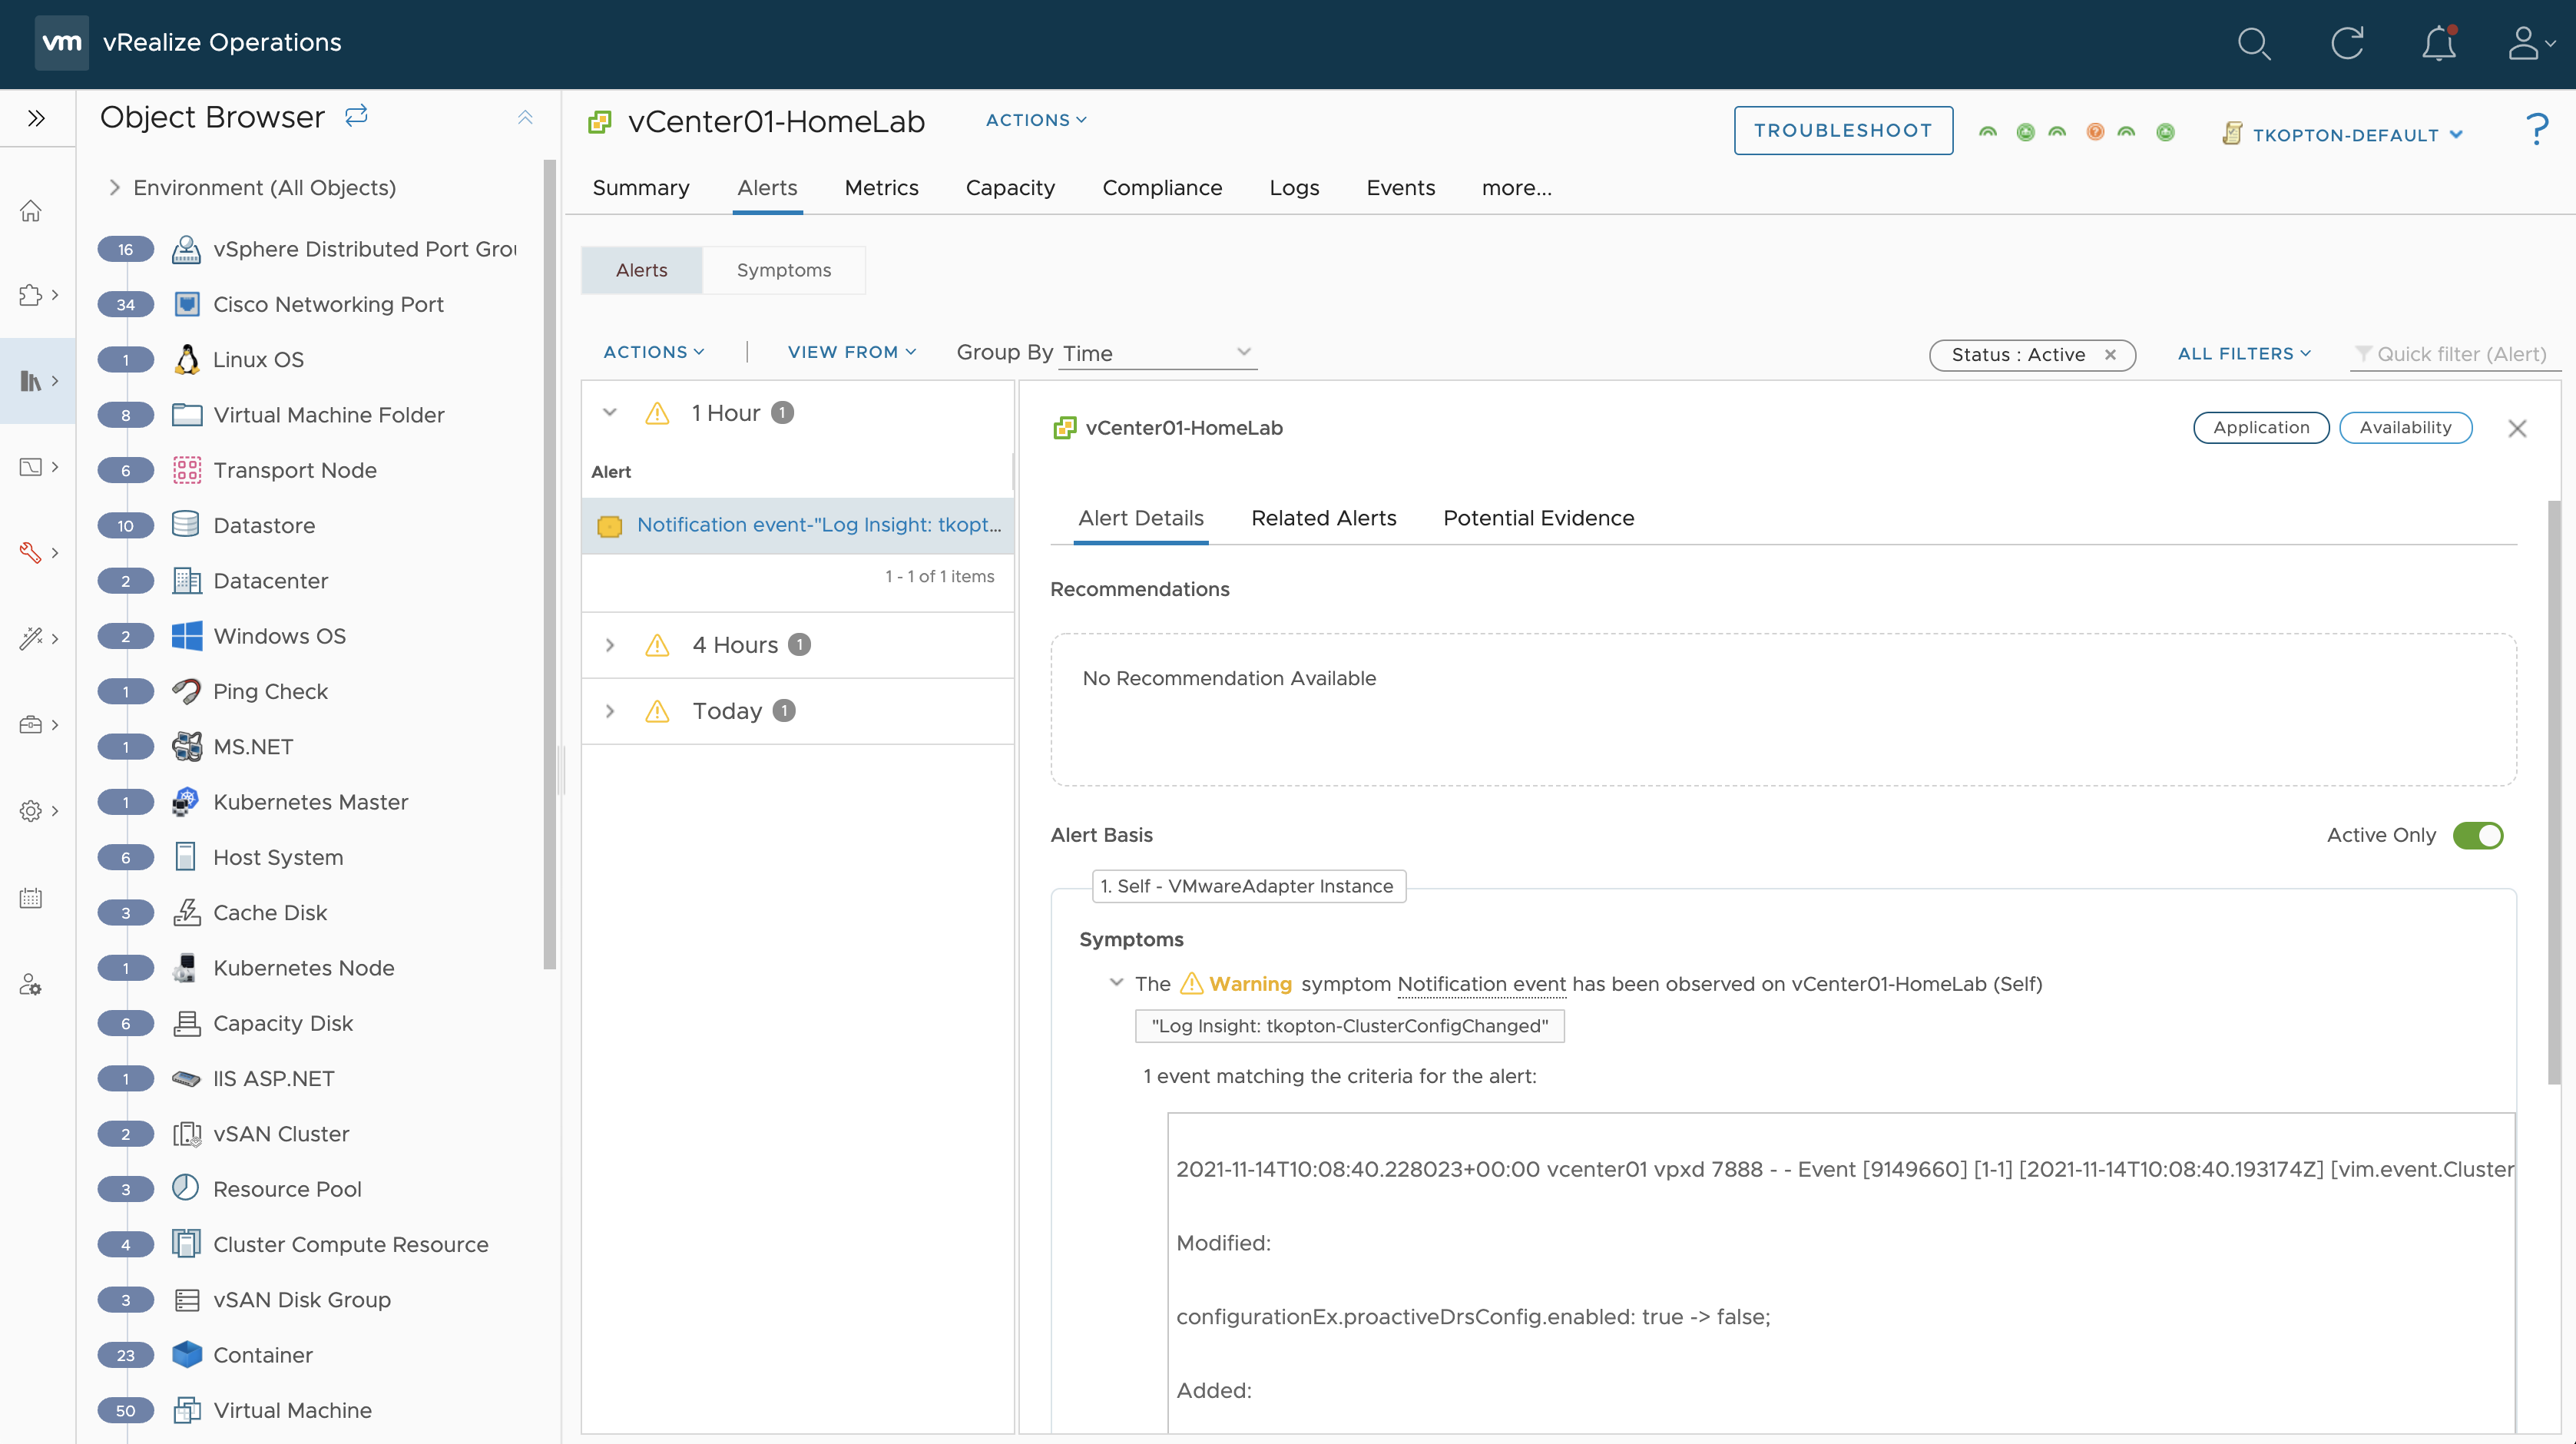
The problem with the vROps integration is, that the first alarm will be properly forwarded to vROps and will raise an alarm on the vCenter instance but any subsequent alarm coming in will not be reflected in vROps as long as the first alarm is still in the “open” state. We see the first alarm in vROps in the next figure.
Figure 8: First alarm in vRealize Operations.
This behavior is due to the same notification event text for every alarm. In that case, vROps just assumes that the next occurrence is reporting the same issue thus there is no need to raise another, duplicate alarm. In our case the notification event text is the name of the alarm as defined in the vRLI alert definition: tkopton-ClusterConfigChanged.
To change this behavior we need to include unique information for every alarm in the alarm name.
What we can do is customize the alert name by including a field or an extracted field in the format ${field-name}.
The challenge is to find such unique information in the event log message. Let’s see what we have. This is a sample event message as received in vRLI:
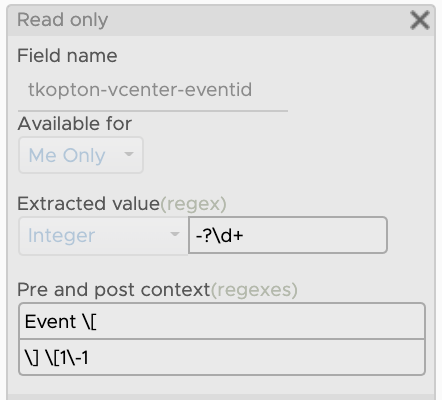
It looks like every event has a unique event ID – the key property as described in the vSphere API documentation. I have created an extracted field for the event ID:
Figure 9: vRLI extracted field for vCenter EventID.
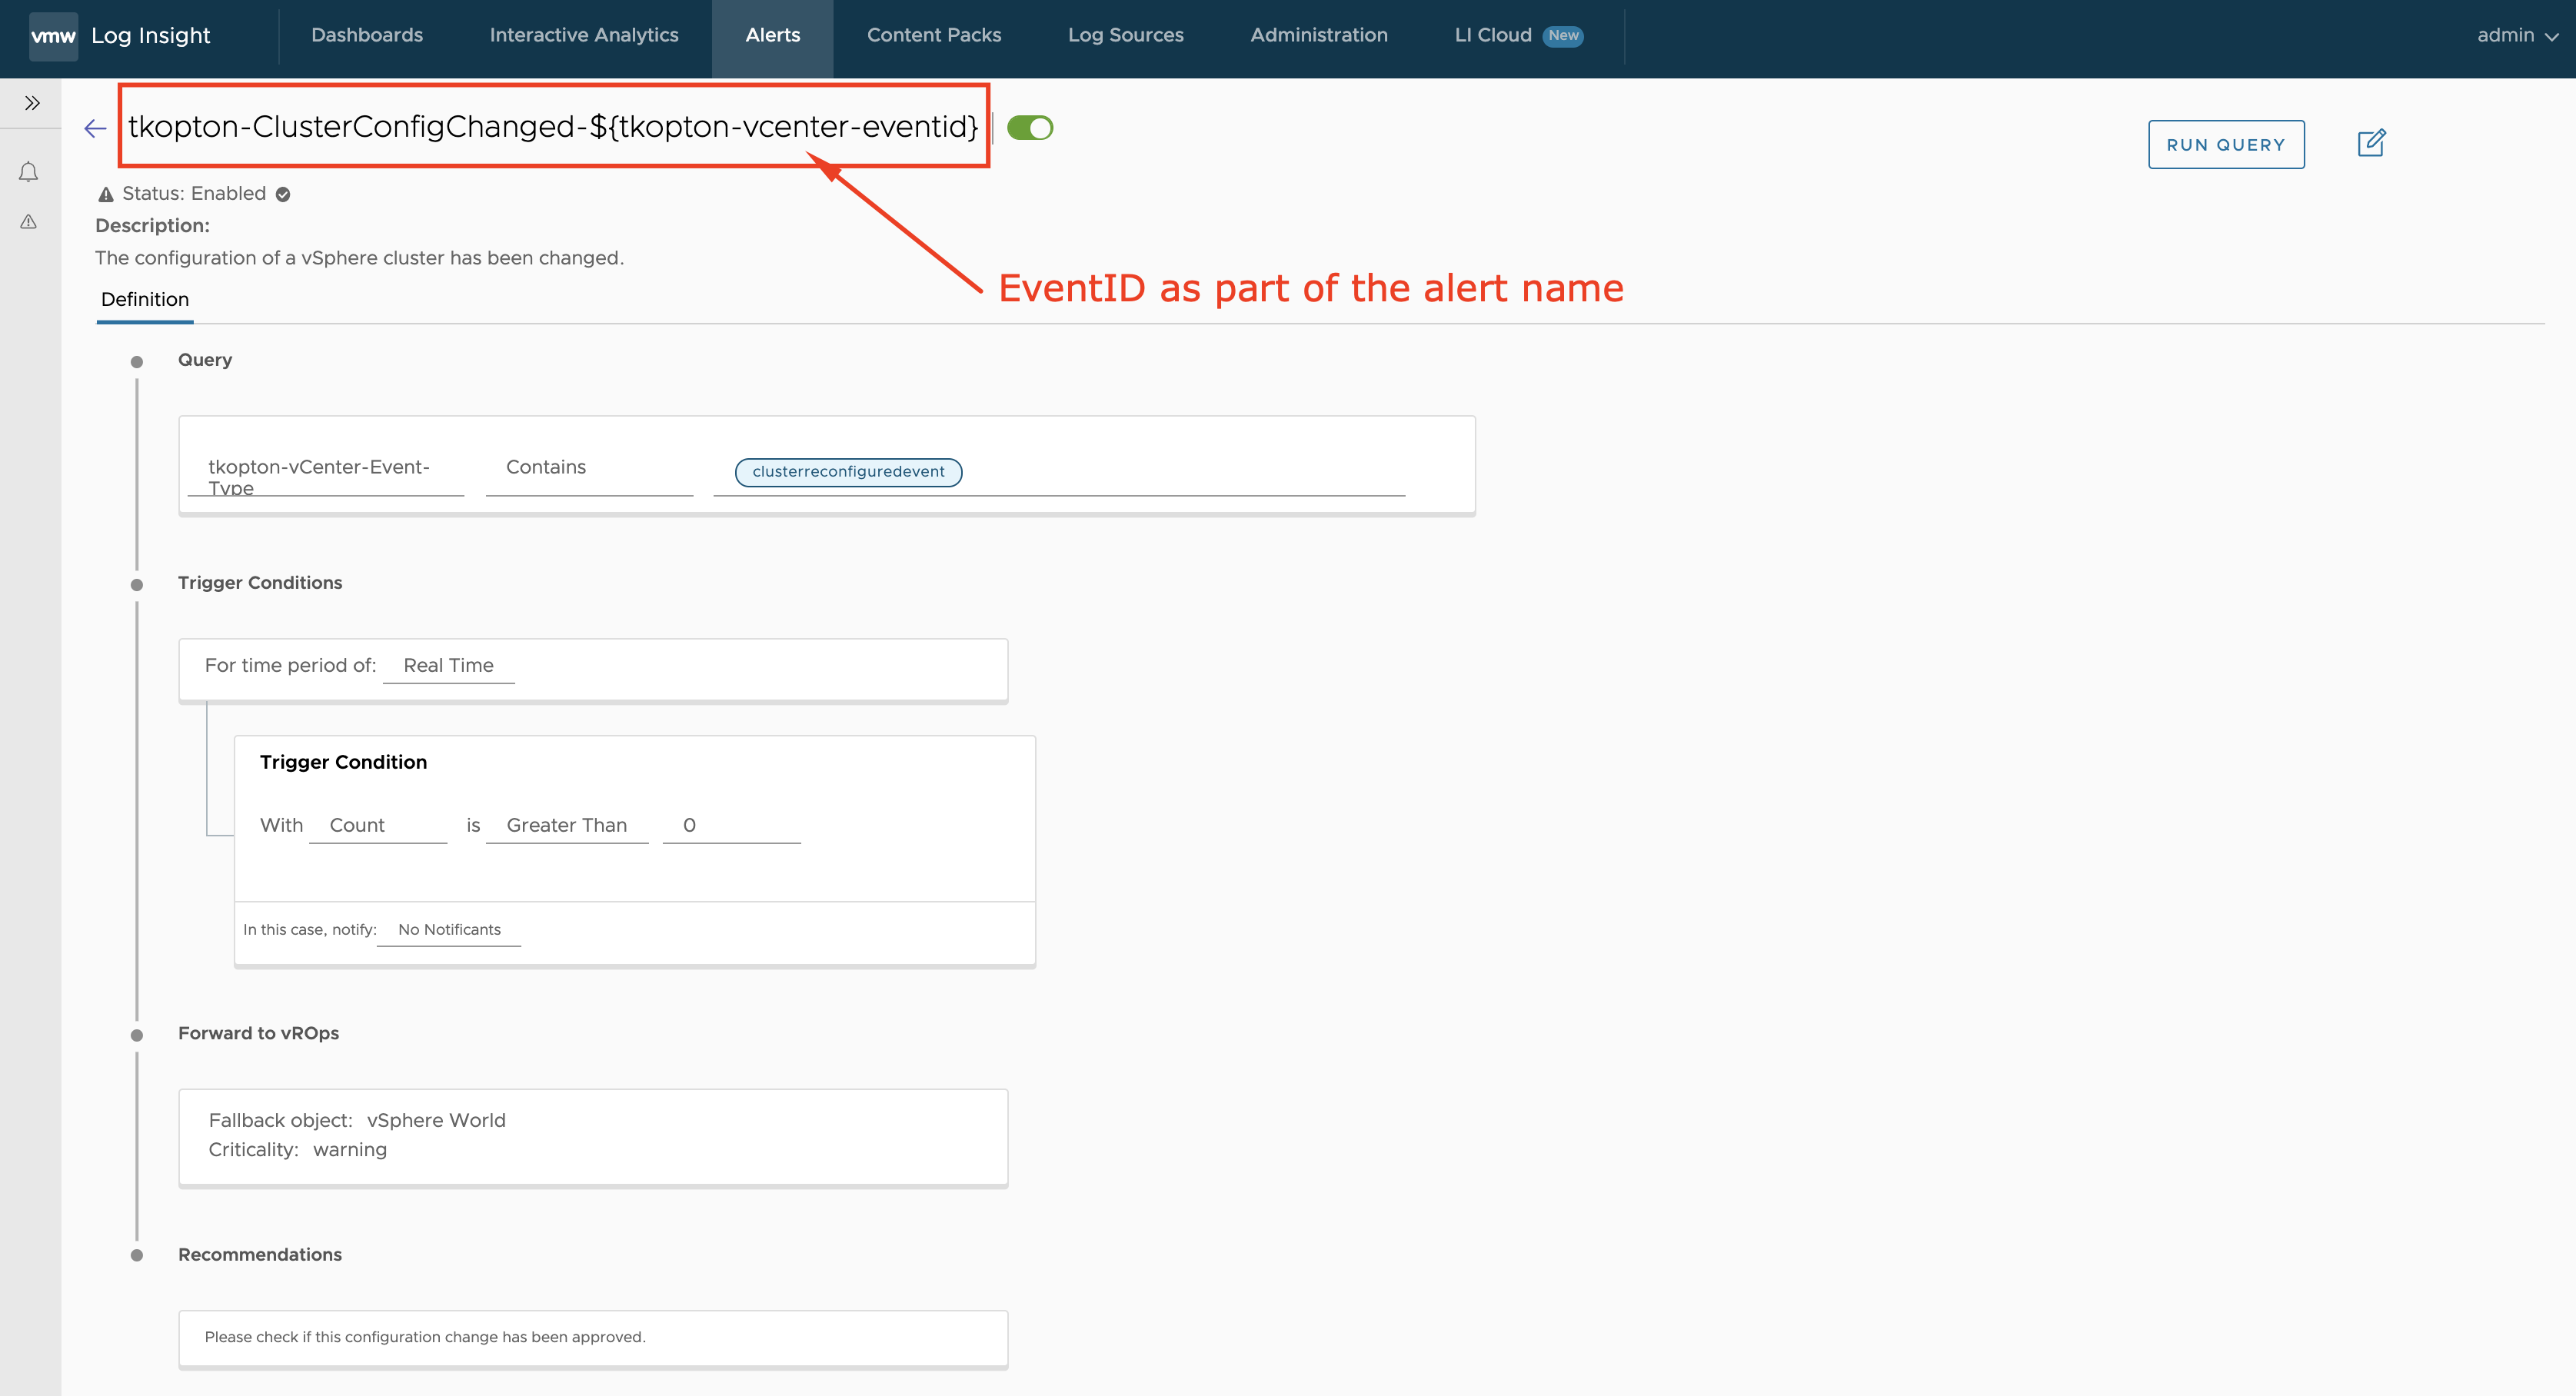
This extracted field can be now used as part of the name in the alert definition, which will make every occurrence unique in vROps. In the next picture, you can see the modified alert definition in vRLI.
Figure 10: Final alert definition in vRealize Log Insight.
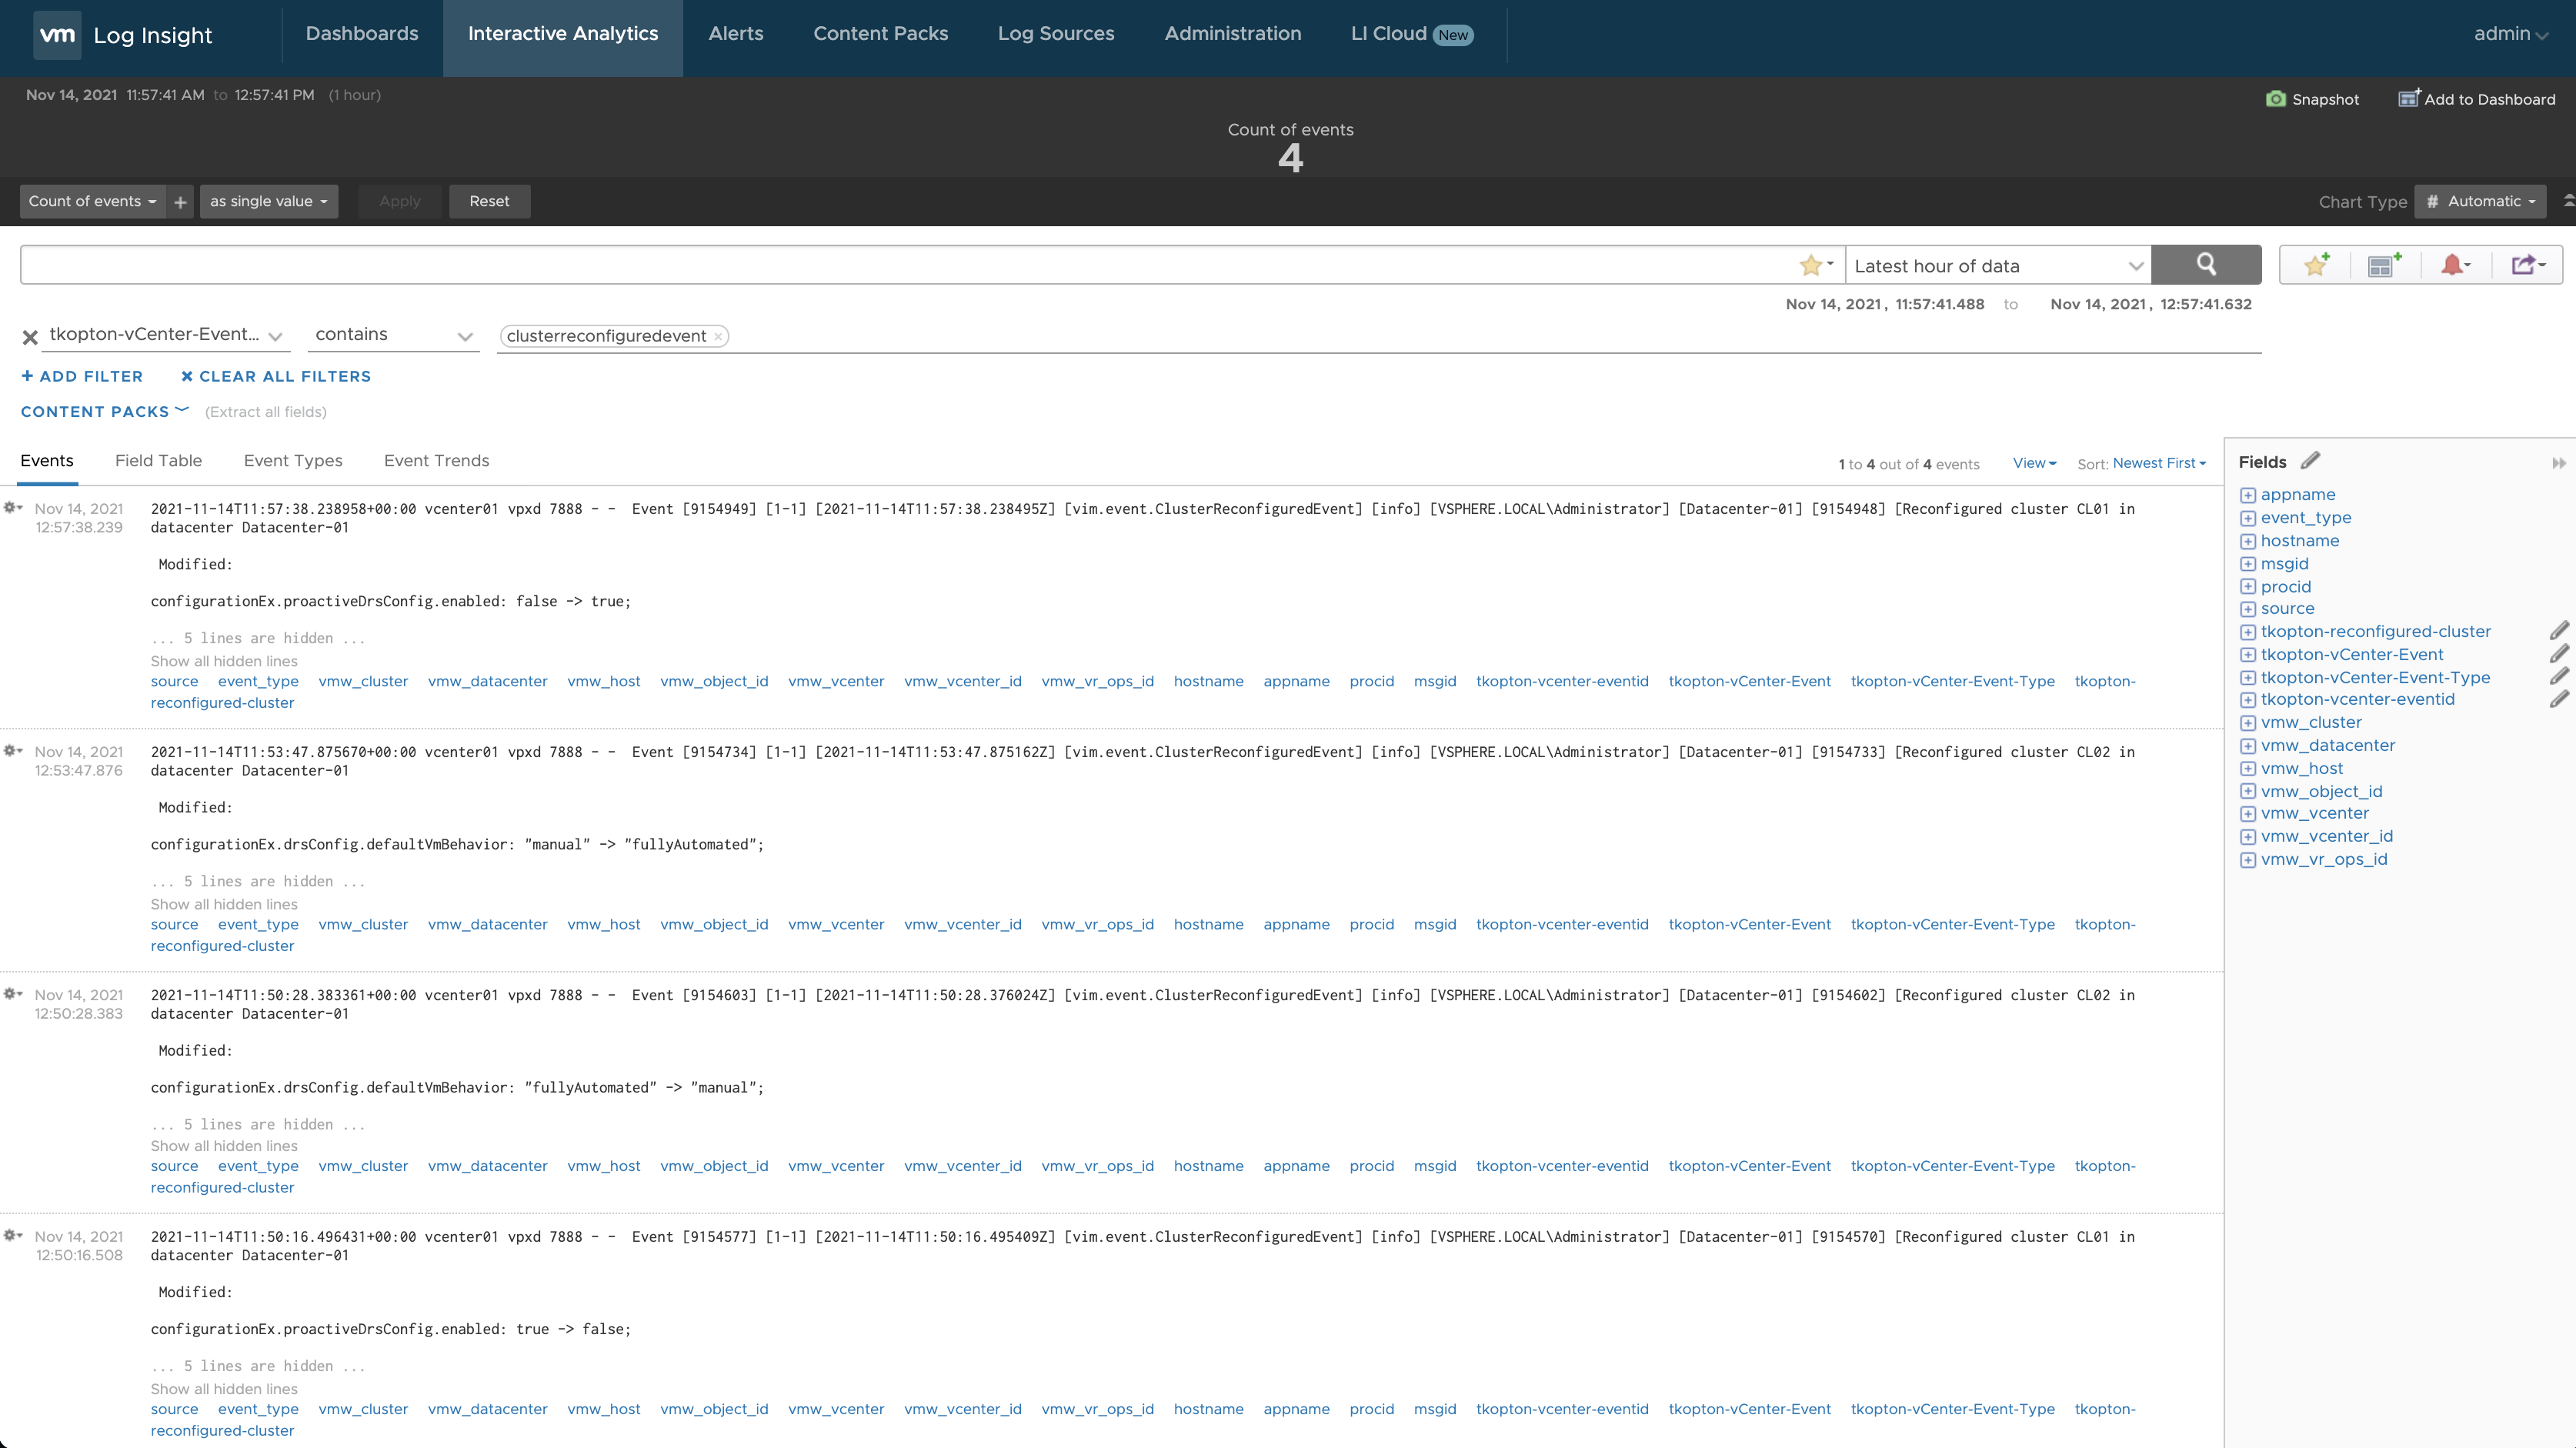
Let’s do some vSphere cluster reconfigurations.
Figure 11: New event messages triggering alarms in vRLI.
And this is how it looks like in vROps after vRLI forwarded these alarms to vRealize Operations. First, we check the symptoms, see the next picture.
Figure 12: Notification event symptoms in vRealize Operations.
And here we see the corresponding alarms in vROps.
Figure 13: New alarms in vRealize Operations.
With these alarms, you could now create vROps notifications, start webhook triggered actions, parse the content and automate the remediation. Yes, especially around the alert name in vRLI using the extracted field we still have some room for improvement but the approach described here is sufficient for many use cases I have worked with.
It all started with my last electricity bill. Shortly after I have recovered from the shock and made sure that I really do not have any aluminum smelter running in my basement, I decided, I need some kind of monitoring of my electric energy consumption.
Insights into data is the first and probably most important step in the process of taking measures to change any given situation.
My plan was to consume the available Smart Messaging Language (SML) data and following that post (sorry, it is in German only) create a real-time dashboard:
No sooner said than done and only after few steps I have realized that it will be slightly more work to let the included webserver run on the same Raspberry PI which is already running my PI-hole??.
OK, invest time to change the scripts and build the dashboard into the PI-hole web server or use another Raspberry and start over?
As I already have the data available in the vzlogger.log file why shouldn’t I use my vRealize Loginsight to display it? Sure, semantically I am dealing with time-series data here and another vRealize product would be more suitable but I wanted something quick and easy – no worries, vRealize Operations and/or Wavefront integration is already on my to-do list.
The Data
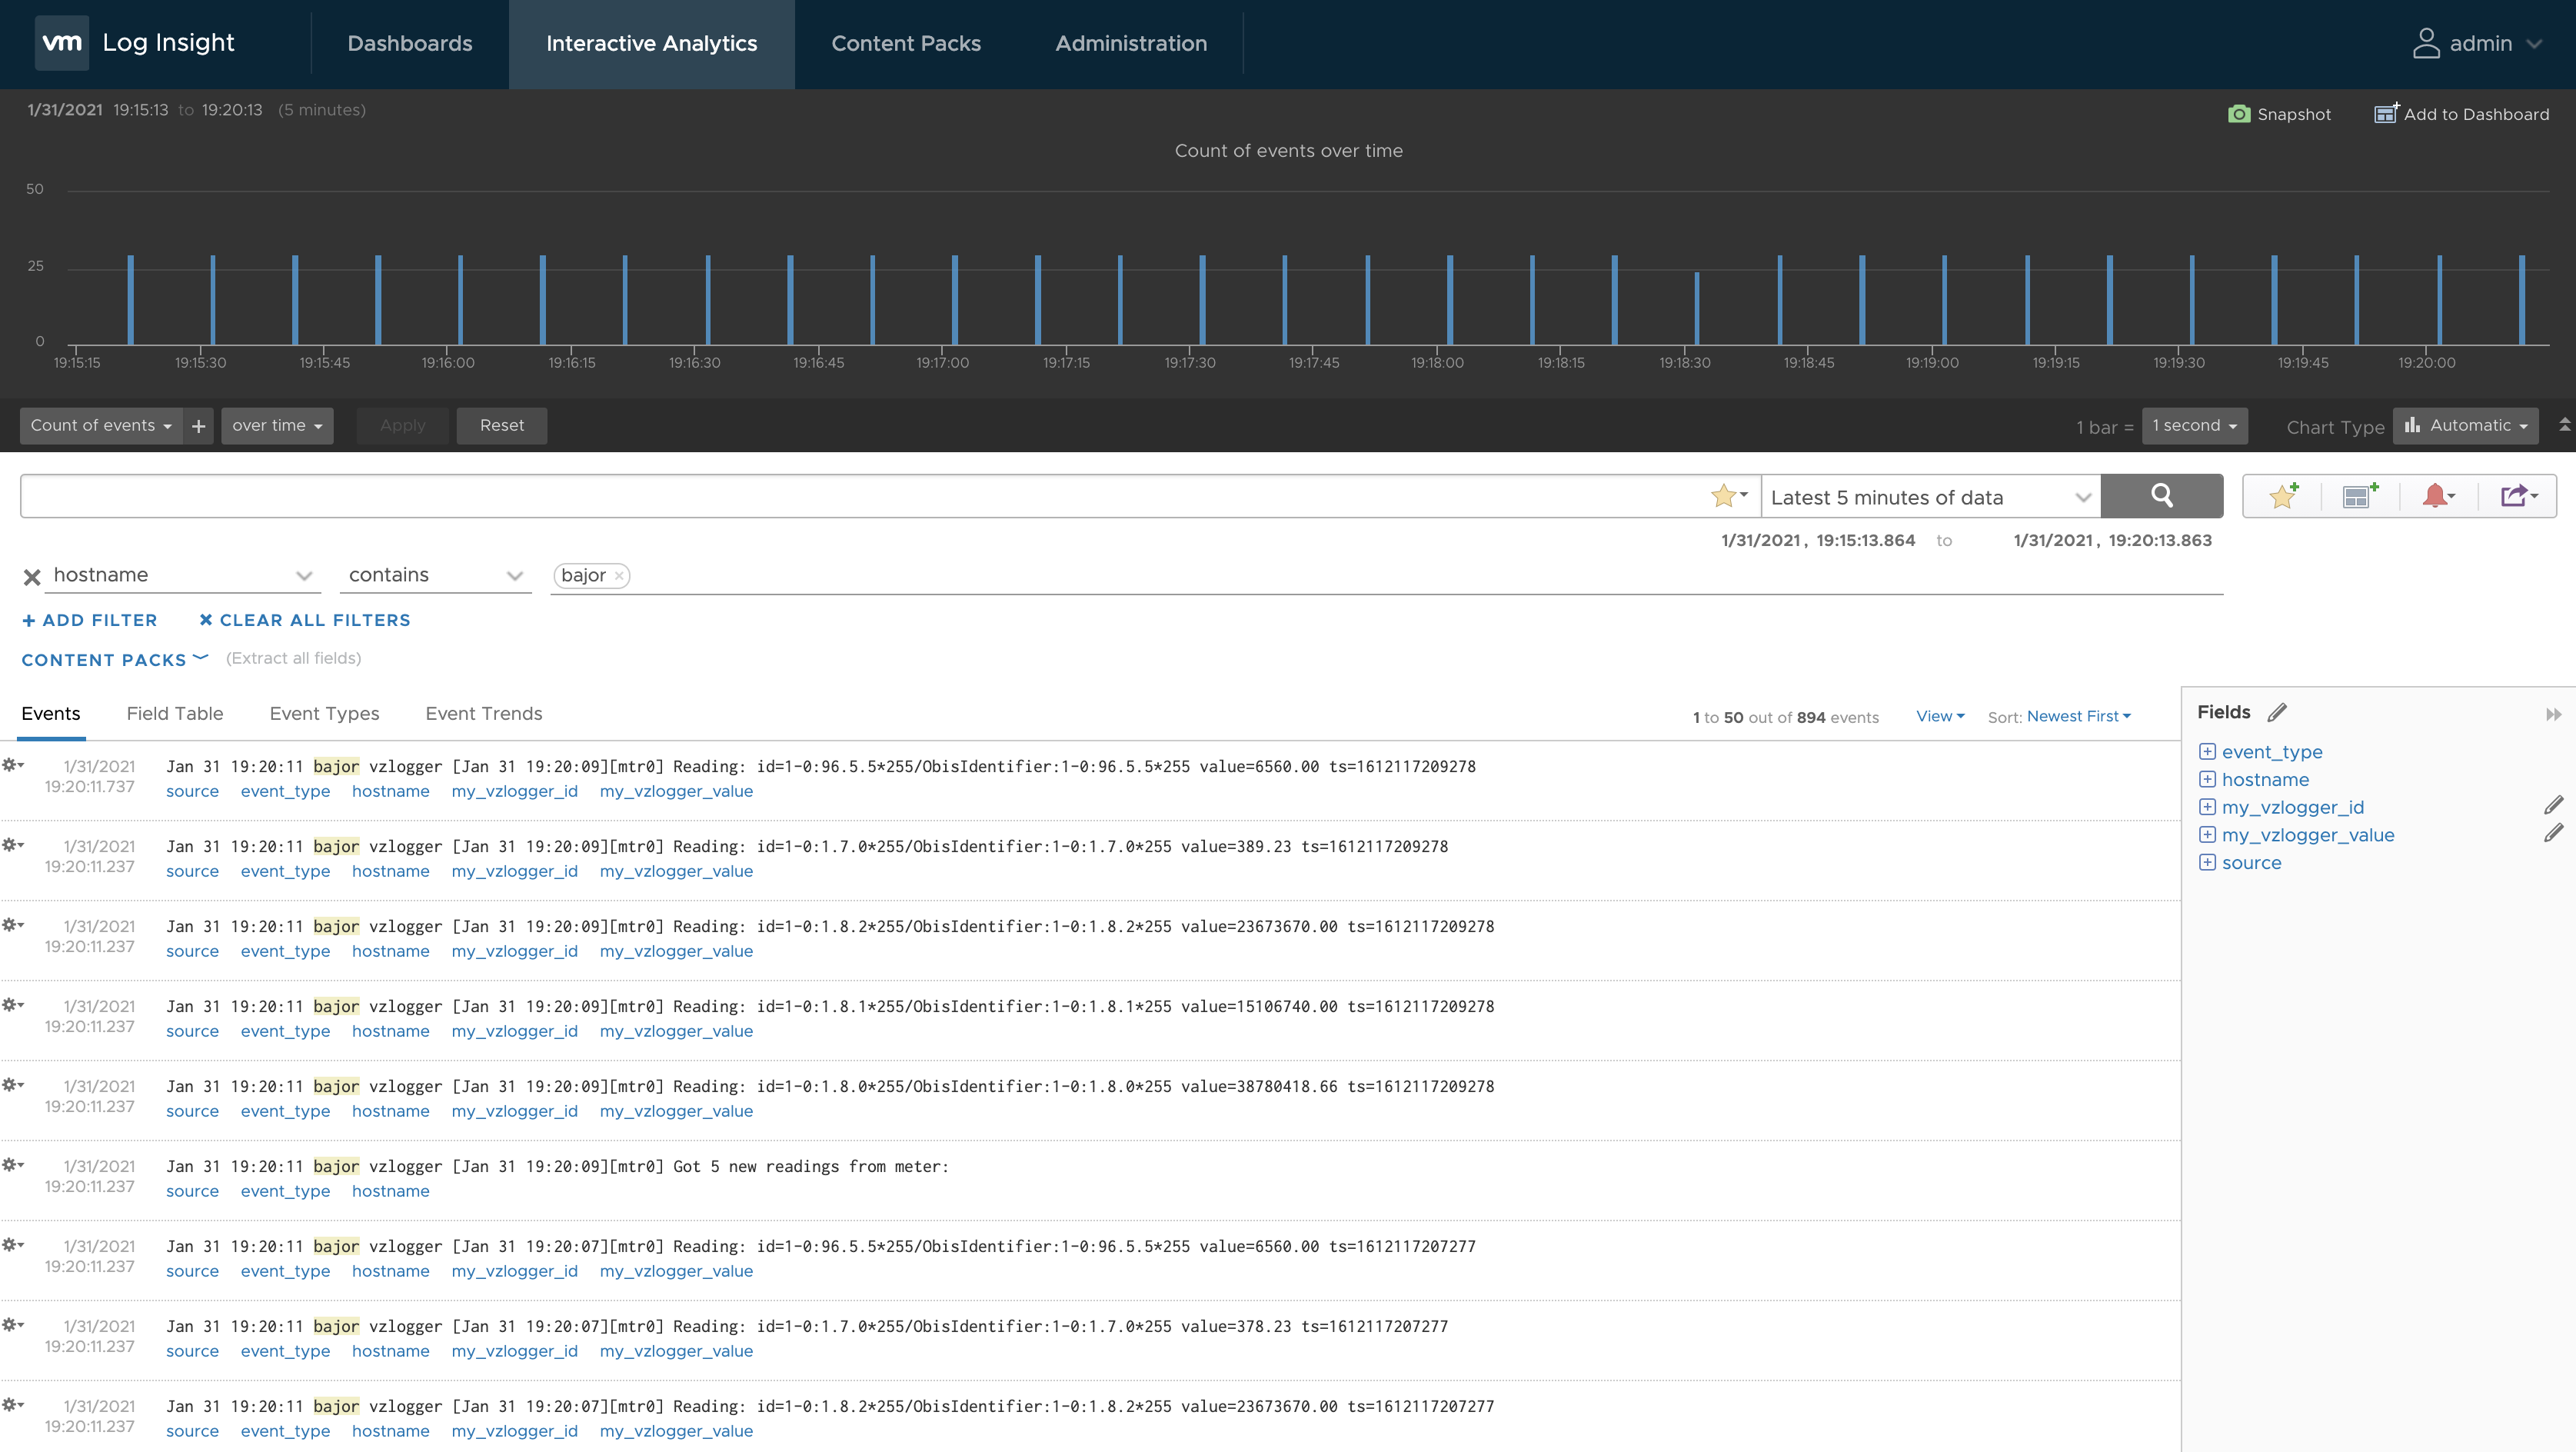
vzlogger (https://github.com/volkszaehler/vzlogger) reads the SML telegrams coming from the smart meter via serial port and stores the readings every two seconds in a log file. I have configured the log file to be: /var/log/vzlogger/vzlogger.log
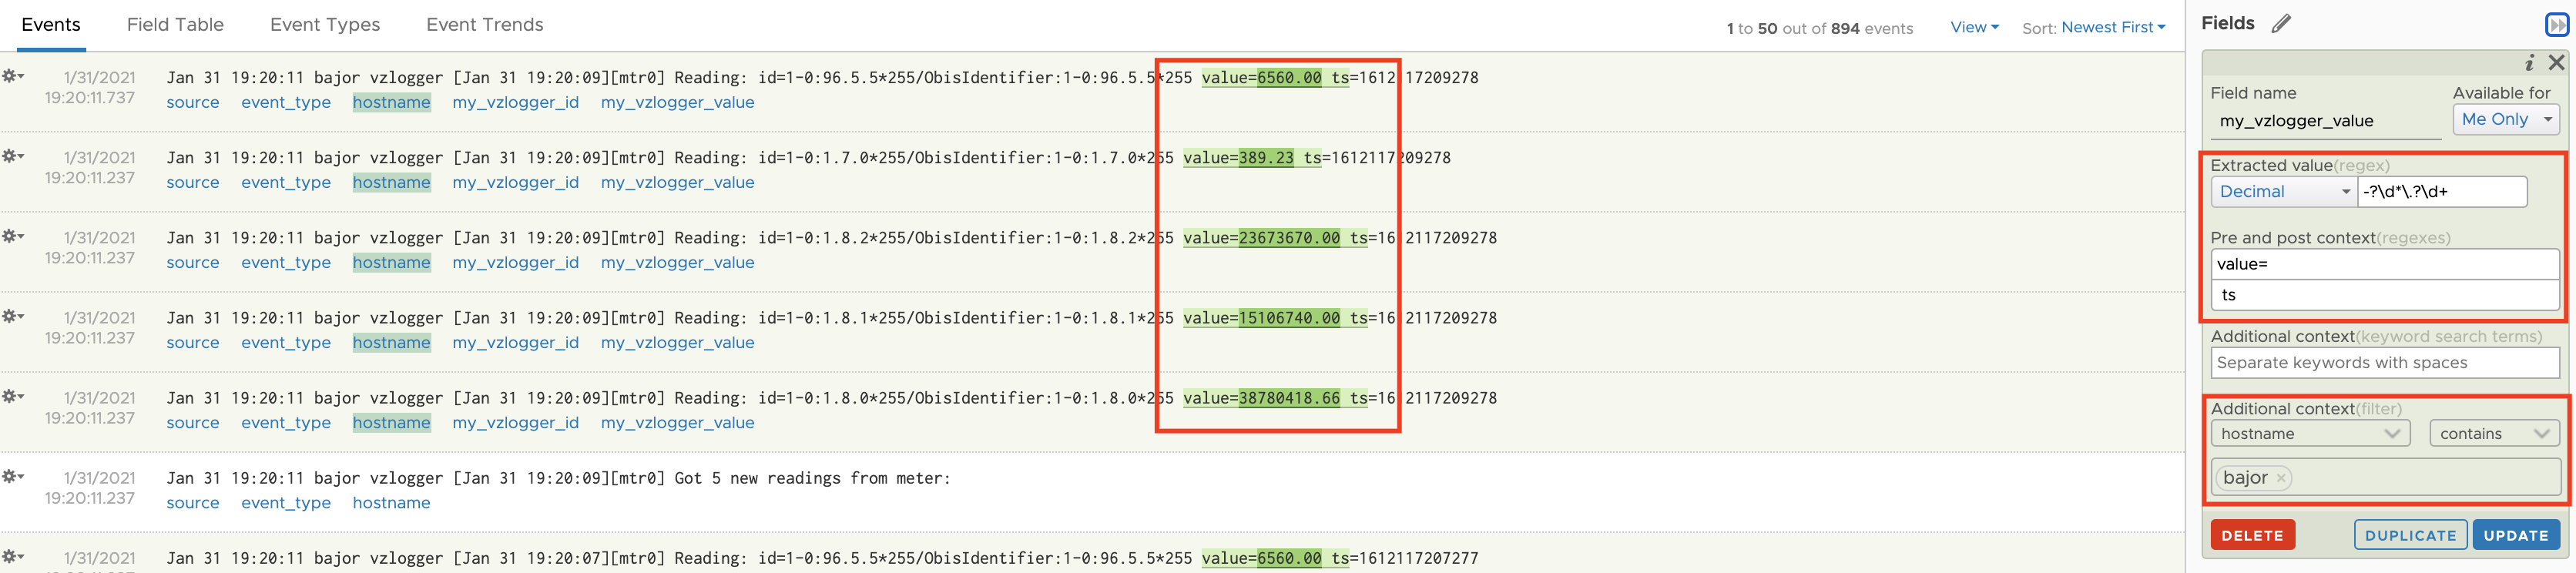
To make the extraction of the value efficient, I am using the hostname of the data source as additional context. Additional context ensures that vRLI does not have to parse every single log message arriving in vRLI. Only messages coming from my Raspberry PI will be parsed.
Figure 02: Extracted Field used to assign the actual metric, consumption, to a searchable field
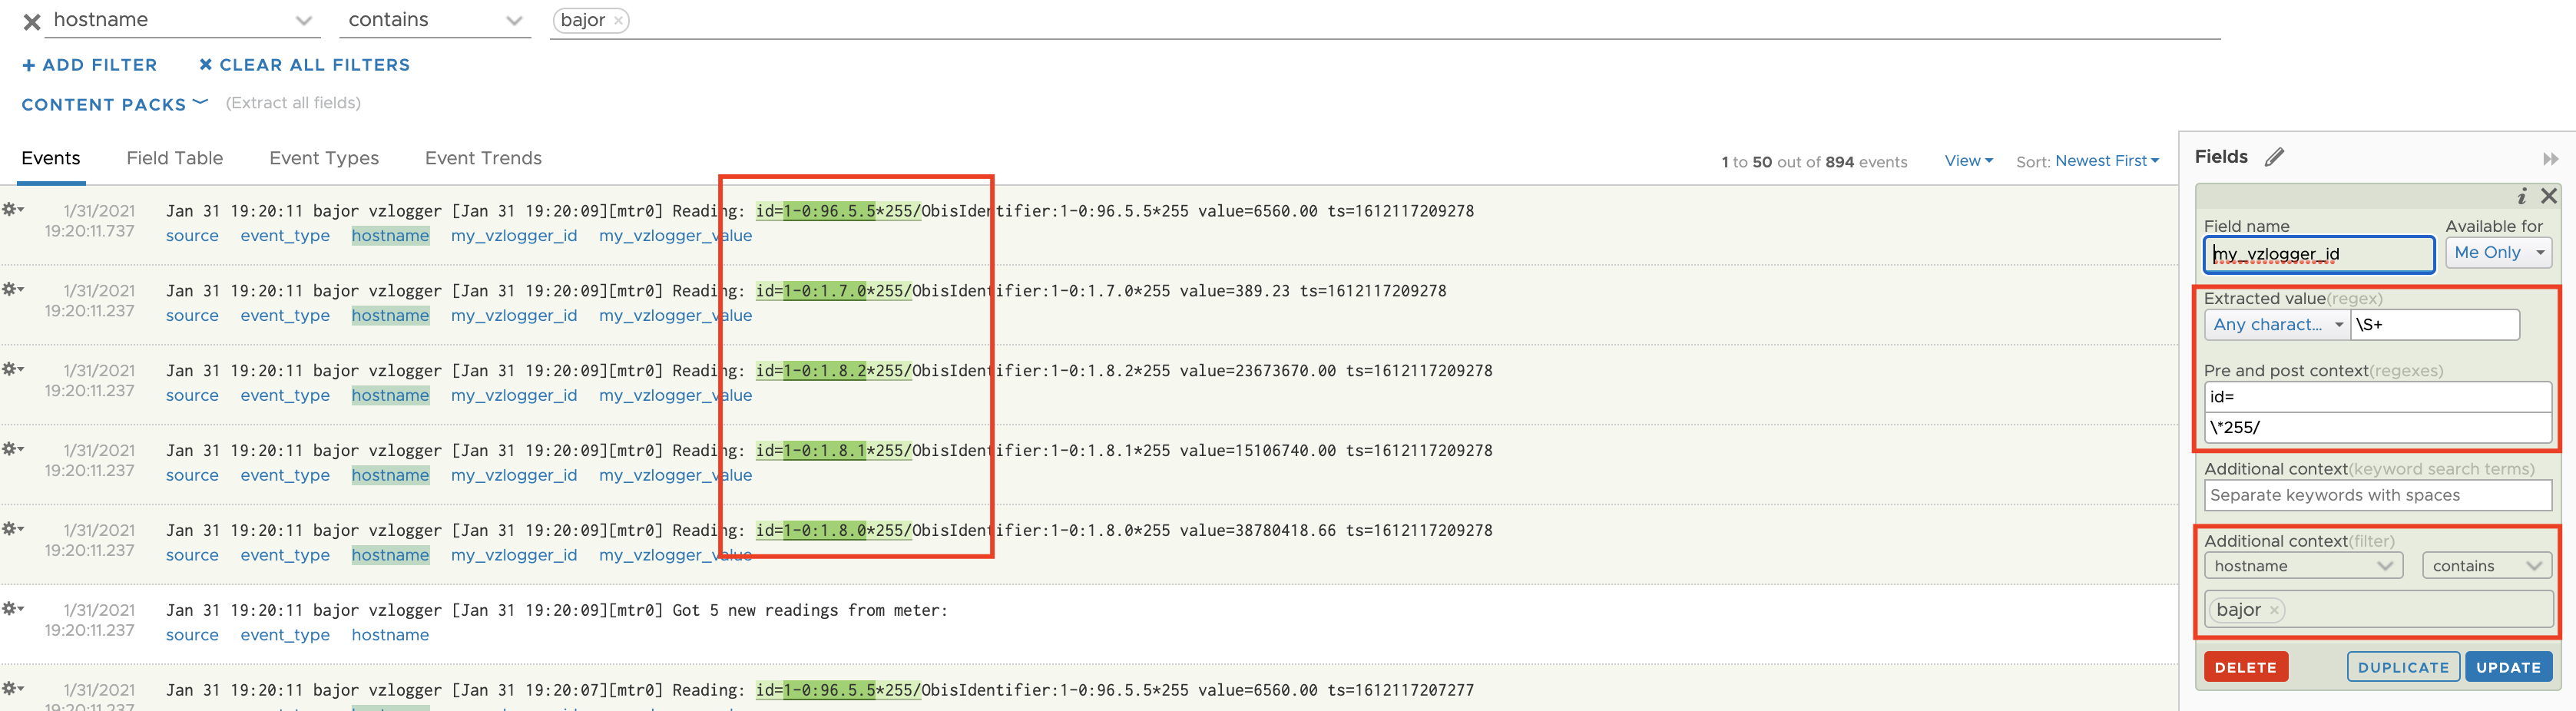
Additionally I extract the OBIS key to use both, key and value to create my dashboards.
Figure 03: OBIS key as Extracted Field
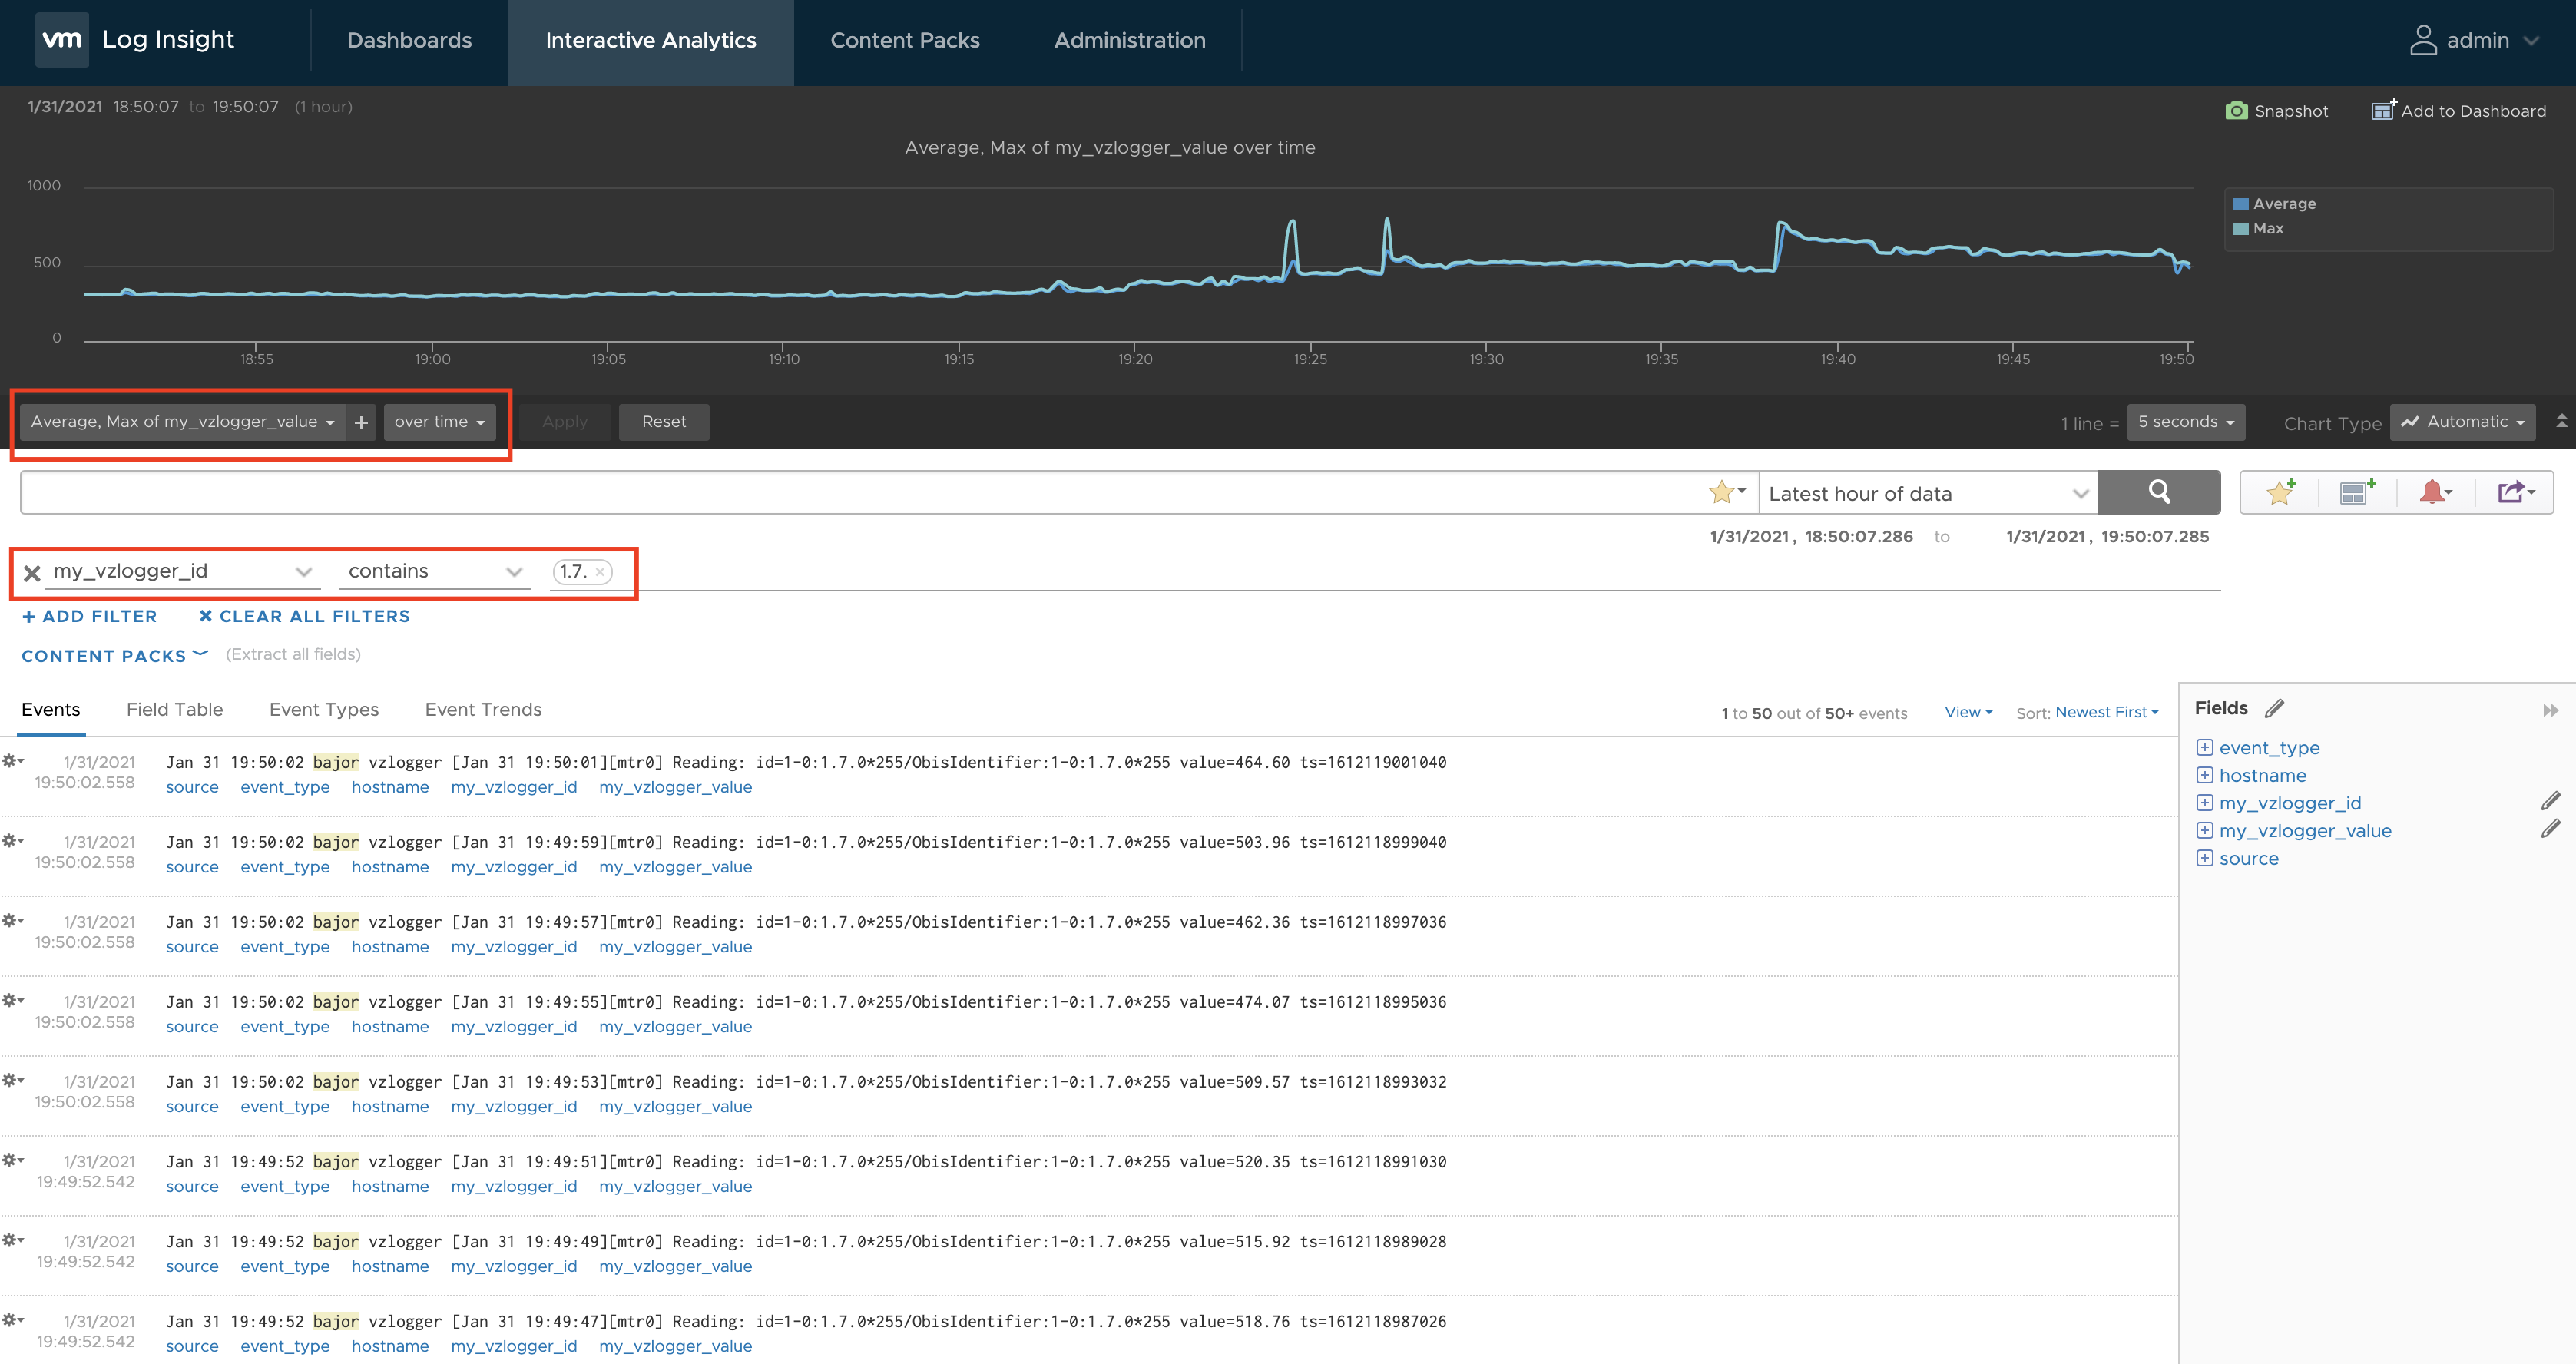
Now it is easy to show the actual consumption using both extracted fields.
Figure 04: Current consumption as max and average
vRealize Log Insight Dashboard (Sharing)
Information made visible in the vRealize Log Insight Interactive Analytics can be added to a dashboard and shared with other users.
Figure 05: Creating a shared dashboard
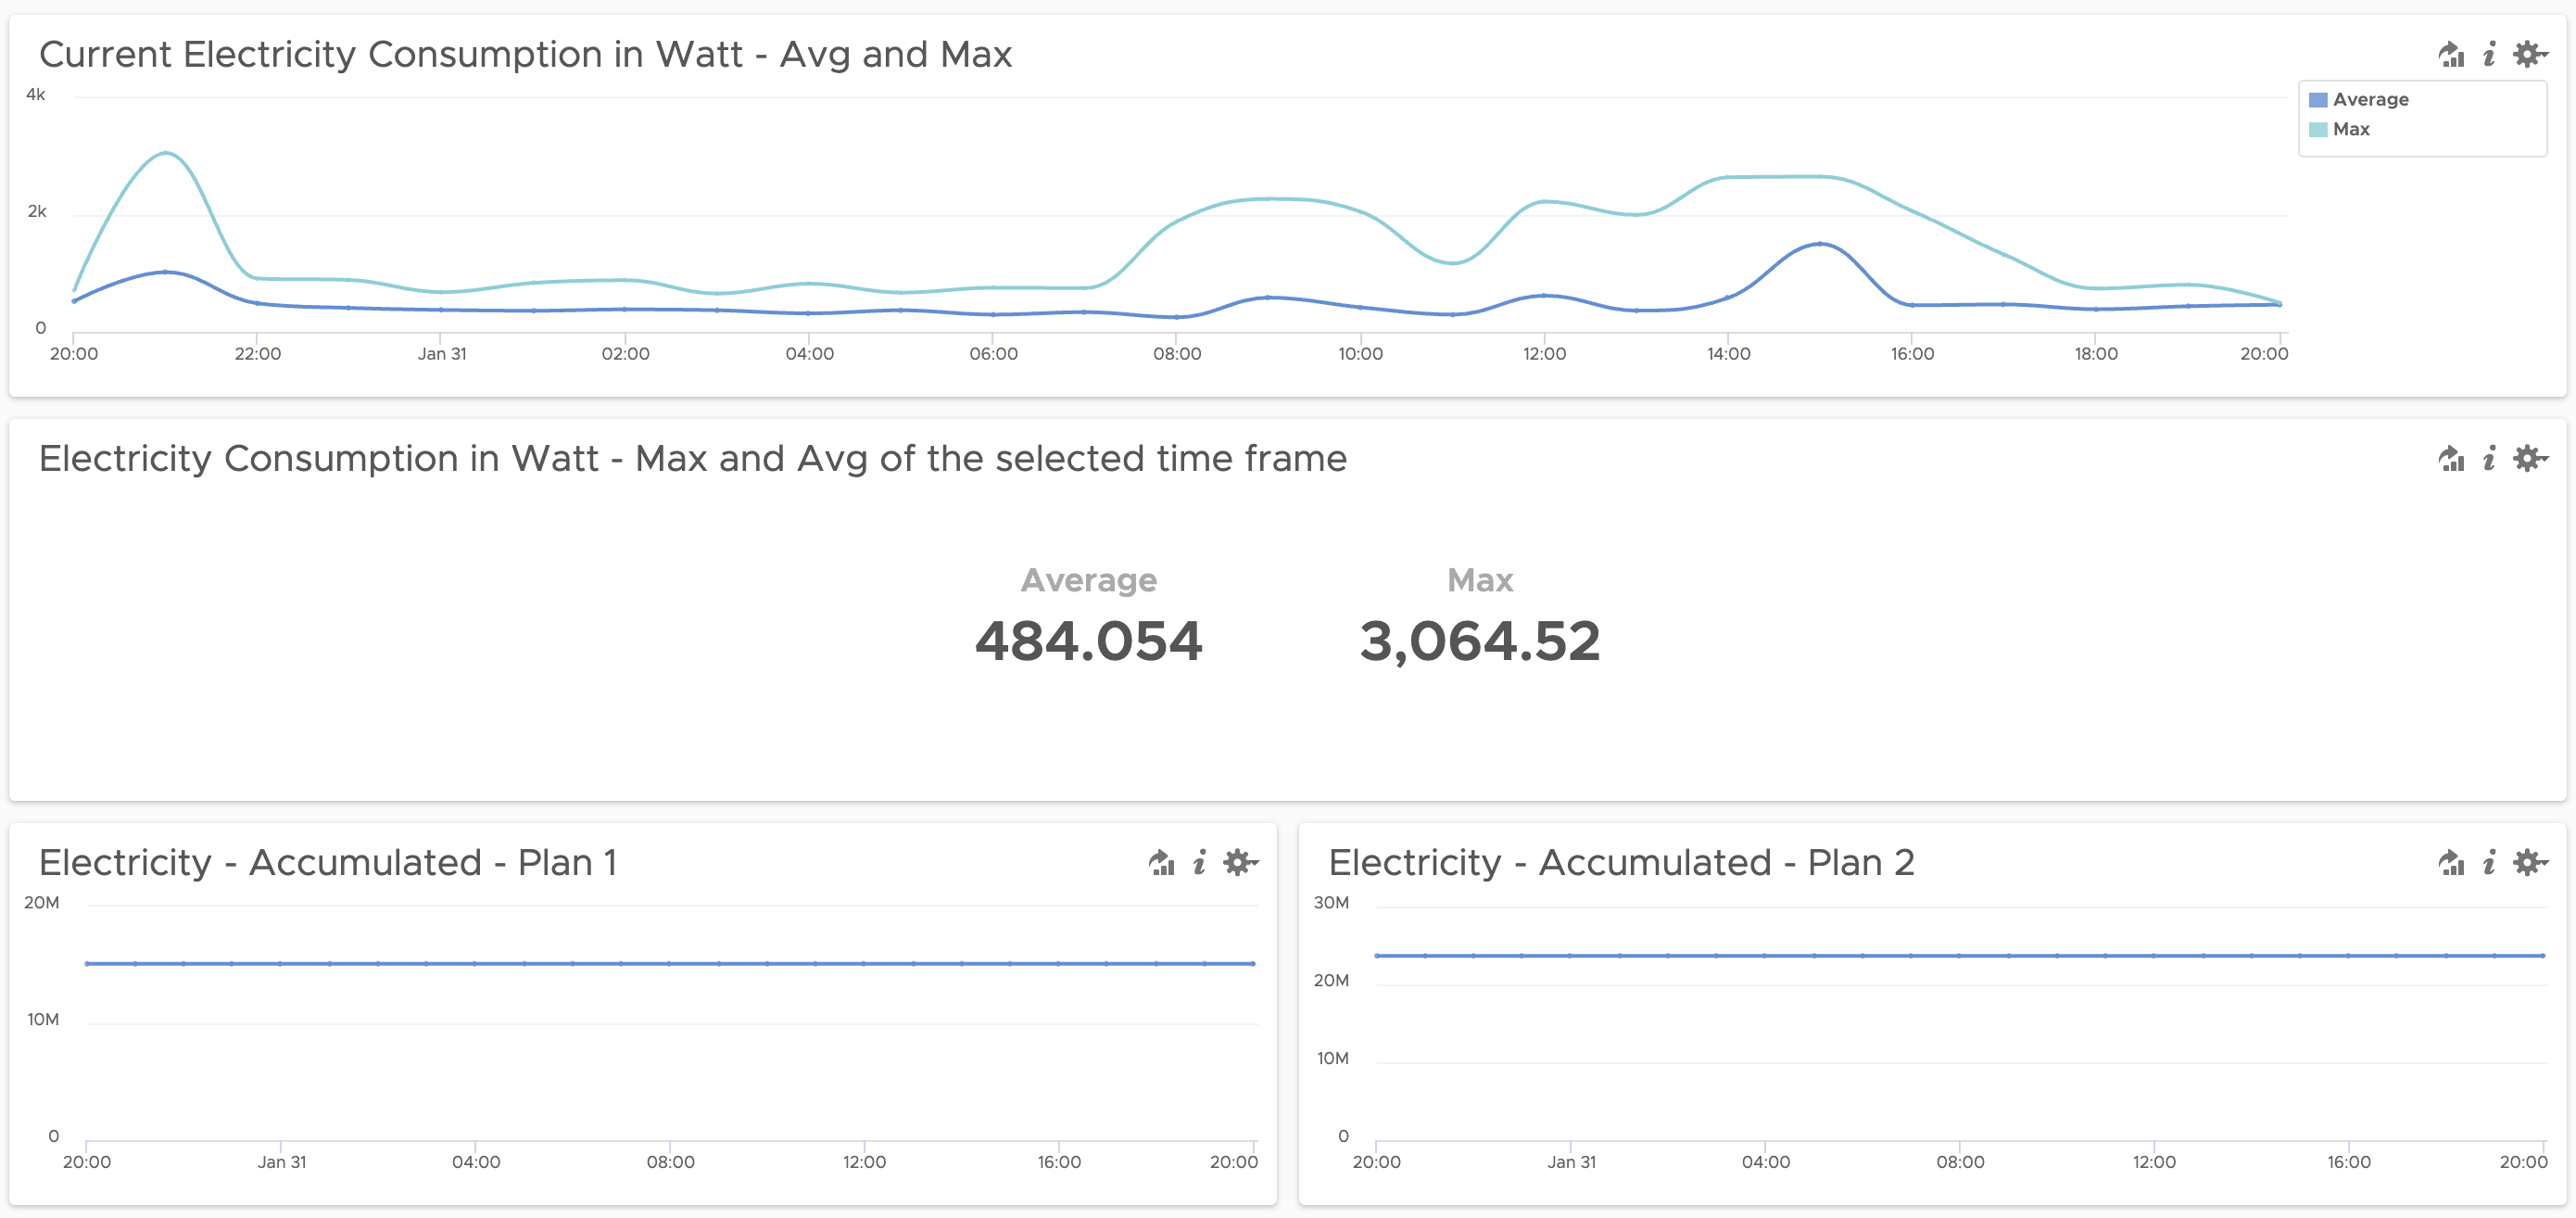
The dashboard can have multiplewidgets and give you a quick insight into the collected data.
Figure 06: Electric energy consumption dashboard
vRealize Log Insight Partition
Another fairly new (since 8.1) feature of vRealize Log Insight I have used in this example is Data Partitions.
You can retain log data in a partition with a filter and a retention period. Data partitions let you define different retention periods for different types of logs. For example, logs with sensitive information might require a short retention period, such as five days. The log data that matches the filter criteria for a data partition is stored in the partition for the specified retention period. Logs that do not match the filter criteria in any of the defined data partitions are stored in the default partition. This partition is always enabled and stores data for an unlimited amount of time. You can modify the retention period for the default partition.
I have created a partition for the energy data to retain that data for 90 days. My host bajor is sending only the vzlogger messages so I can use the hostname as filter.
Figure 07: Data partition for the energy consumption data
Outlook
As the next project, I am planning to send the metrics to vRealize Operations or Wavefront to treat them as time-series data and allow for more sophisticated analytics.
Without any doubt configuring vRealize Operations to send log messages to a vRealize Log Insightinstance is the best way to collect, parse and display structured and structured log information.
In this post I will explain the major differences between CFAPI and Syslog as the protocol used to forward log messages to a log server like vRealize Log Insight.
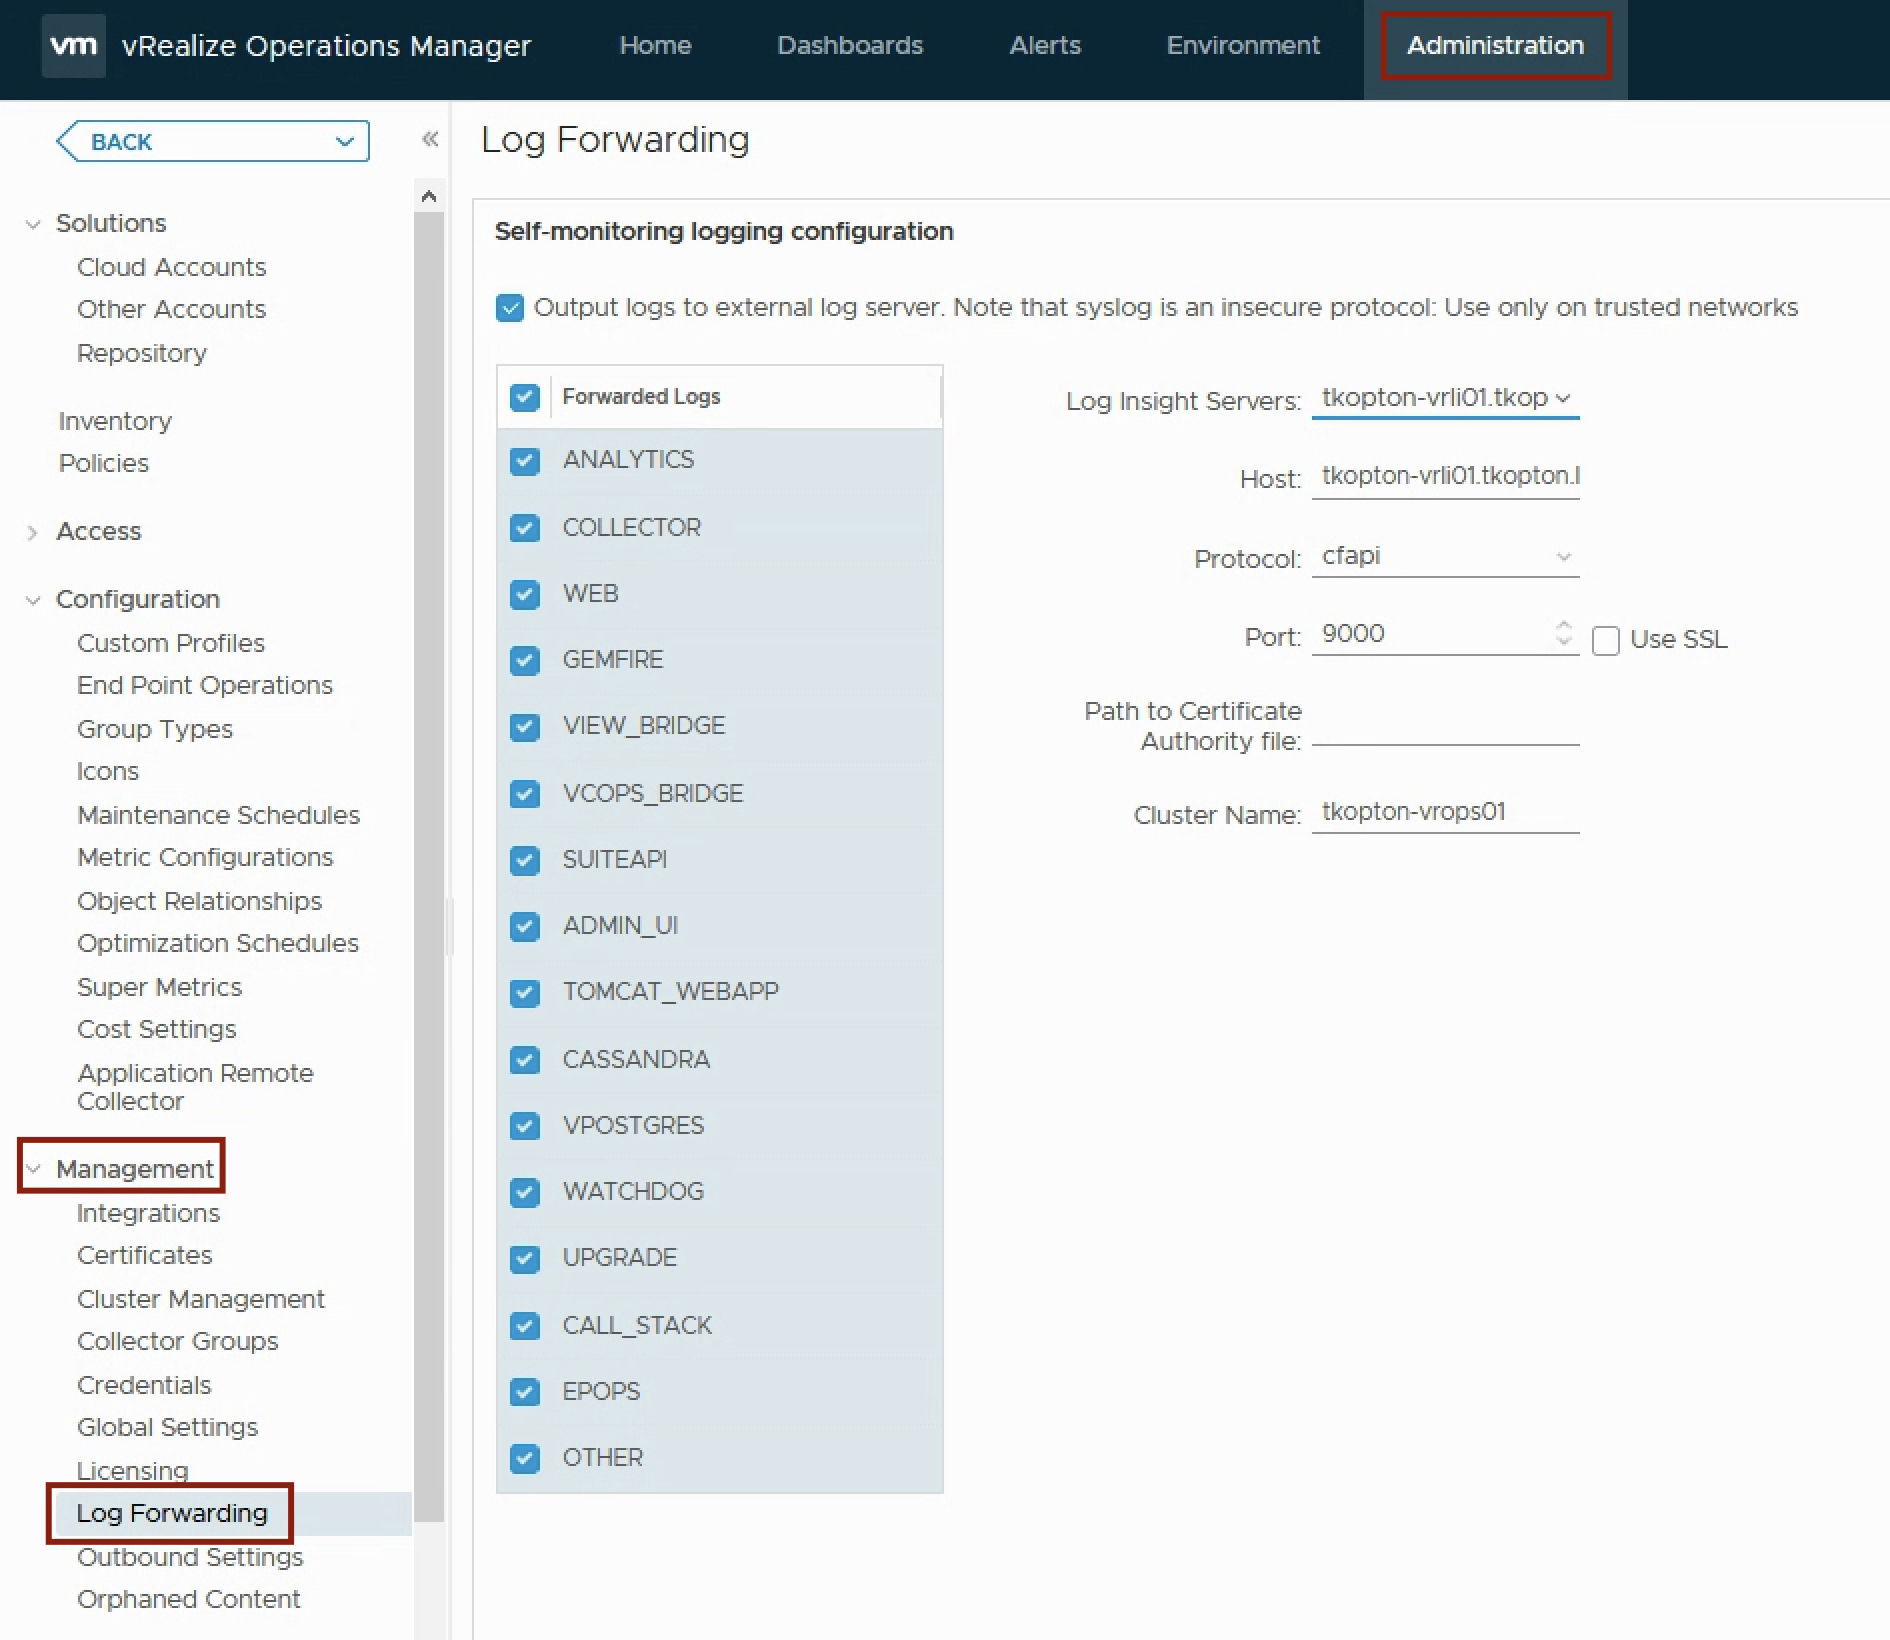
The configuration of the log forwarding in vRealize Operations is straight forward. Under “Administration” –> “Management” –> “Log Forwarding” you will find all options to quickly configure vRLI as target for the selected log files.
The following figure shows how to configure vRealize Operations to send all log messages to vRealize Log Insight using the CFAPI protocol via HTTP.
Figure 1: Log Forwarding configuration
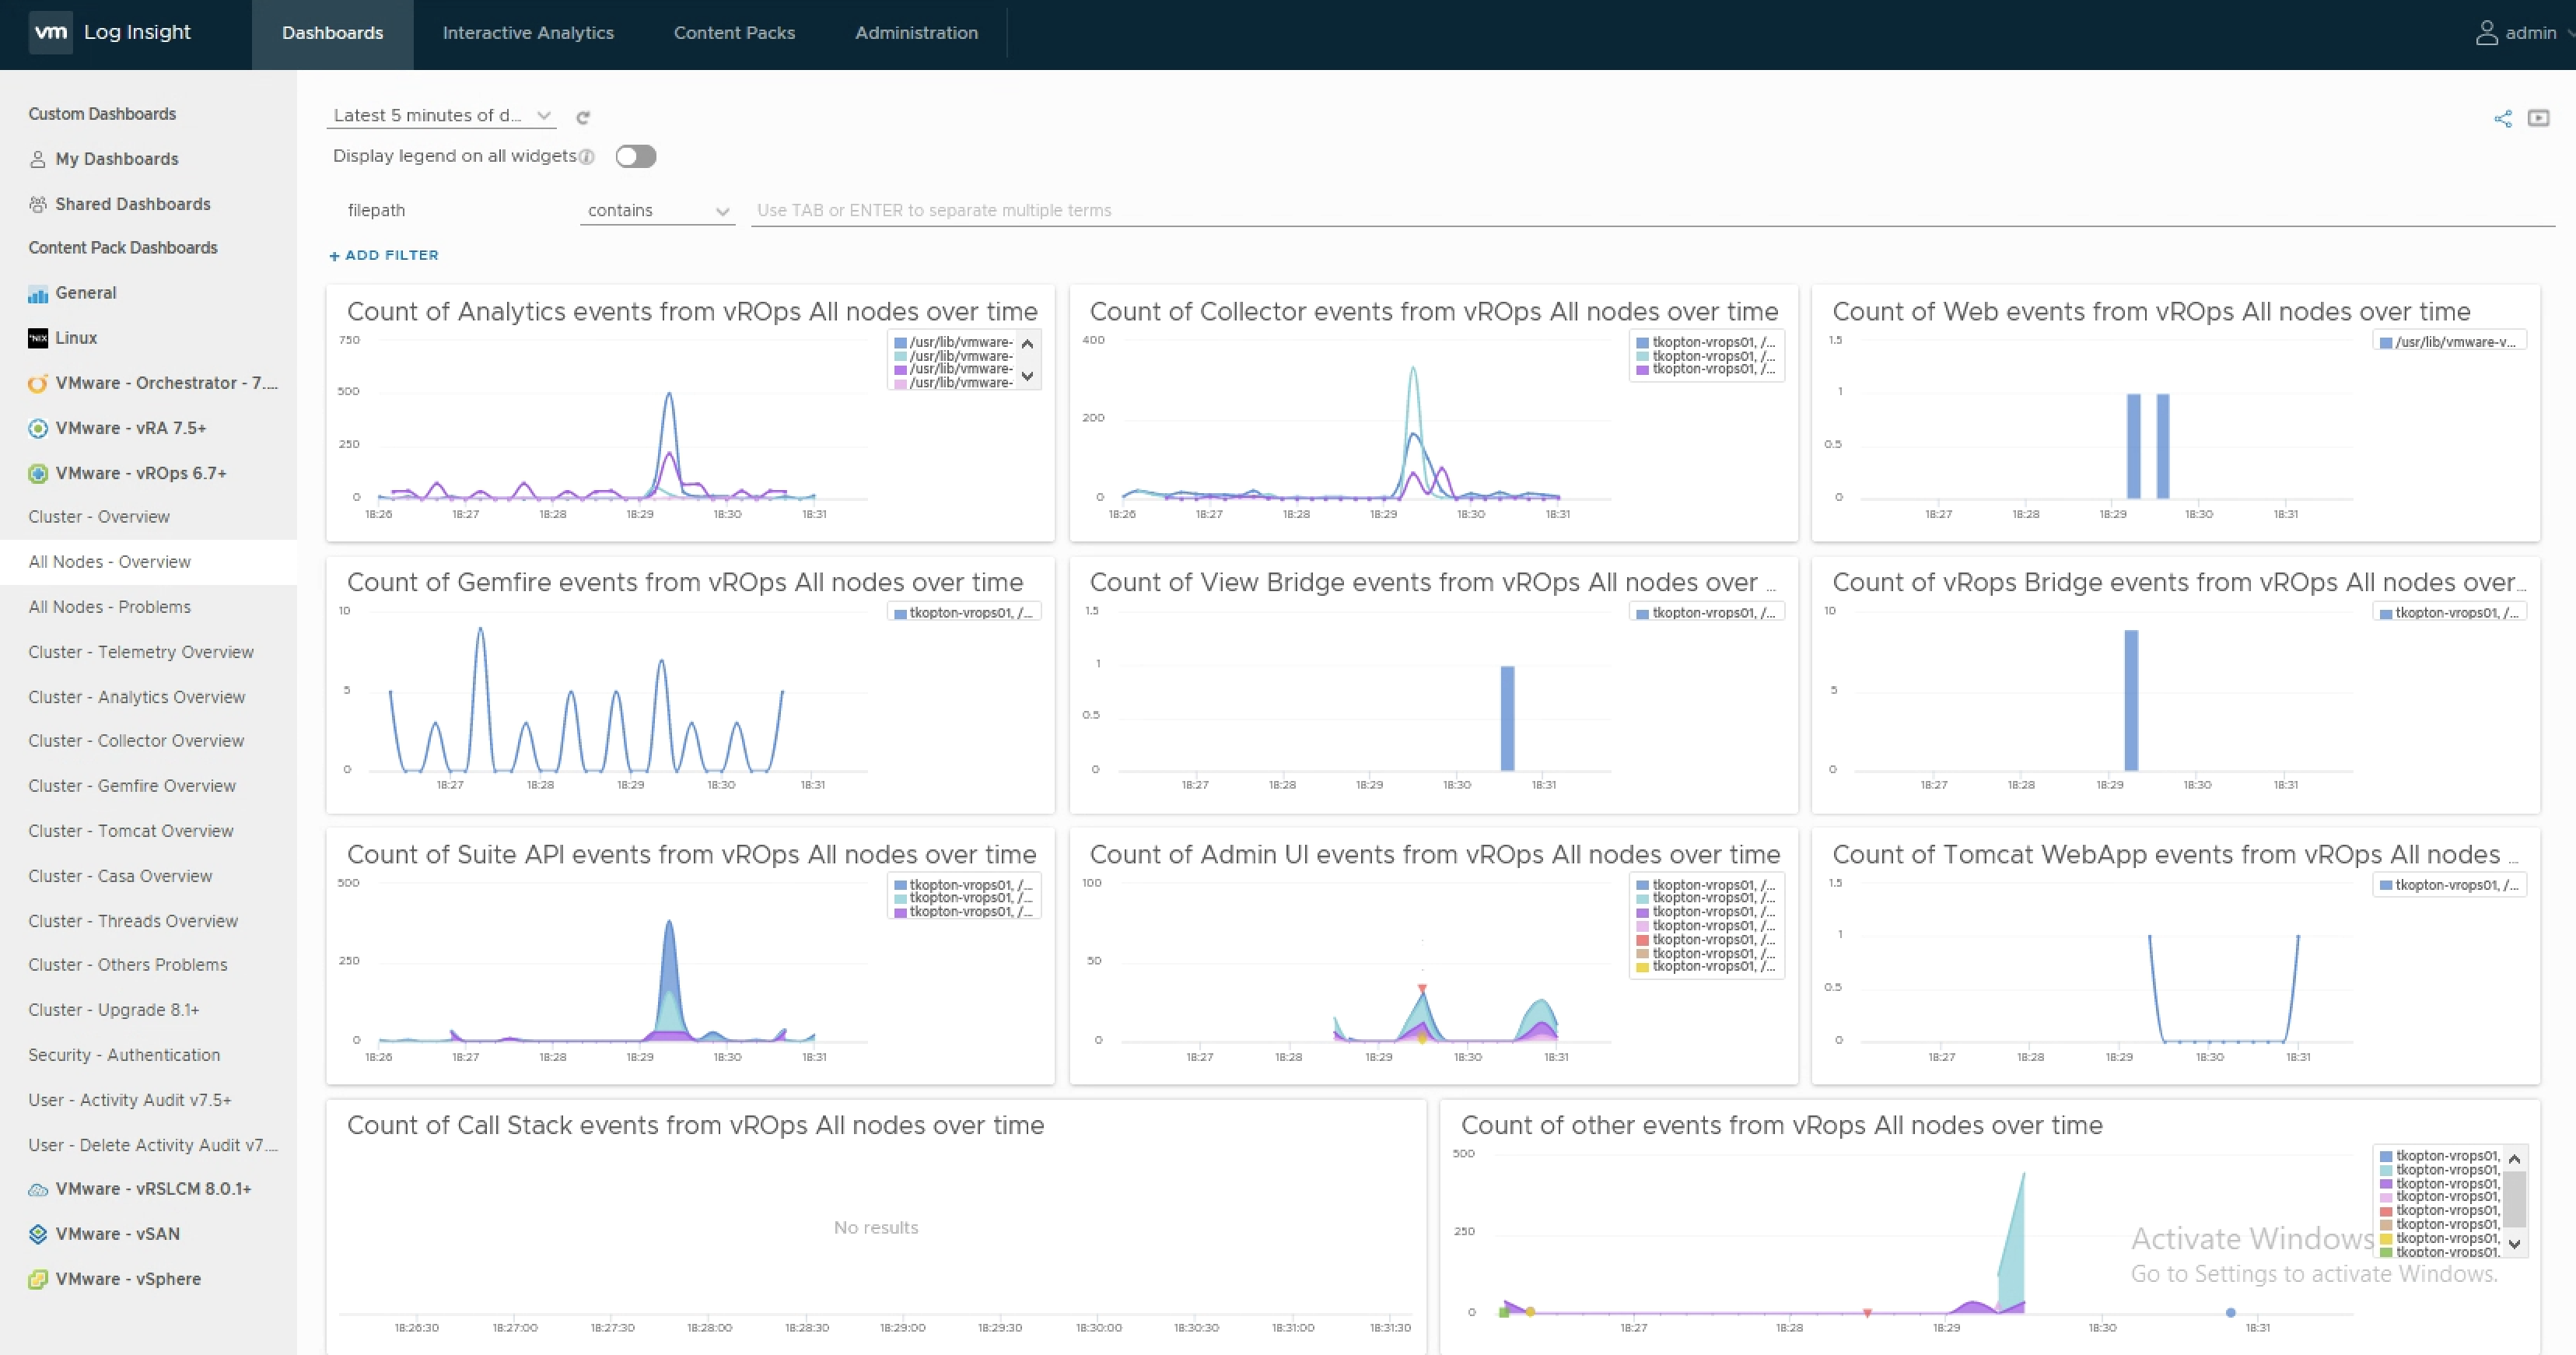
The CFAPI protocol, over HTTP or HTTPS, used by the vRealize Log Insight agent provides additional information used by the vROps Content Pack. The extracted information flows into the various dashboards and alert definitions delivered through the Content Pack. Following picture shows one of the available dashboards populated with available data when using CFAPI and vRLI.
Figure 02: vROps Content Pack
In case you (for whatever strange reason) cannot use CFAPI, you can configure vROps to use Syslog. It is as simple as selecting Syslog as the protocol option in the configuration page shown in the following picture.
Figure 03: Syslog as configured protocol
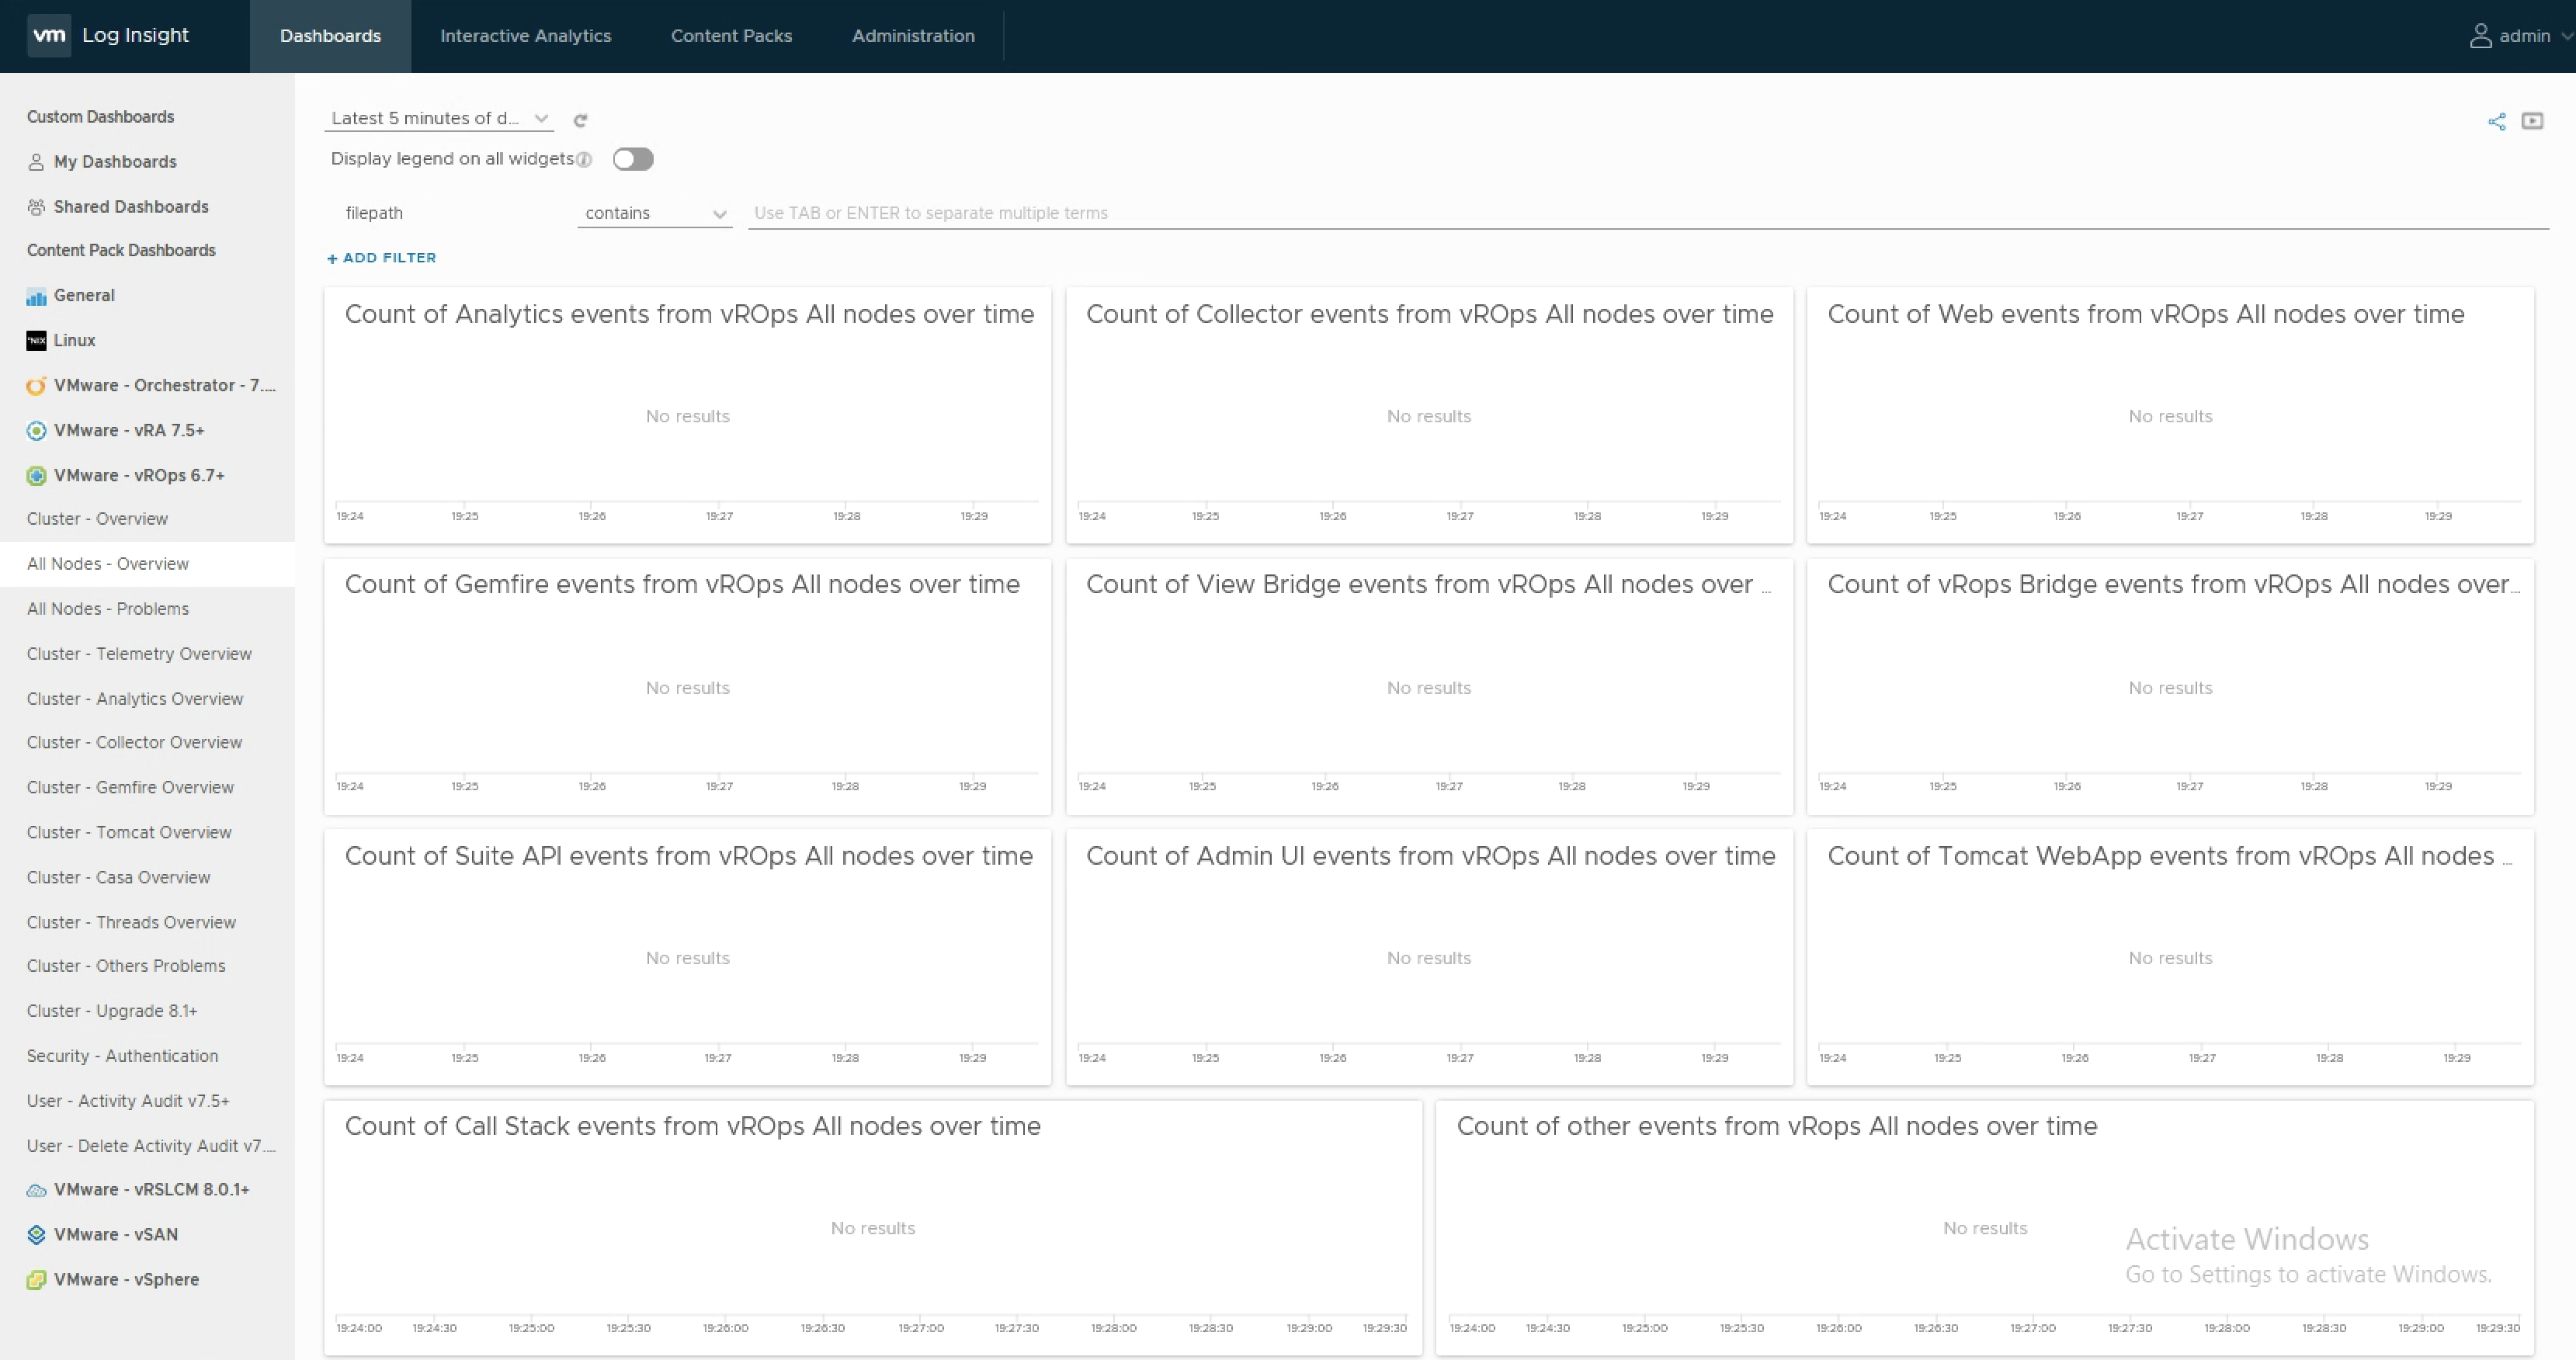
The drawback of using Syslog here is that the additional information parsed by the agent and used by the content pack will no longer be available and you will need to create your own extracted fields in vRLI to parse data from the log messages.
In the next both pictures you can see the empty dashboards and log messages without any vROps specific fields in the interactive analytics .
Figure 04: Empty dashboards when using SyslogFigure 05: Missing vROps specific fields when using Syslog
It is important to know that vROps is using Syslog over TCPwhen configured via UI as shown in figure 03.
But what if you are forced to use Syslog over UDP?
There is no such option in the UI but since vROps is using the regular vRLI agent, there has to be a way to configure it to use UDP instead of TCP.
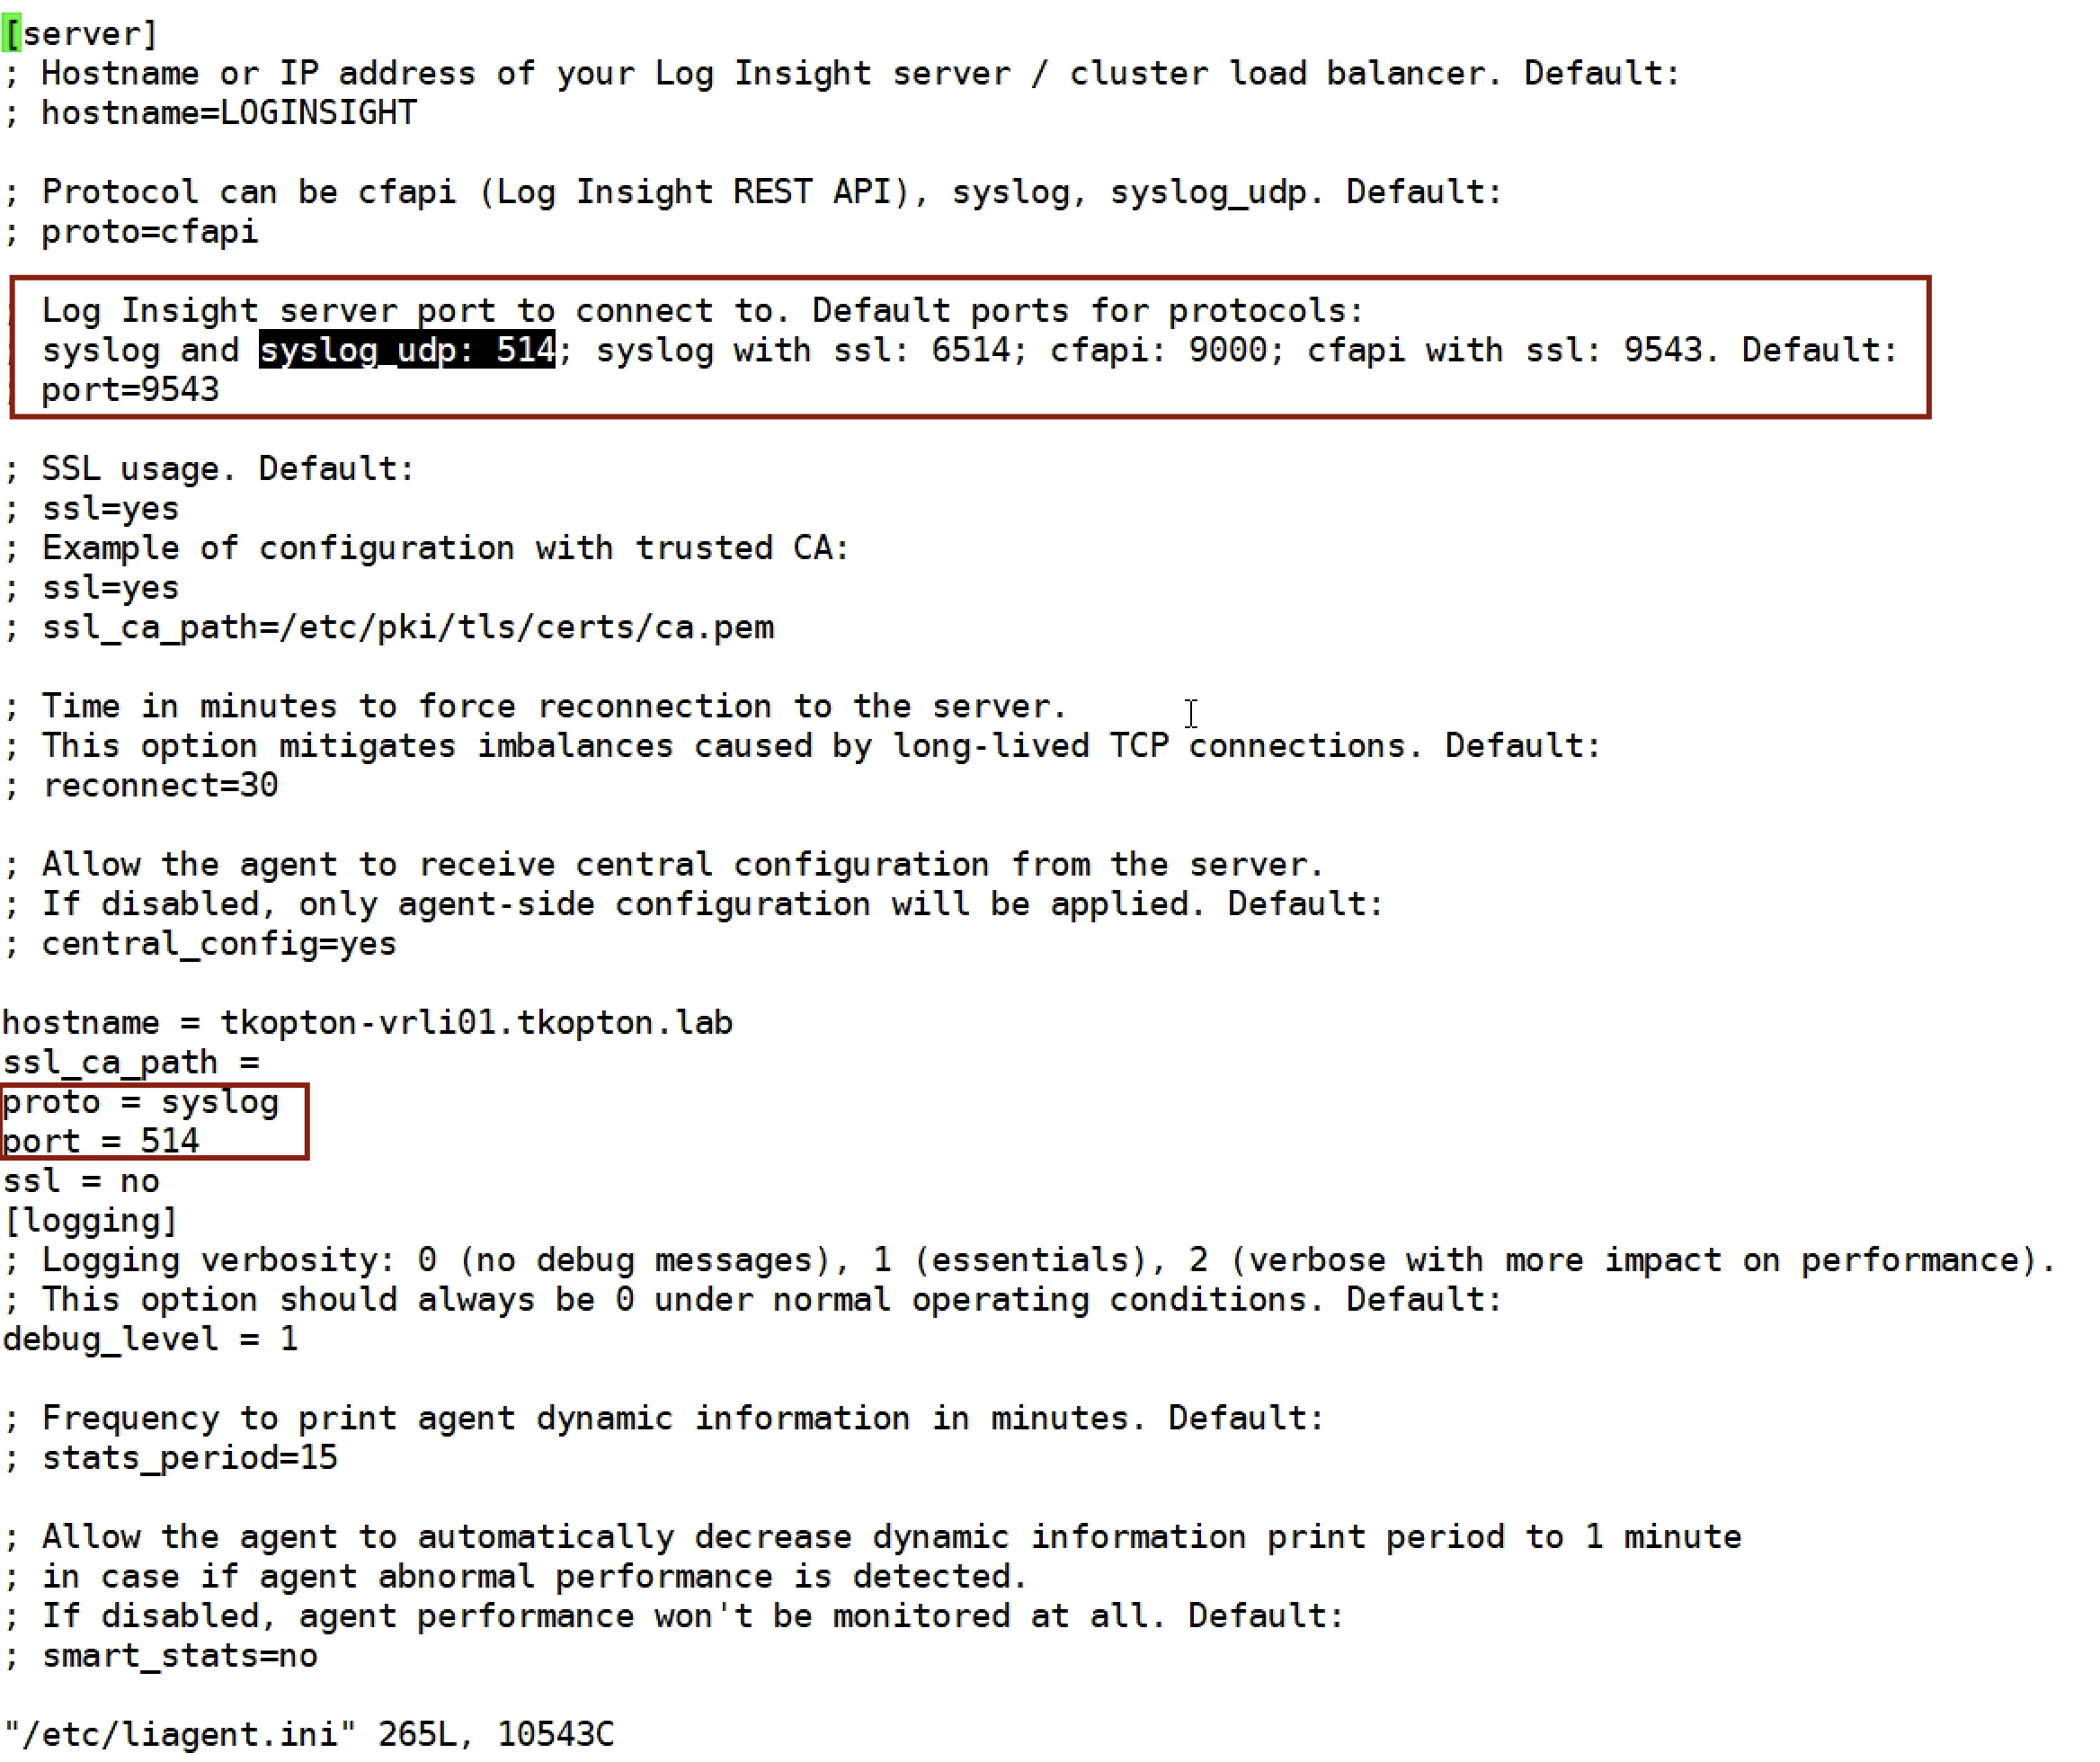
The vRLI config file explains how to set the according option:
Figure 06: liagent.ini config file
You can just replace
proto = syslog
with
proto = syslog_udp
restart the agent
service liagentd restart
and your vROps nodes starts to forward log messages to your log server using UDP.
I have setup a fake log server listening on 514 UDP using netcat:
Figure 07: Syslog over UDP in NC
If you configure the vRLI agent in vROps directly via the config file, please keep in mind:
that you are using a function which is not officially supported by VMware
you will need to make such manual changes on every node
you will need to monitor any changes to that file which can be triggered via the UI or vROps updates
In certain cases vRO workflow(s) are producing not very well structured log messages.
“not well structured” means in this case that various workflow runs may generate log messages which could include variable information in terms of number of key:value pairs as well as the values themselves.
For example we might have a workflow doing a certain complex automation job and depending on the job details the number and the actual content of information may be totally different.
What we could do is to try to put structure in the unstructured data in the workflow logic and use one of the well known vRLI parsers (KVP, CSV etc.) to parse the values for future use in vRealize Log Insight.
But what if this is not possible because for example the number of key:value pairs is unknown. Or the “keys” might change in every run?
Solution:
This is where the vRealize Log Insight JSON parser helps you.
The only
two things you need to do is:
write your vRealize Orchestrator log messages in JSON format
Include the JSON parser in your vRLI agent config
vRLI will
automatically recognize the format and parse the key:value pairs accordingly.
Example:
Here a very simple example of two lines of code doing nothing but writing log:
The format of the JSON can be completely unknown for the vRLI parser.
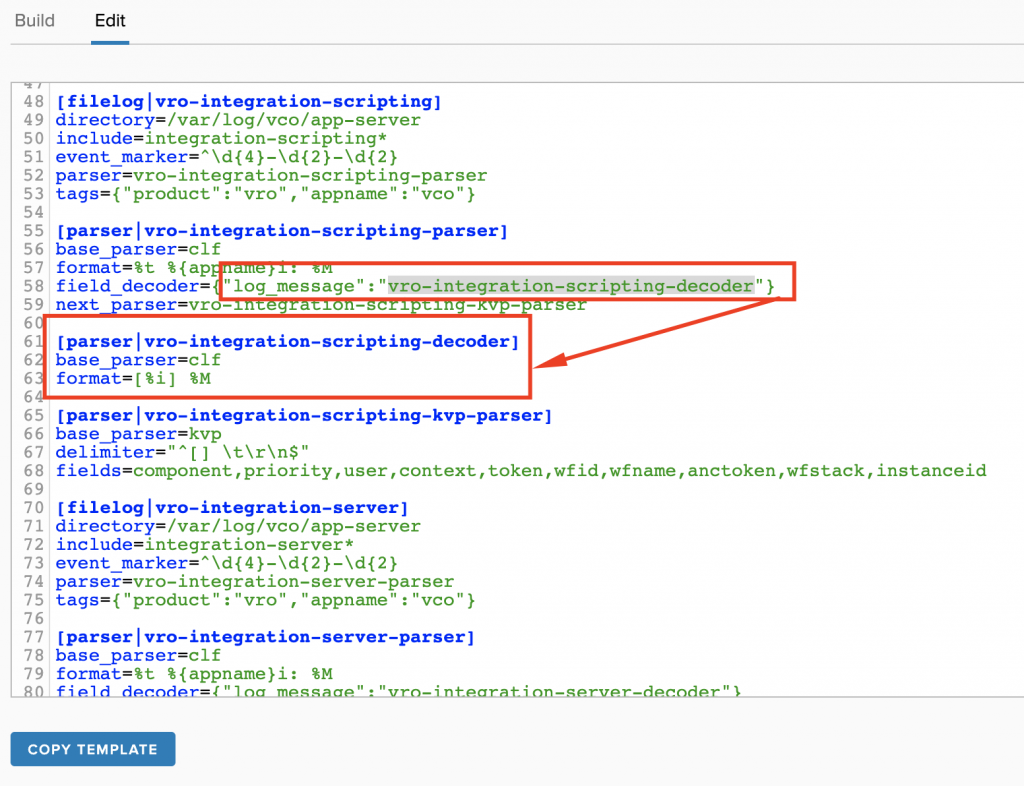
To enable vRLI parse the JSON message, we need to edit the vRLI Agent configuration. This is how the configuration looks like in the template provided by the vRealize Orchestrator Content Pack vor vRLI:
The default configuration uses the clf-parser as the parser for the log message.
Inserting the JSON-parser here let vRLI recognize all key:value pairs in the log message:
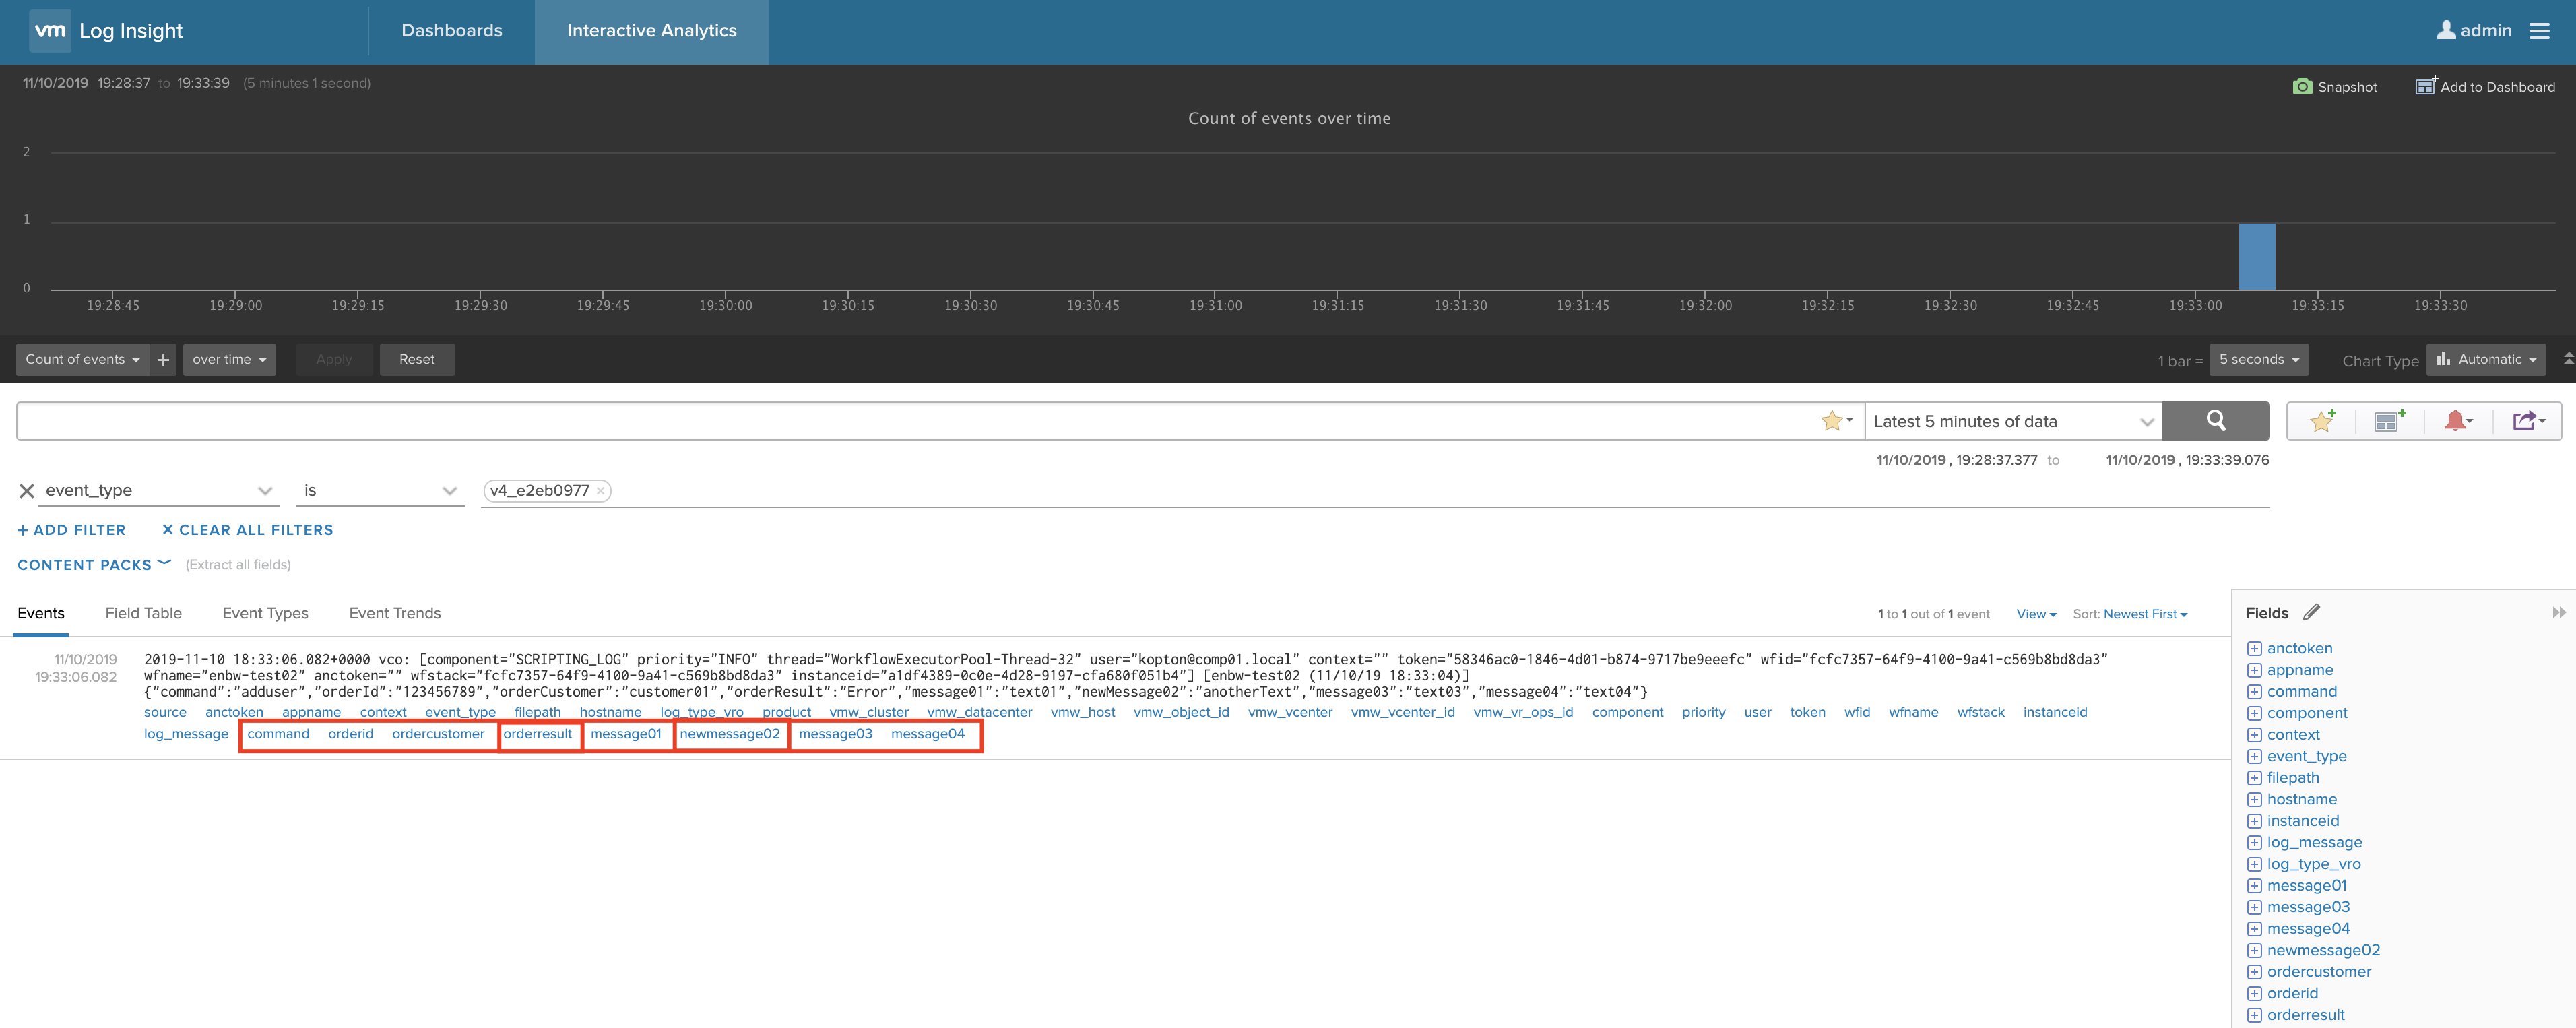
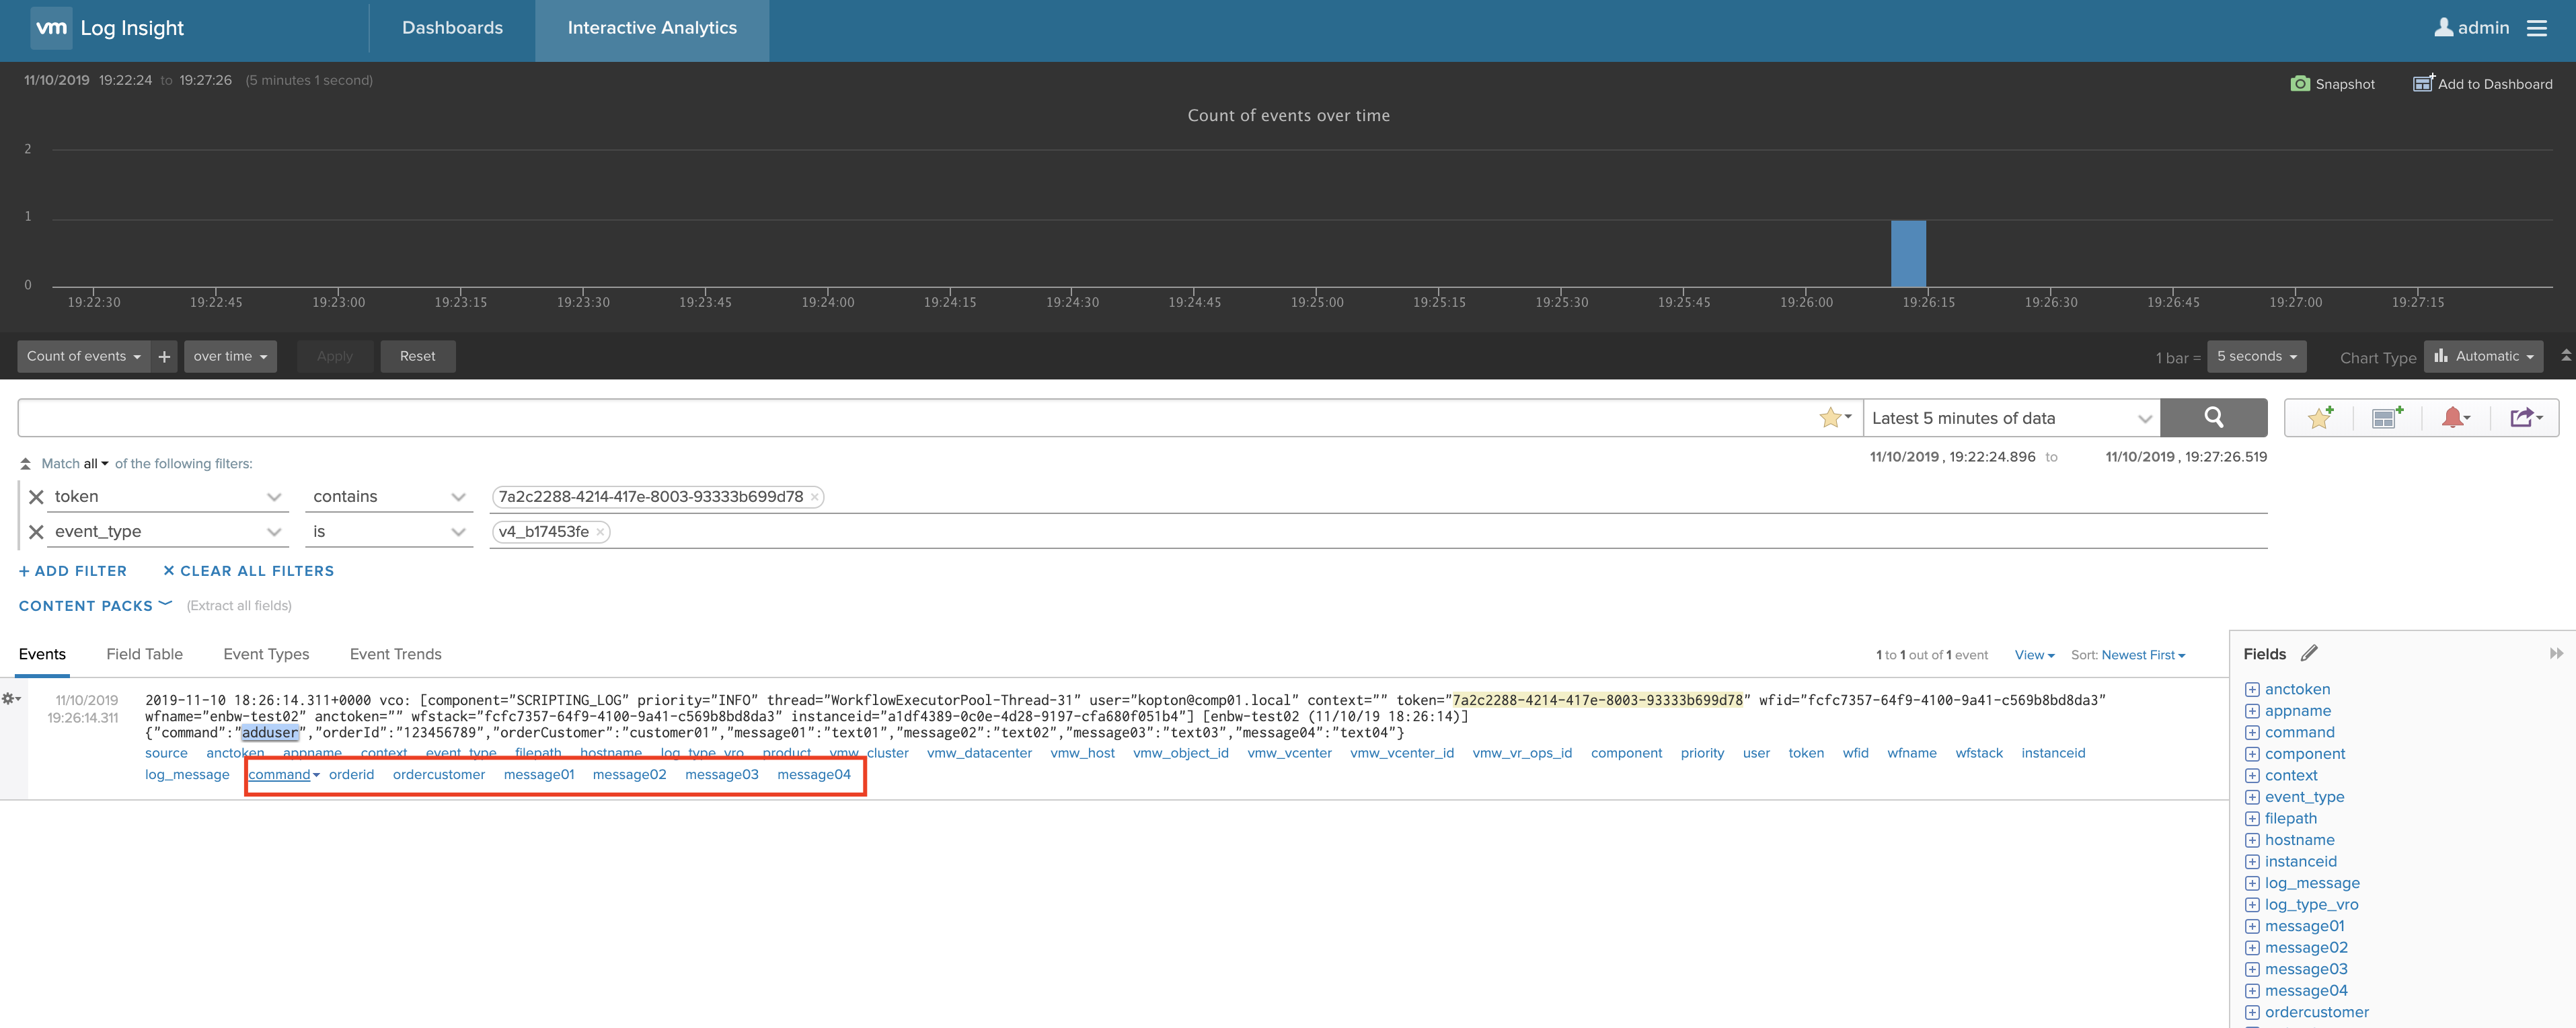
And here the parsed message in vRLI (open image in an new tab too see details):
If your message contains new key:value pairs during the next run, you do not need to adjust anything, the parser is automatically parsing any new or changed key:value pairs:
IMPORTANT NOTE: All log file examples are not real and exact PCF log files. Since I do not have a running PCF environment while writing this post, I have used some fake examples and modified them to meet my needs.
Let’s consider following use case.
You are responsible for operating a Pivotal Cloud Foundry (PCF) environment.
PCF is sending all log messages for all spaces, orgs and apps etc. to one central vRealize Log Insight cluster.
Your developers using the PCF services would like to access their log messages.
Now, you could just grant read access to all developers but doing that you would allow every developer see all messages received by vRLI, not only PCF related.
The first and pretty easy solution is to leverage the static tag already being used by the PCF Content Pack.
The installation instruction of the content pack says:
Log Insight Setup:
1. Obtain a Virtual IP from your IT department that will be under the same Subnet as your Log Insight environment.
3. When prompted for `a list of static tags (key=value)`, enter the following:
product=pcf
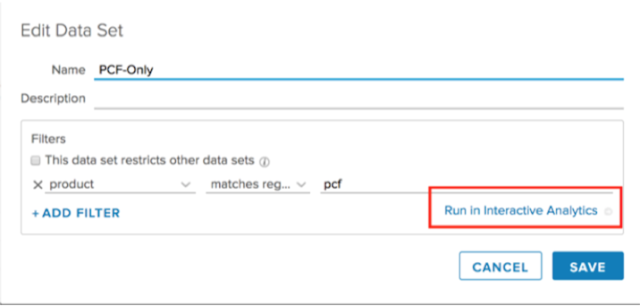
This static tag can be used for creation of an appropriated data set, which will contain only logs from your PCF environment.
If you run this settings in interactive analytics you will get only those log messages which are tagged with “product=pcf”:
But what if you want your developers to access only logs which belongs to their PCF org or/and space? Reading the documentation, you could come up with the idea of using extracted fields:
“Use the first drop-down menu to select a field defined within vRealize Log Insight to filter on. For example, hostname. The list contains all defined fields that are available statically, in content packs, and in custom content.”
But if you try to use your own extracted fields in a data set you will notice that this kind of fields are not available in a data set configuration. The solution I have used with my last customer was to configure the vRLI agent on the PCF syslog server to set static fields “dynamically” via RegEx expression. These static fields based on app or space IDs can be used in data set filters.
Even configured as a cluster vRealize Log Insight does not support high availability in terms of availability of data and availability of all functions and configuration data.
What does it mean exactly?
In a vRLI cluster there are basically two types of nodes:
one master node
up to 11 worker nodes (as for vRLI 4.5)
What will happen if one (or more) of those nodes fails?
worker node
In case it is a worker node, the cluster remains fully accessible but we will not be able to access the data which was stored on this particular node. It might also be, that exactly this node was holding the VIP, in this case the cluster will elect a new node to hold the VIP. But what if this node cannot be restored anymore?
You have a full backup of this node – everything will be fine, just run you restore procedure and your back to business.
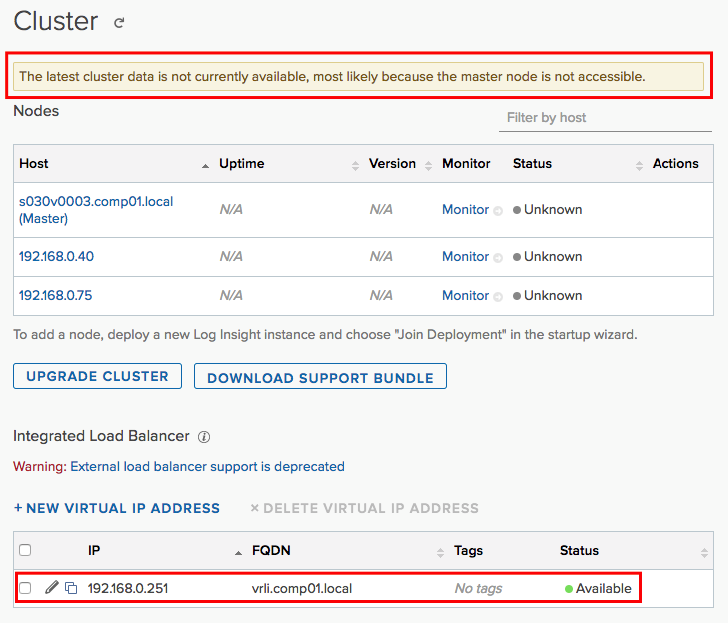
In case it is a master node, again the same applies: the cluster remains fully accessible but we will not be able to access the data which was stored on this particular node. It might also be, that exactly this node was holding the VIP, in this case the cluster will elect a new node to hold the VIP. BUT you will not be able to access and change the cluster configuration, the status will be unavailable etc.:
But what if this node cannot be restored anymore?
You have a full backup of this node – everything will be fine, just run you restore procedure and your back to business.
You, for some reason, don’t have any backups, nothing, not even a single file. You’re screwed!
But there is good news even if you cannot backup the whole node (maybe it is just too big, or for whatever reason) – just backup the right data to make a master node restore as easy as restoring a worker node.