It all started with my last electricity bill. Shortly after I have recovered from the shock and made sure that I really do not have any aluminum smelter running in my basement, I decided, I need some kind of monitoring of my electric energy consumption.
Insights into data is the first and probably most important step in the process of taking measures to change any given situation.
My plan was to consume the available Smart Messaging Language (SML) data and following that post (sorry, it is in German only) create a real-time dashboard:
No sooner said than done and only after few steps I have realized that it will be slightly more work to let the included webserver run on the same Raspberry PI which is already running my PI-hole??.
OK, invest time to change the scripts and build the dashboard into the PI-hole web server or use another Raspberry and start over?
As I already have the data available in the vzlogger.log file why shouldn’t I use my vRealize Loginsight to display it? Sure, semantically I am dealing with time-series data here and another vRealize product would be more suitable but I wanted something quick and easy – no worries, vRealize Operations and/or Wavefront integration is already on my to-do list.
The Data
vzlogger (https://github.com/volkszaehler/vzlogger) reads the SML telegrams coming from the smart meter via serial port and stores the readings every two seconds in a log file. I have configured the log file to be: /var/log/vzlogger/vzlogger.log
[Jan 30 19:21:46][mtr0] Got 5 new readings from meter:
[Jan 30 19:21:46][mtr0] Reading: id=1-0:1.8.0255/ObisIdentifier:1-0:1.8.0255 value=38768802.85 ts=1612030906436
[Jan 30 19:21:46][mtr0] Reading: id=1-0:1.8.1255/ObisIdentifier:1-0:1.8.1255 value=15102120.00 ts=1612030906436
[Jan 30 19:21:46][mtr0] Reading: id=1-0:1.8.2255/ObisIdentifier:1-0:1.8.2255 value=23666680.00 ts=1612030906436
[Jan 30 19:21:46][mtr0] Reading: id=1-0:1.7.0255/ObisIdentifier:1-0:1.7.0255 value=386.51 ts=1612030906436
[Jan 30 19:21:46][mtr0] Reading: id=1-0:96.5.5255/ObisIdentifier:1-0:96.5.5255 value=6560.00 ts=1612030906436
Syslog Configuration
As I do not have a vRLI Agent for the ARM platform I decided to use rsyslog to send the log file entries to vRealize Log Insight.
The configuration follows the rsyslog procedures. I have simply created an appropriate file in /etc/rsyslog.d
vzlogger.conf
$ModLoad imfile
$InputFileName /var/log/vzlogger/vzlogger.log
$InputFileTag vzlogger
# $InputFileStateFile
$InputFilePollInterval 10
$InputFileSeverity info
$InputFileFacility local3
$InputRunFileMonitor
local3.* @@xxx.xxx.xxx.xxx
xxx.xxx.xxx.xxx in @@xxx.xxx.xxx.xxx is of course the IP of my vRealize Log Insight instance.
vRealize Log Insight Configuration
After restarting the rsyslog daemon the SML decoded messages start arriving in vRLI every 10 seconds as configured in vzlogger.conf.
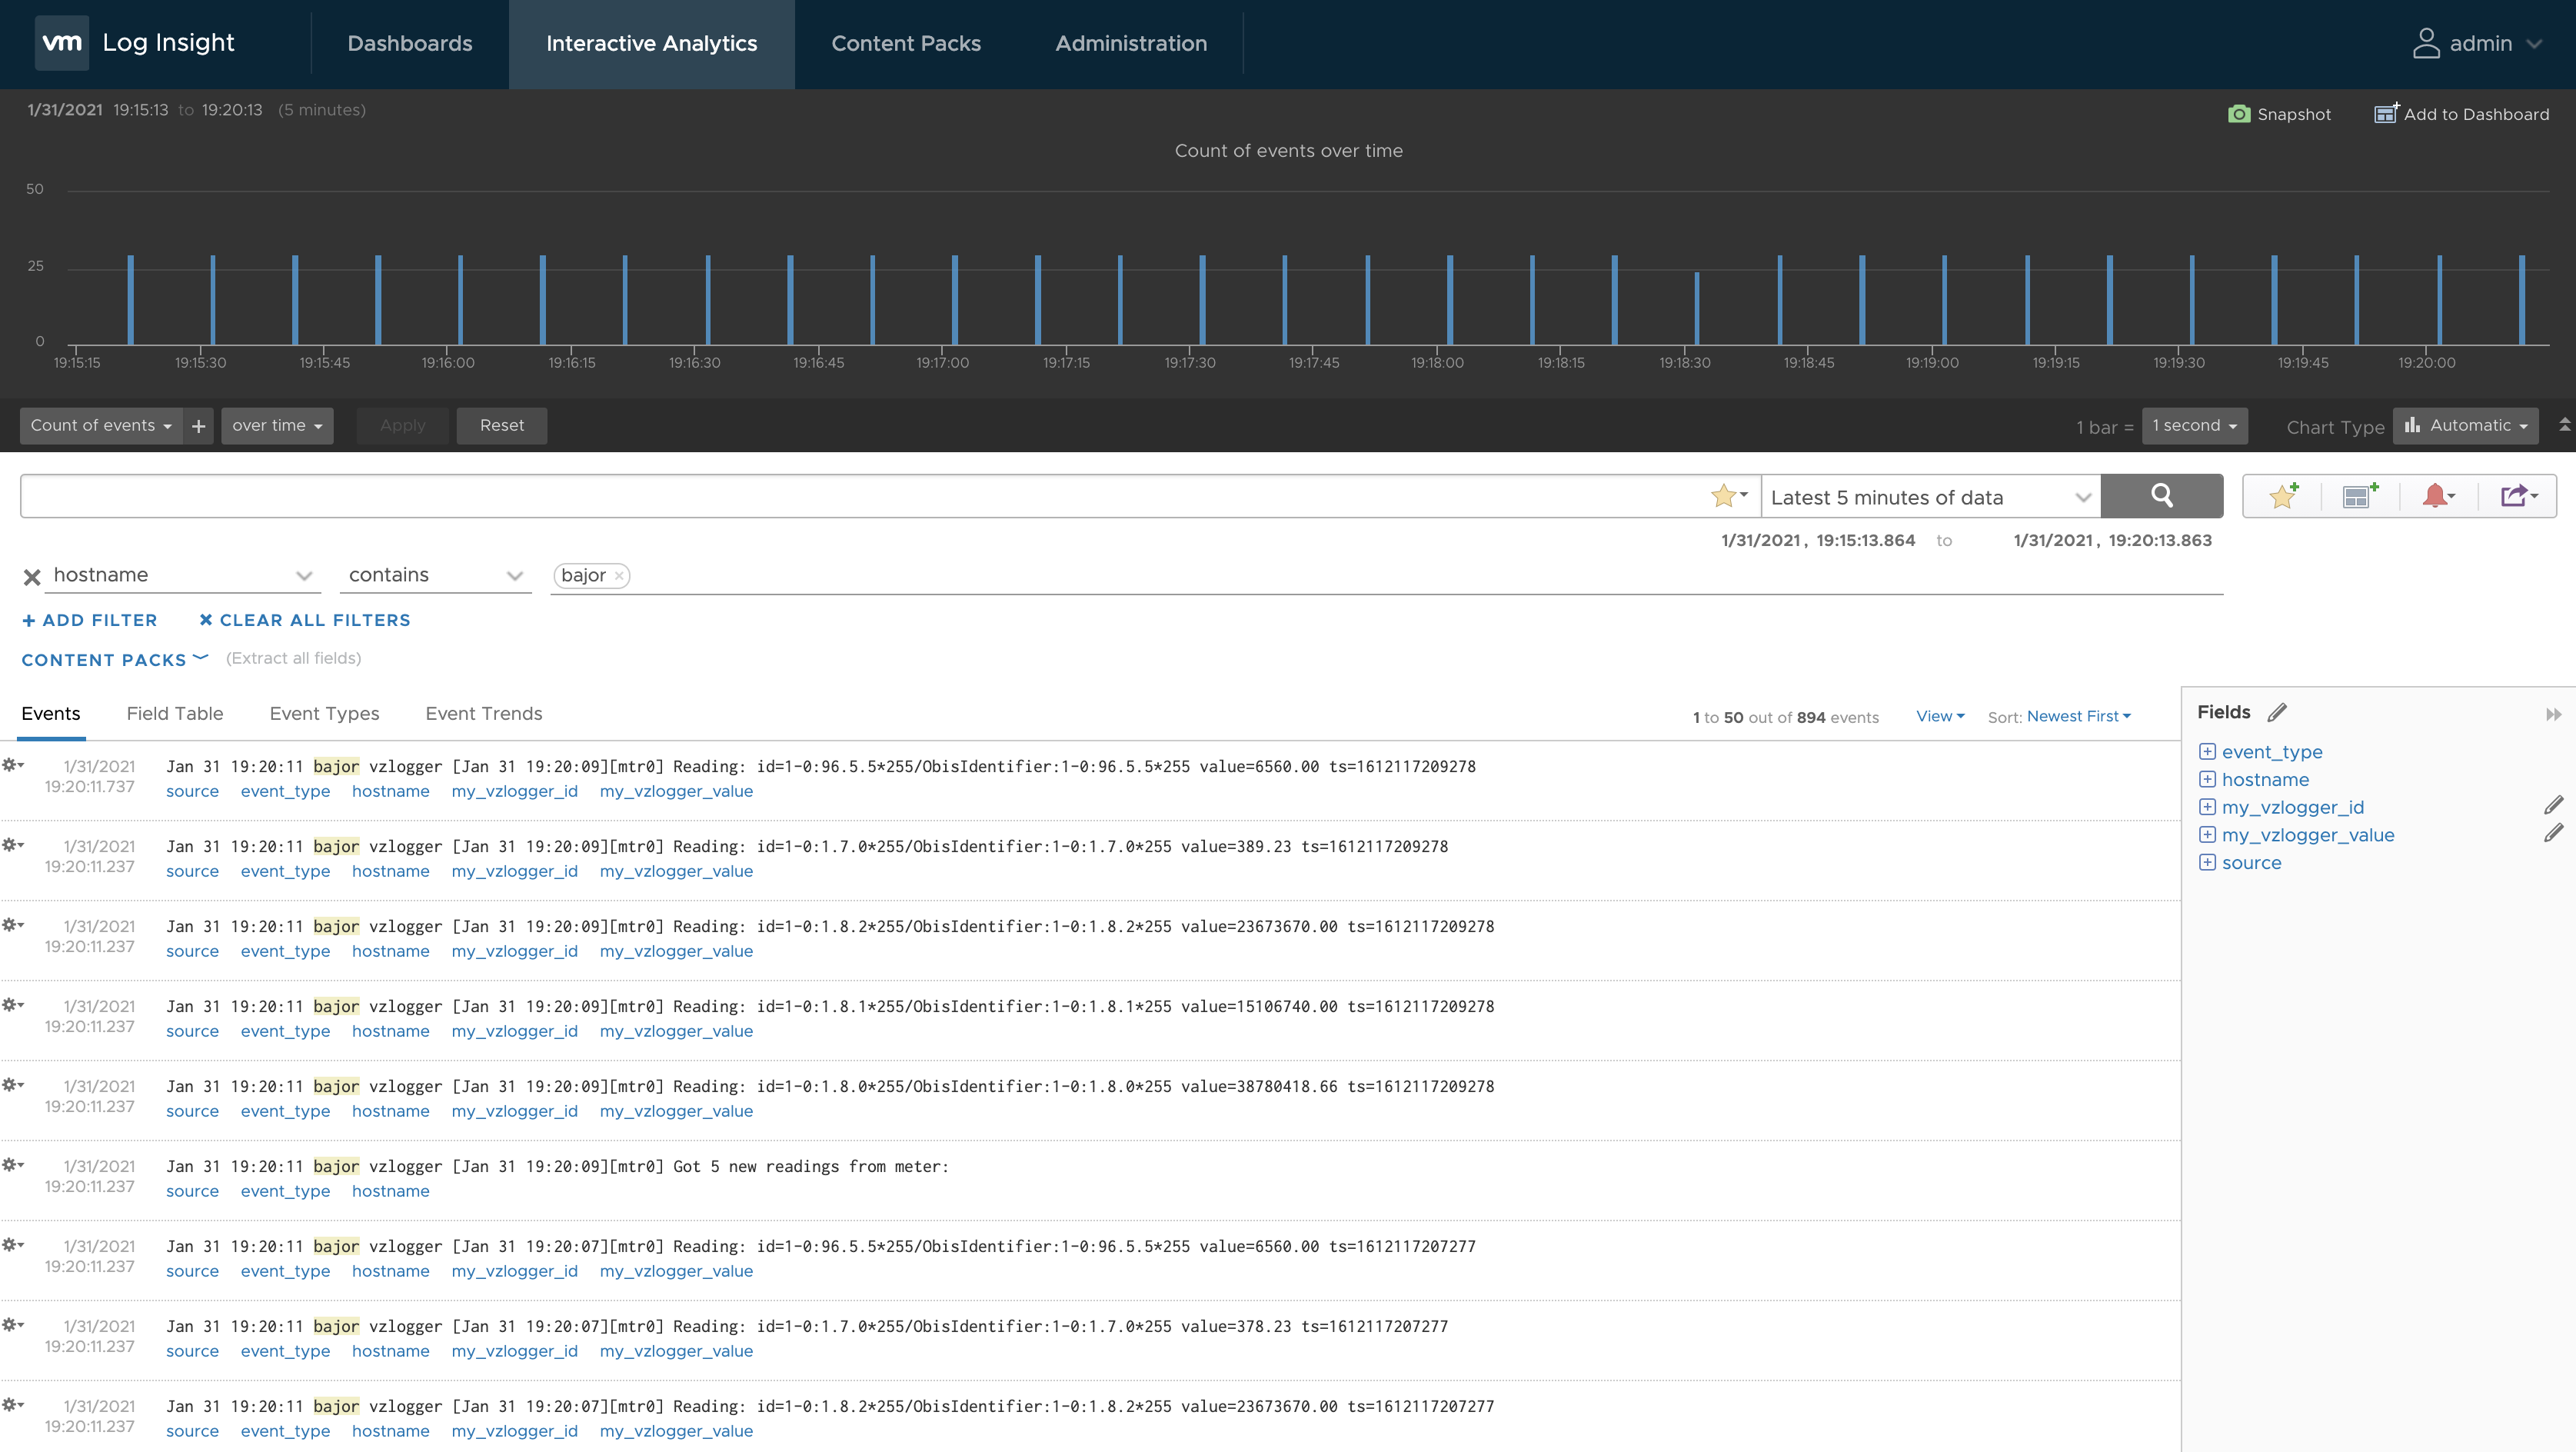
vRealize Log Insight Extracted Fields are a good way to extract the actual metrics defined by the Object Identification System (OBIS):
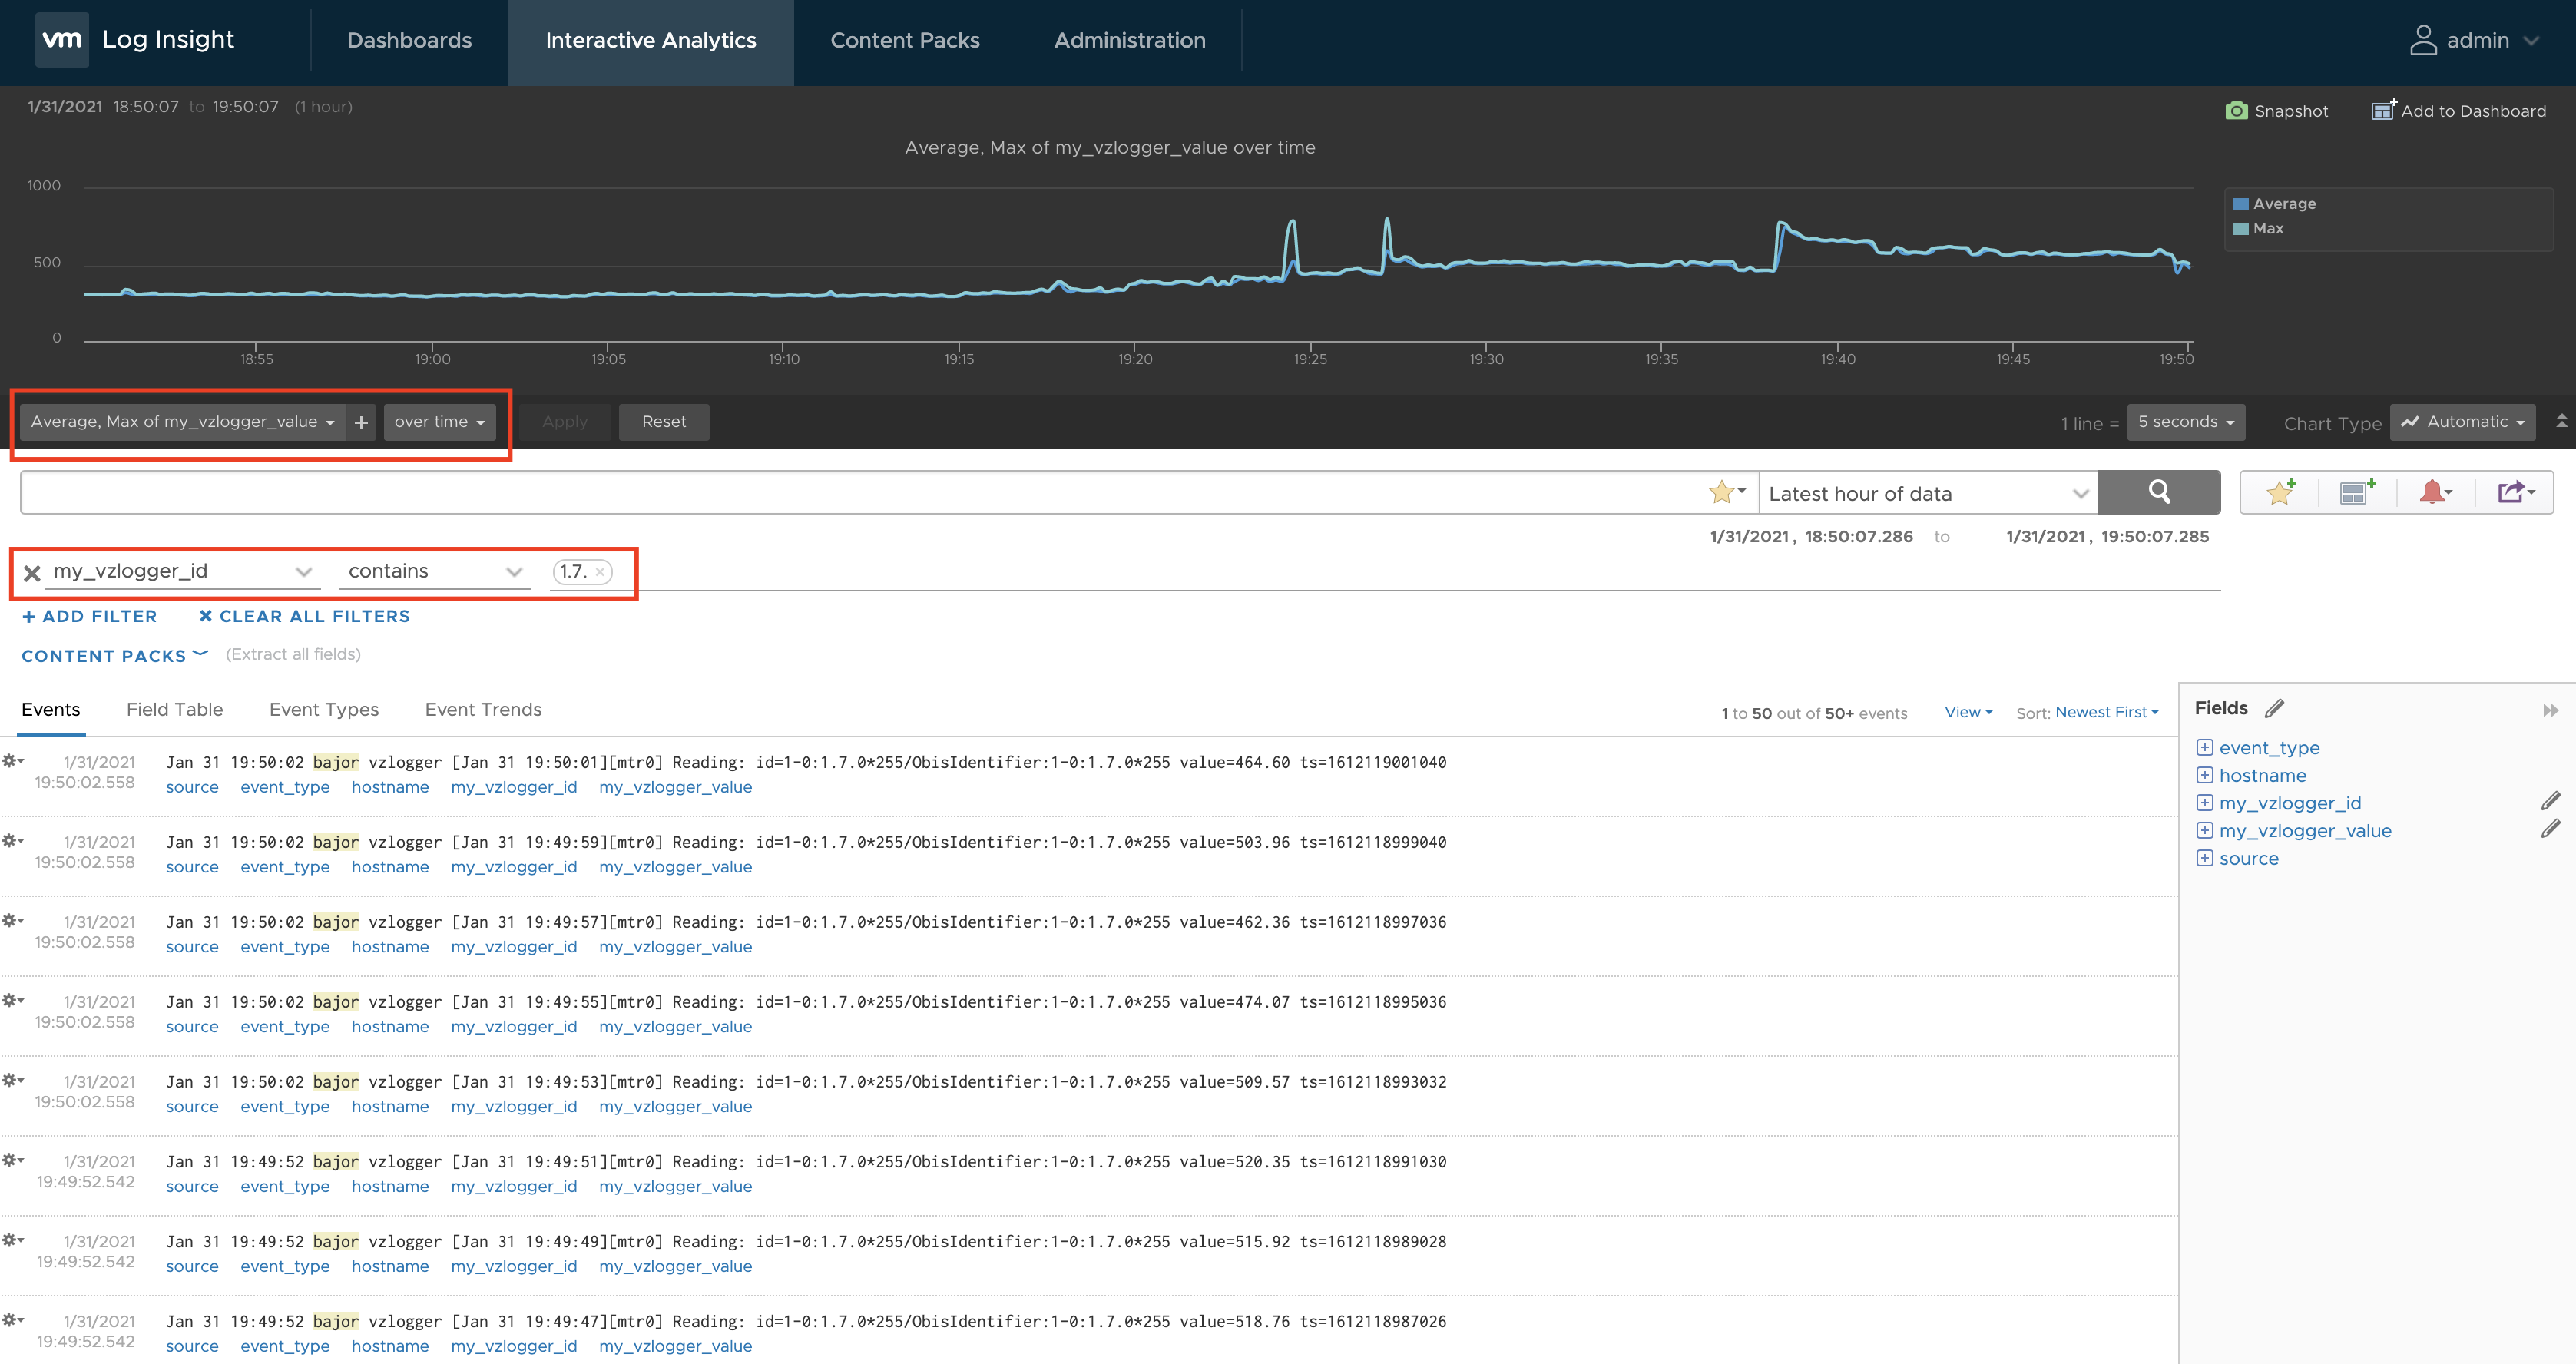
- ObisIdentifier:1-0:1.7.0 = key 1.7.0 = Current consuption in (WATT)
- ObisIdentifier:1-0:1.8.1 = key 1.8.1 = Accumulated consumption – rate 1 (meter reading)
- ObisIdentifier:1-0:1.8.2 = key 1.8.2 = Accumulated consumption – rate 2 (meter reading)
To make the extraction of the value efficient, I am using the hostname of the data source as additional context. Additional context ensures that vRLI does not have to parse every single log message arriving in vRLI. Only messages coming from my Raspberry PI will be parsed.
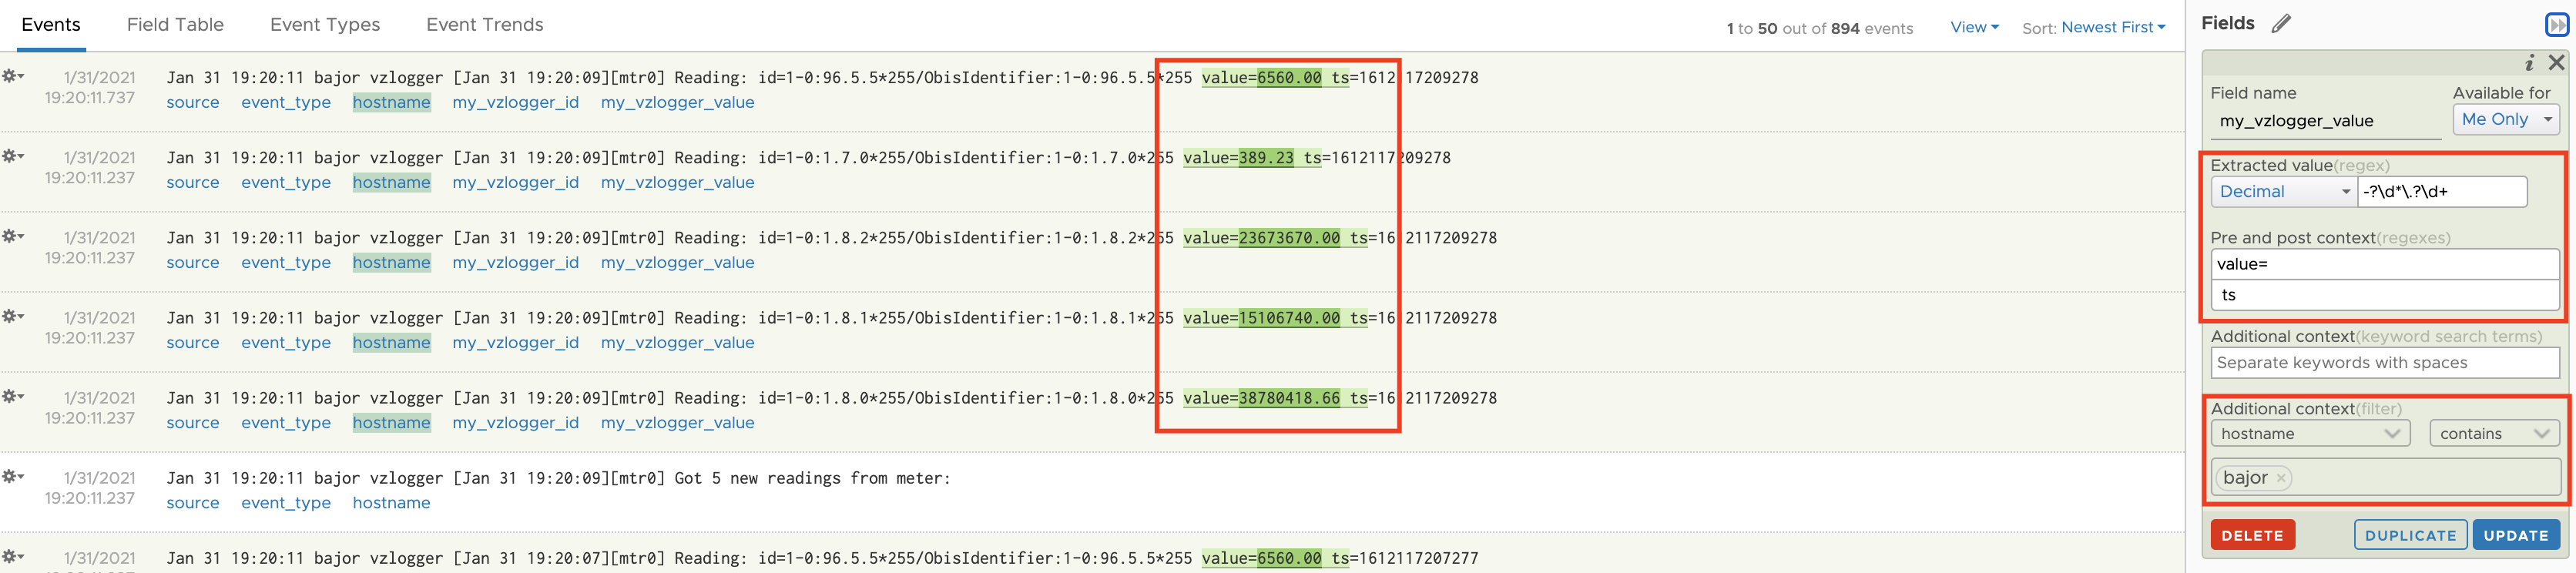
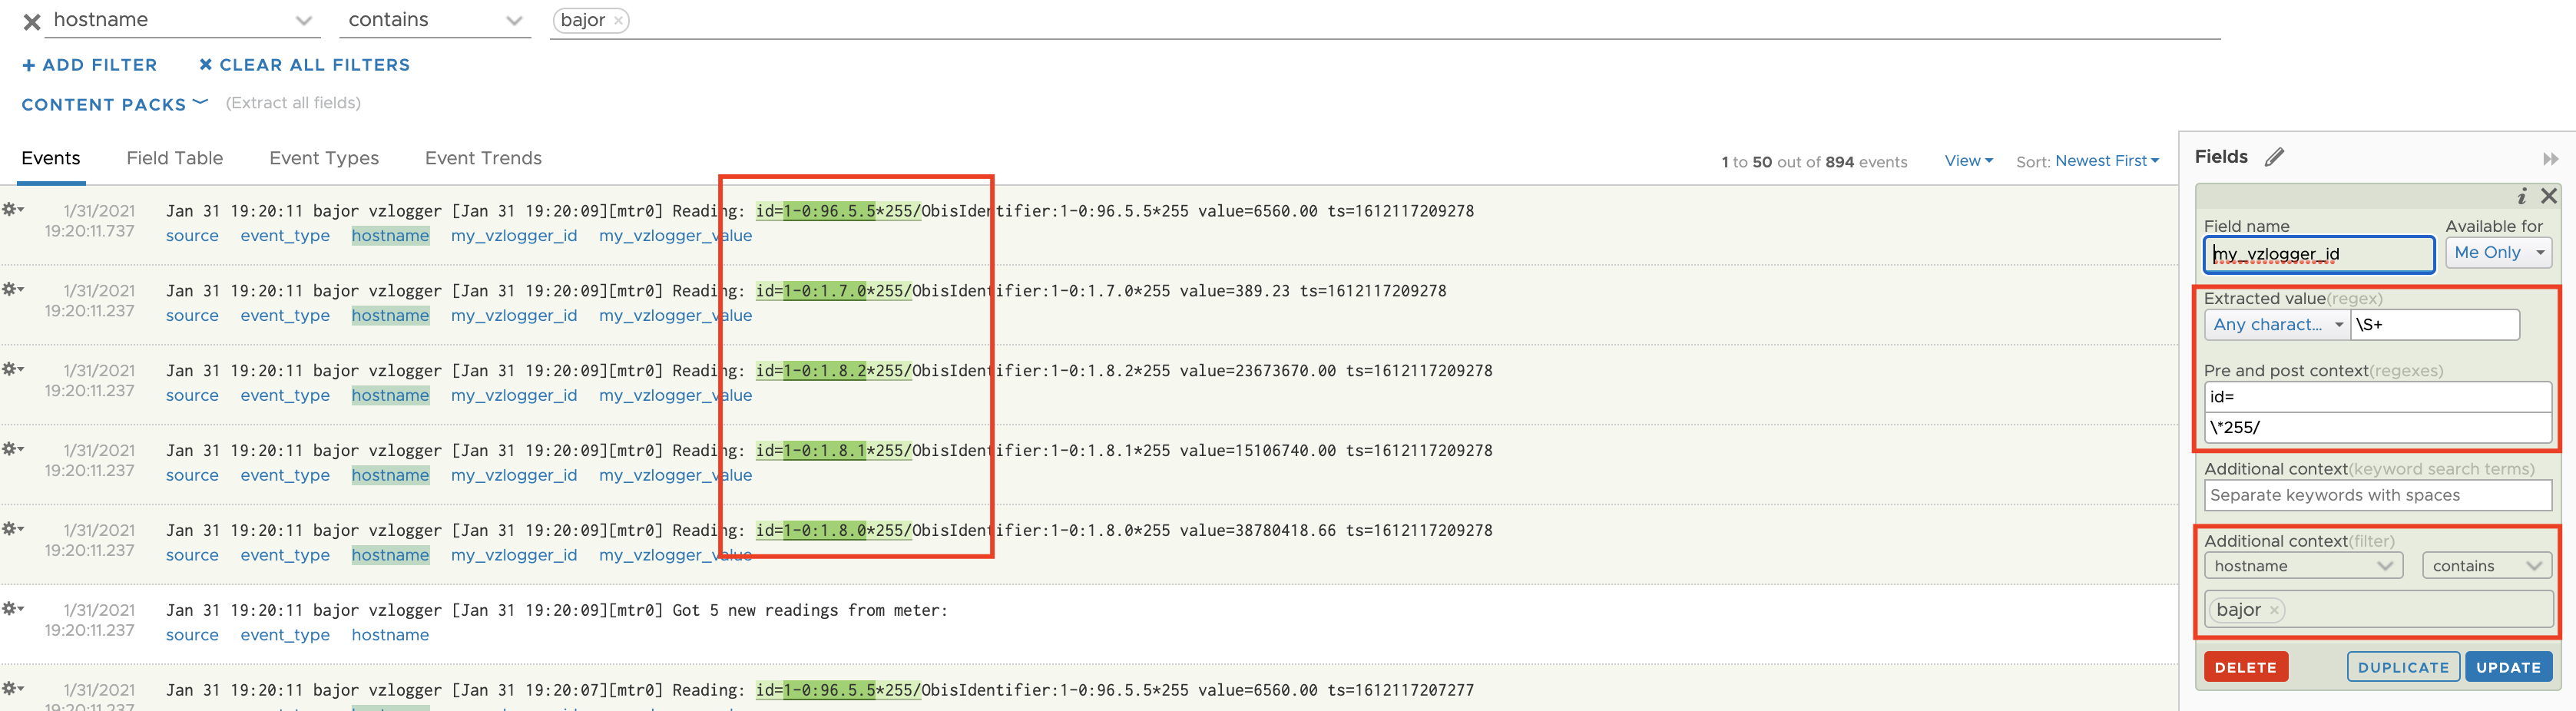
Additionally I extract the OBIS key to use both, key and value to create my dashboards.
Now it is easy to show the actual consumption using both extracted fields.
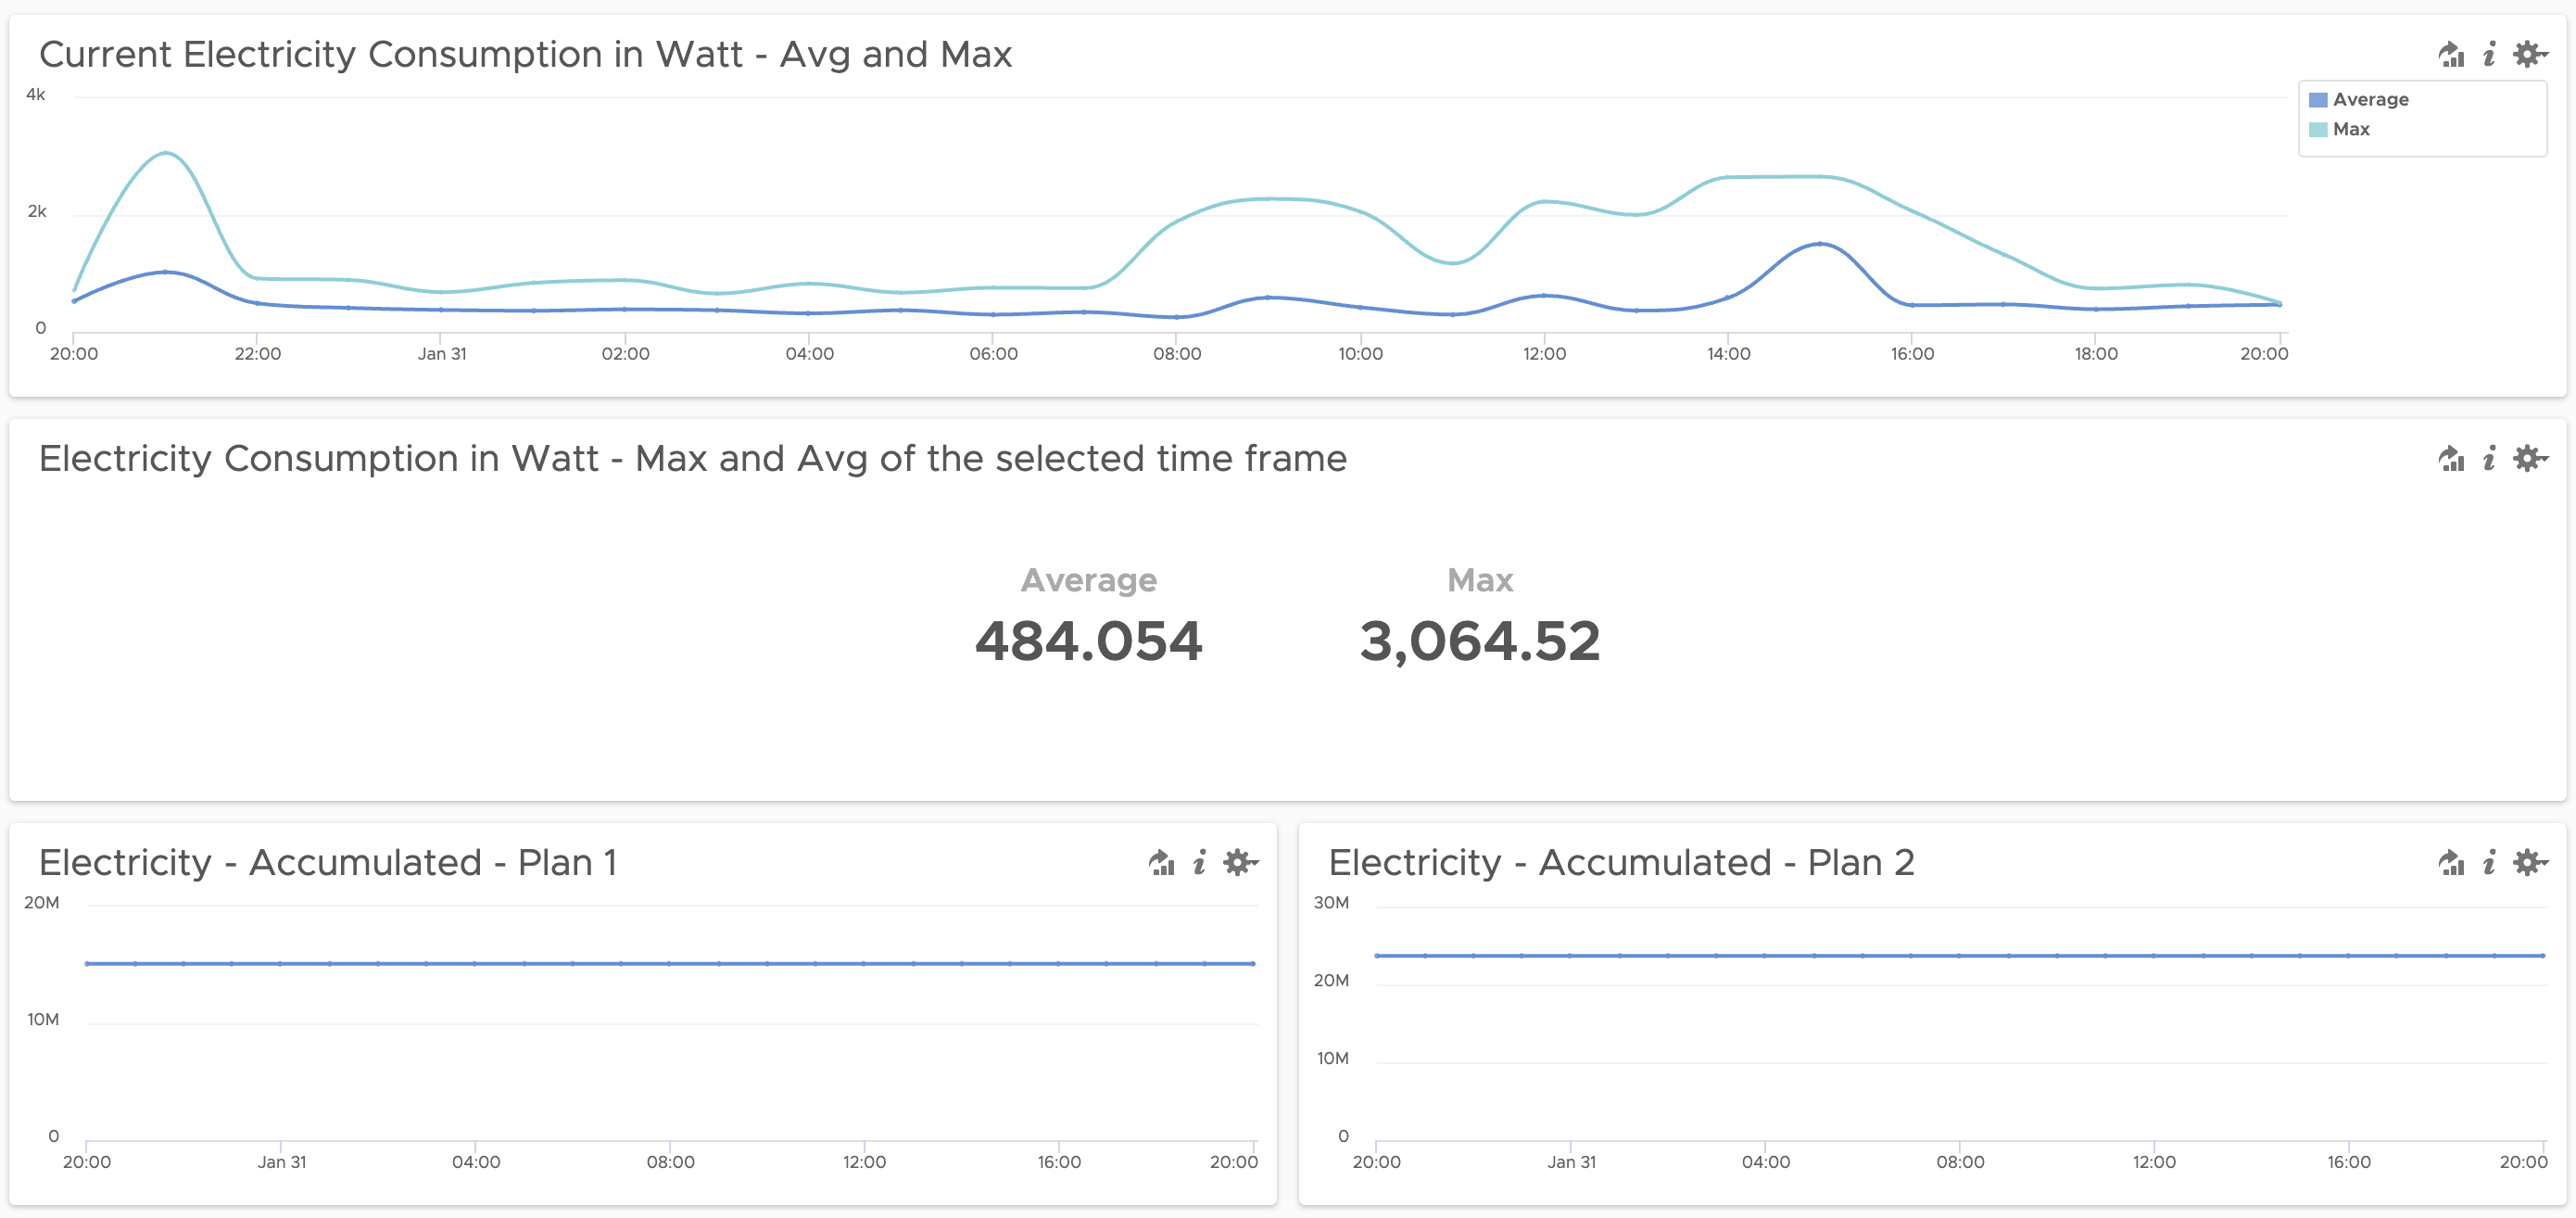
vRealize Log Insight Dashboard (Sharing)
Information made visible in the vRealize Log Insight Interactive Analytics can be added to a dashboard and shared with other users.

The dashboard can have multiple widgets and give you a quick insight into the collected data.
vRealize Log Insight Partition
Another fairly new (since 8.1) feature of vRealize Log Insight I have used in this example is Data Partitions.
You can retain log data in a partition with a filter and a retention period. Data partitions let you define different retention periods for different types of logs. For example, logs with sensitive information might require a short retention period, such as five days. The log data that matches the filter criteria for a data partition is stored in the partition for the specified retention period. Logs that do not match the filter criteria in any of the defined data partitions are stored in the default partition. This partition is always enabled and stores data for an unlimited amount of time. You can modify the retention period for the default partition.
I have created a partition for the energy data to retain that data for 90 days. My host bajor is sending only the vzlogger messages so I can use the hostname as filter.

Outlook
As the next project, I am planning to send the metrics to vRealize Operations or Wavefront to treat them as time-series data and allow for more sophisticated analytics.
Stay safe.
Thomas – https://twitter.com/ThomasKopton
1 Comment