Overview of OOTB Sustainability
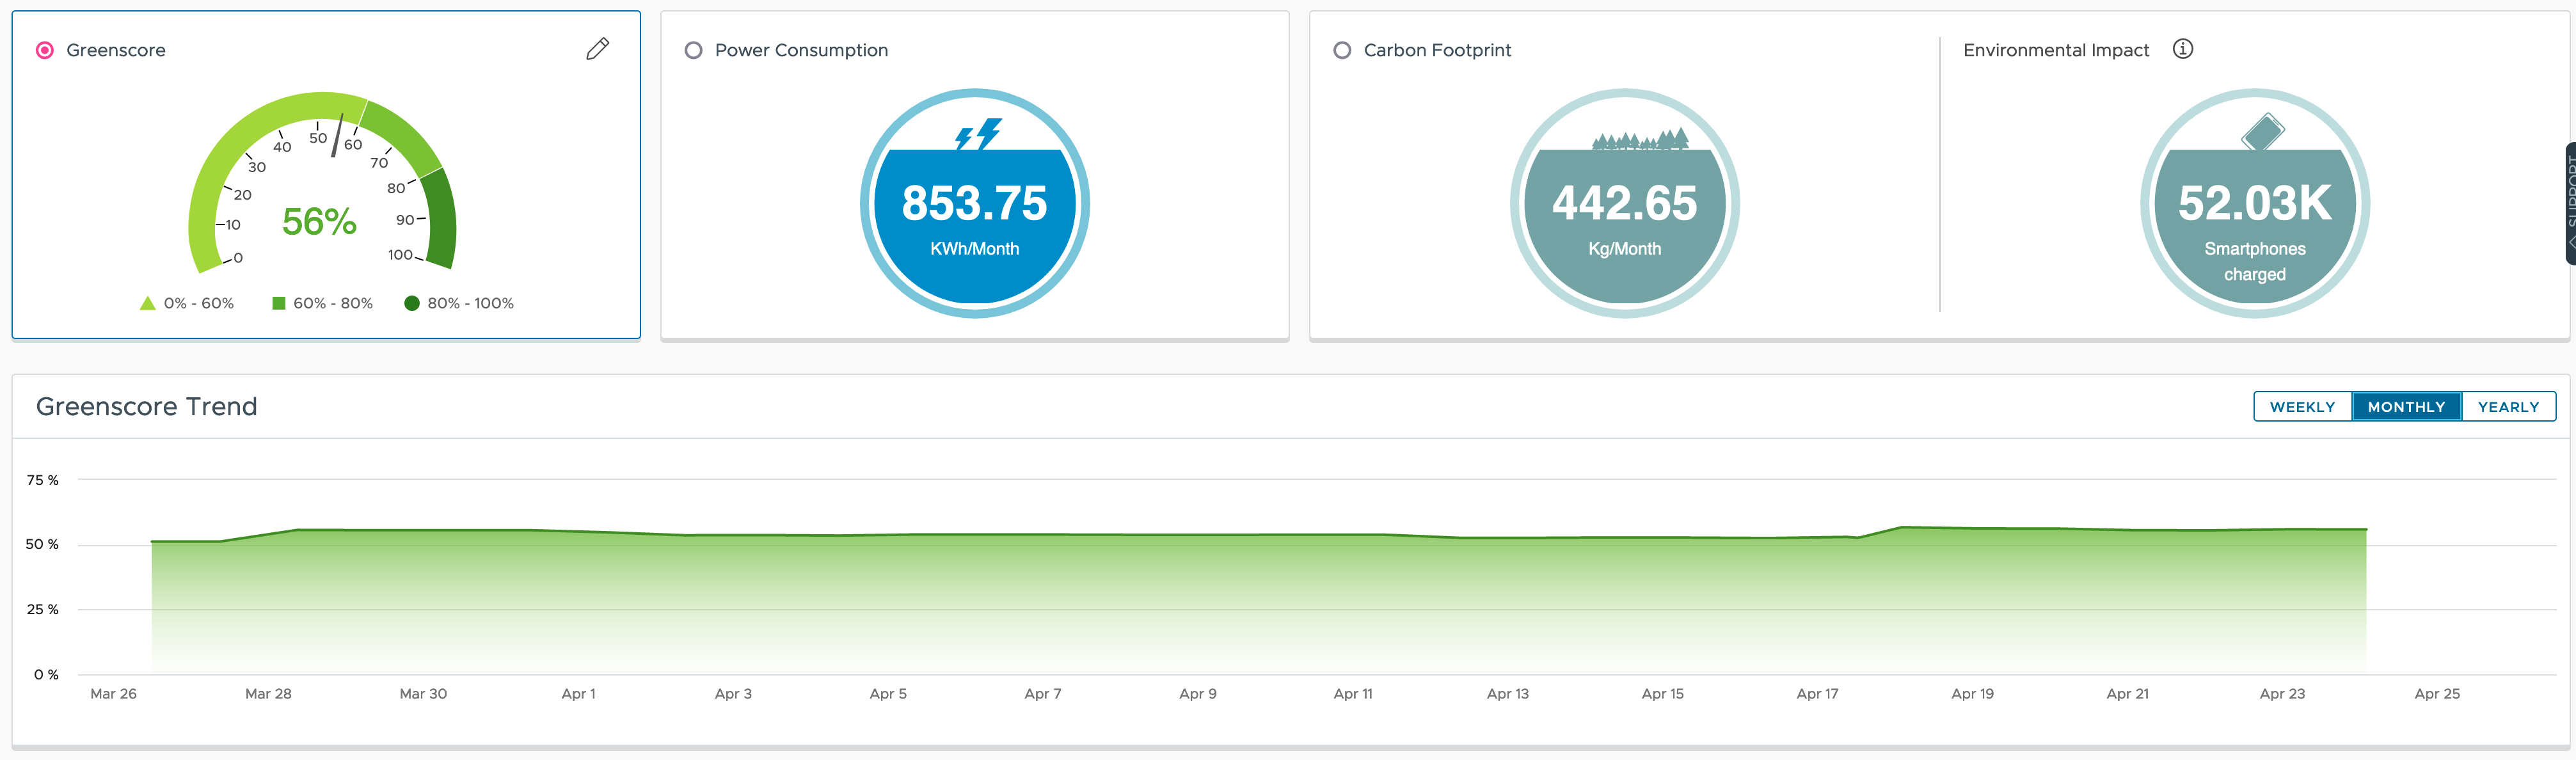
With its VMware Greenscore VMware Aria Operations provides a great way of not only showing the effects of your current efforts toward more sustainable operations, it also offers multiple approaches which will help organization improve their operational efficiency, save money and reduce carbon emissions.
Major use cases possible OOTB
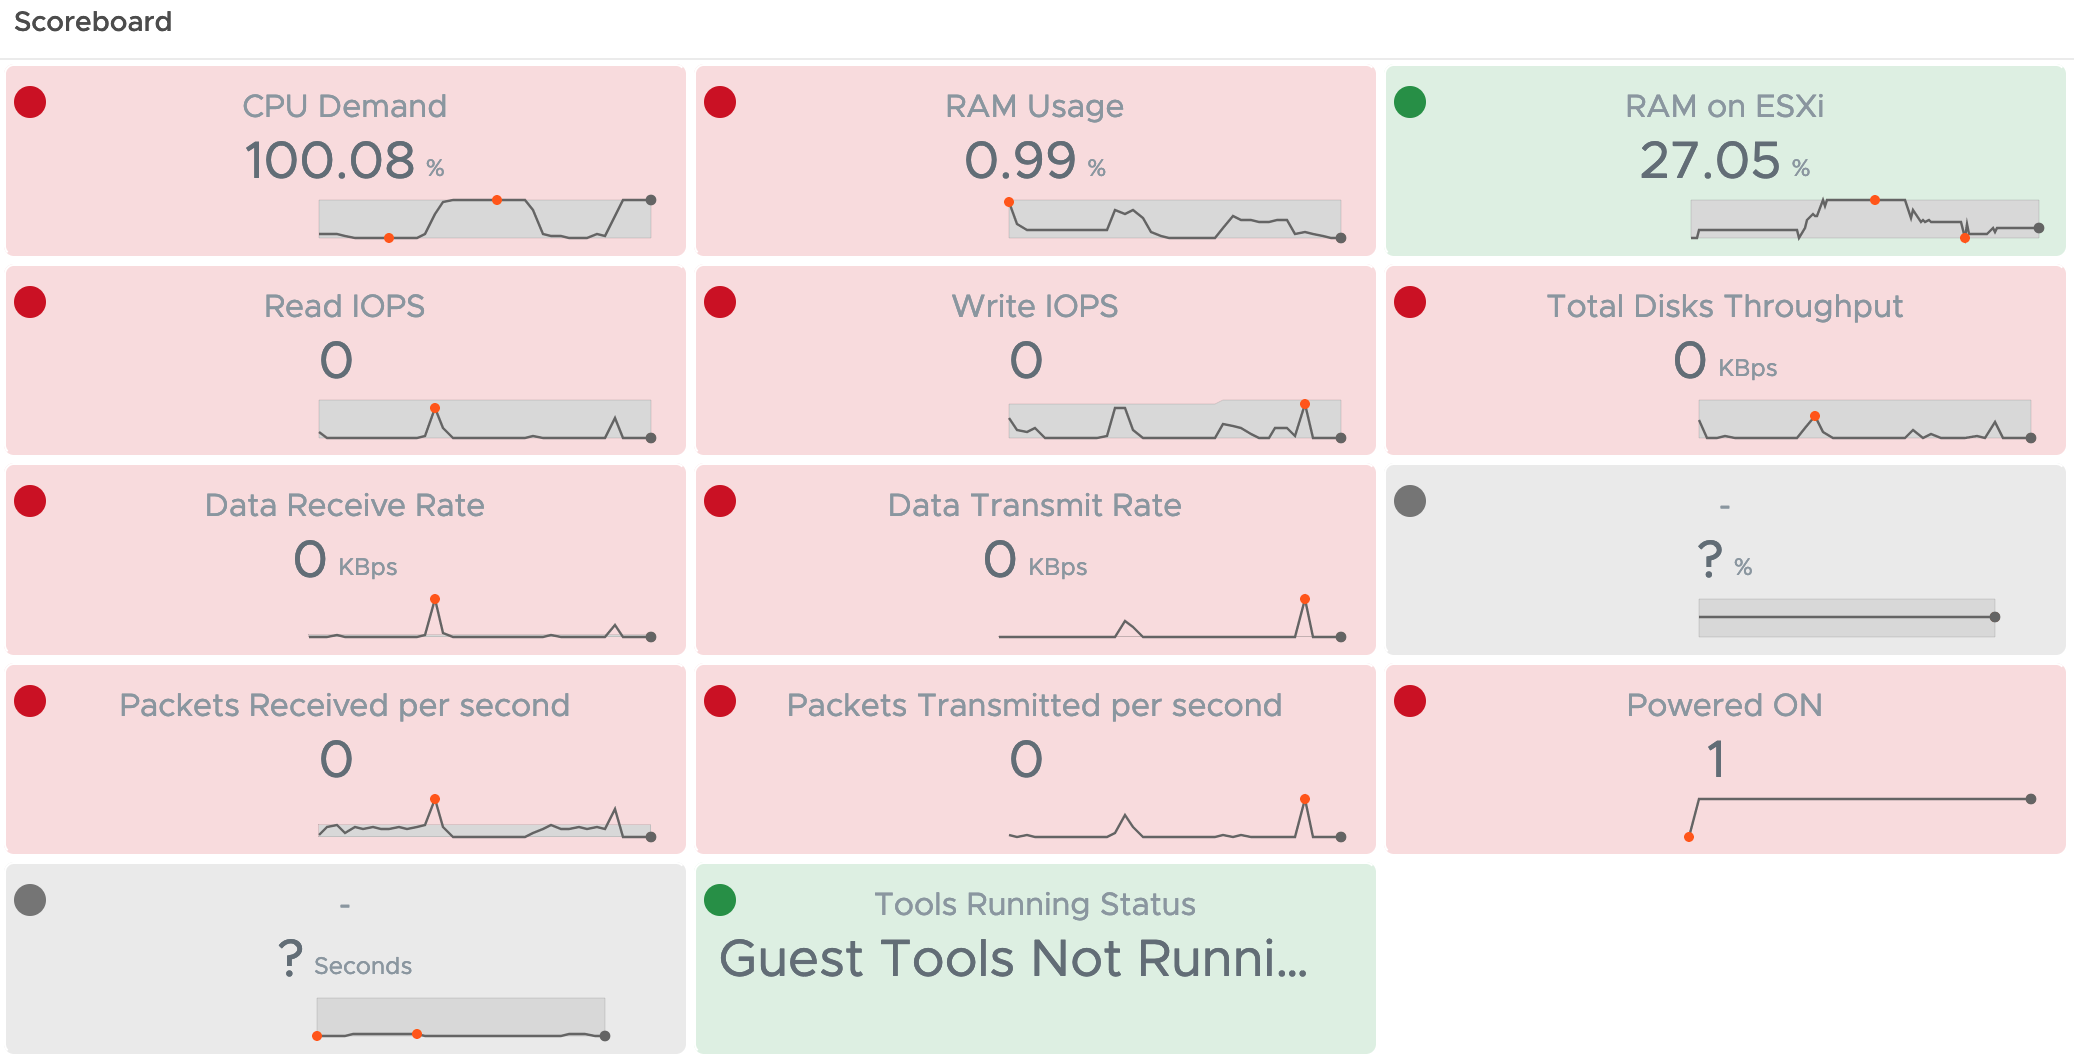
With the power usage and utilization related metrics VMware Aria Operations is collecting, and the predefined set of Dashboards the operations teams can quickly identify opportunities for improvement.
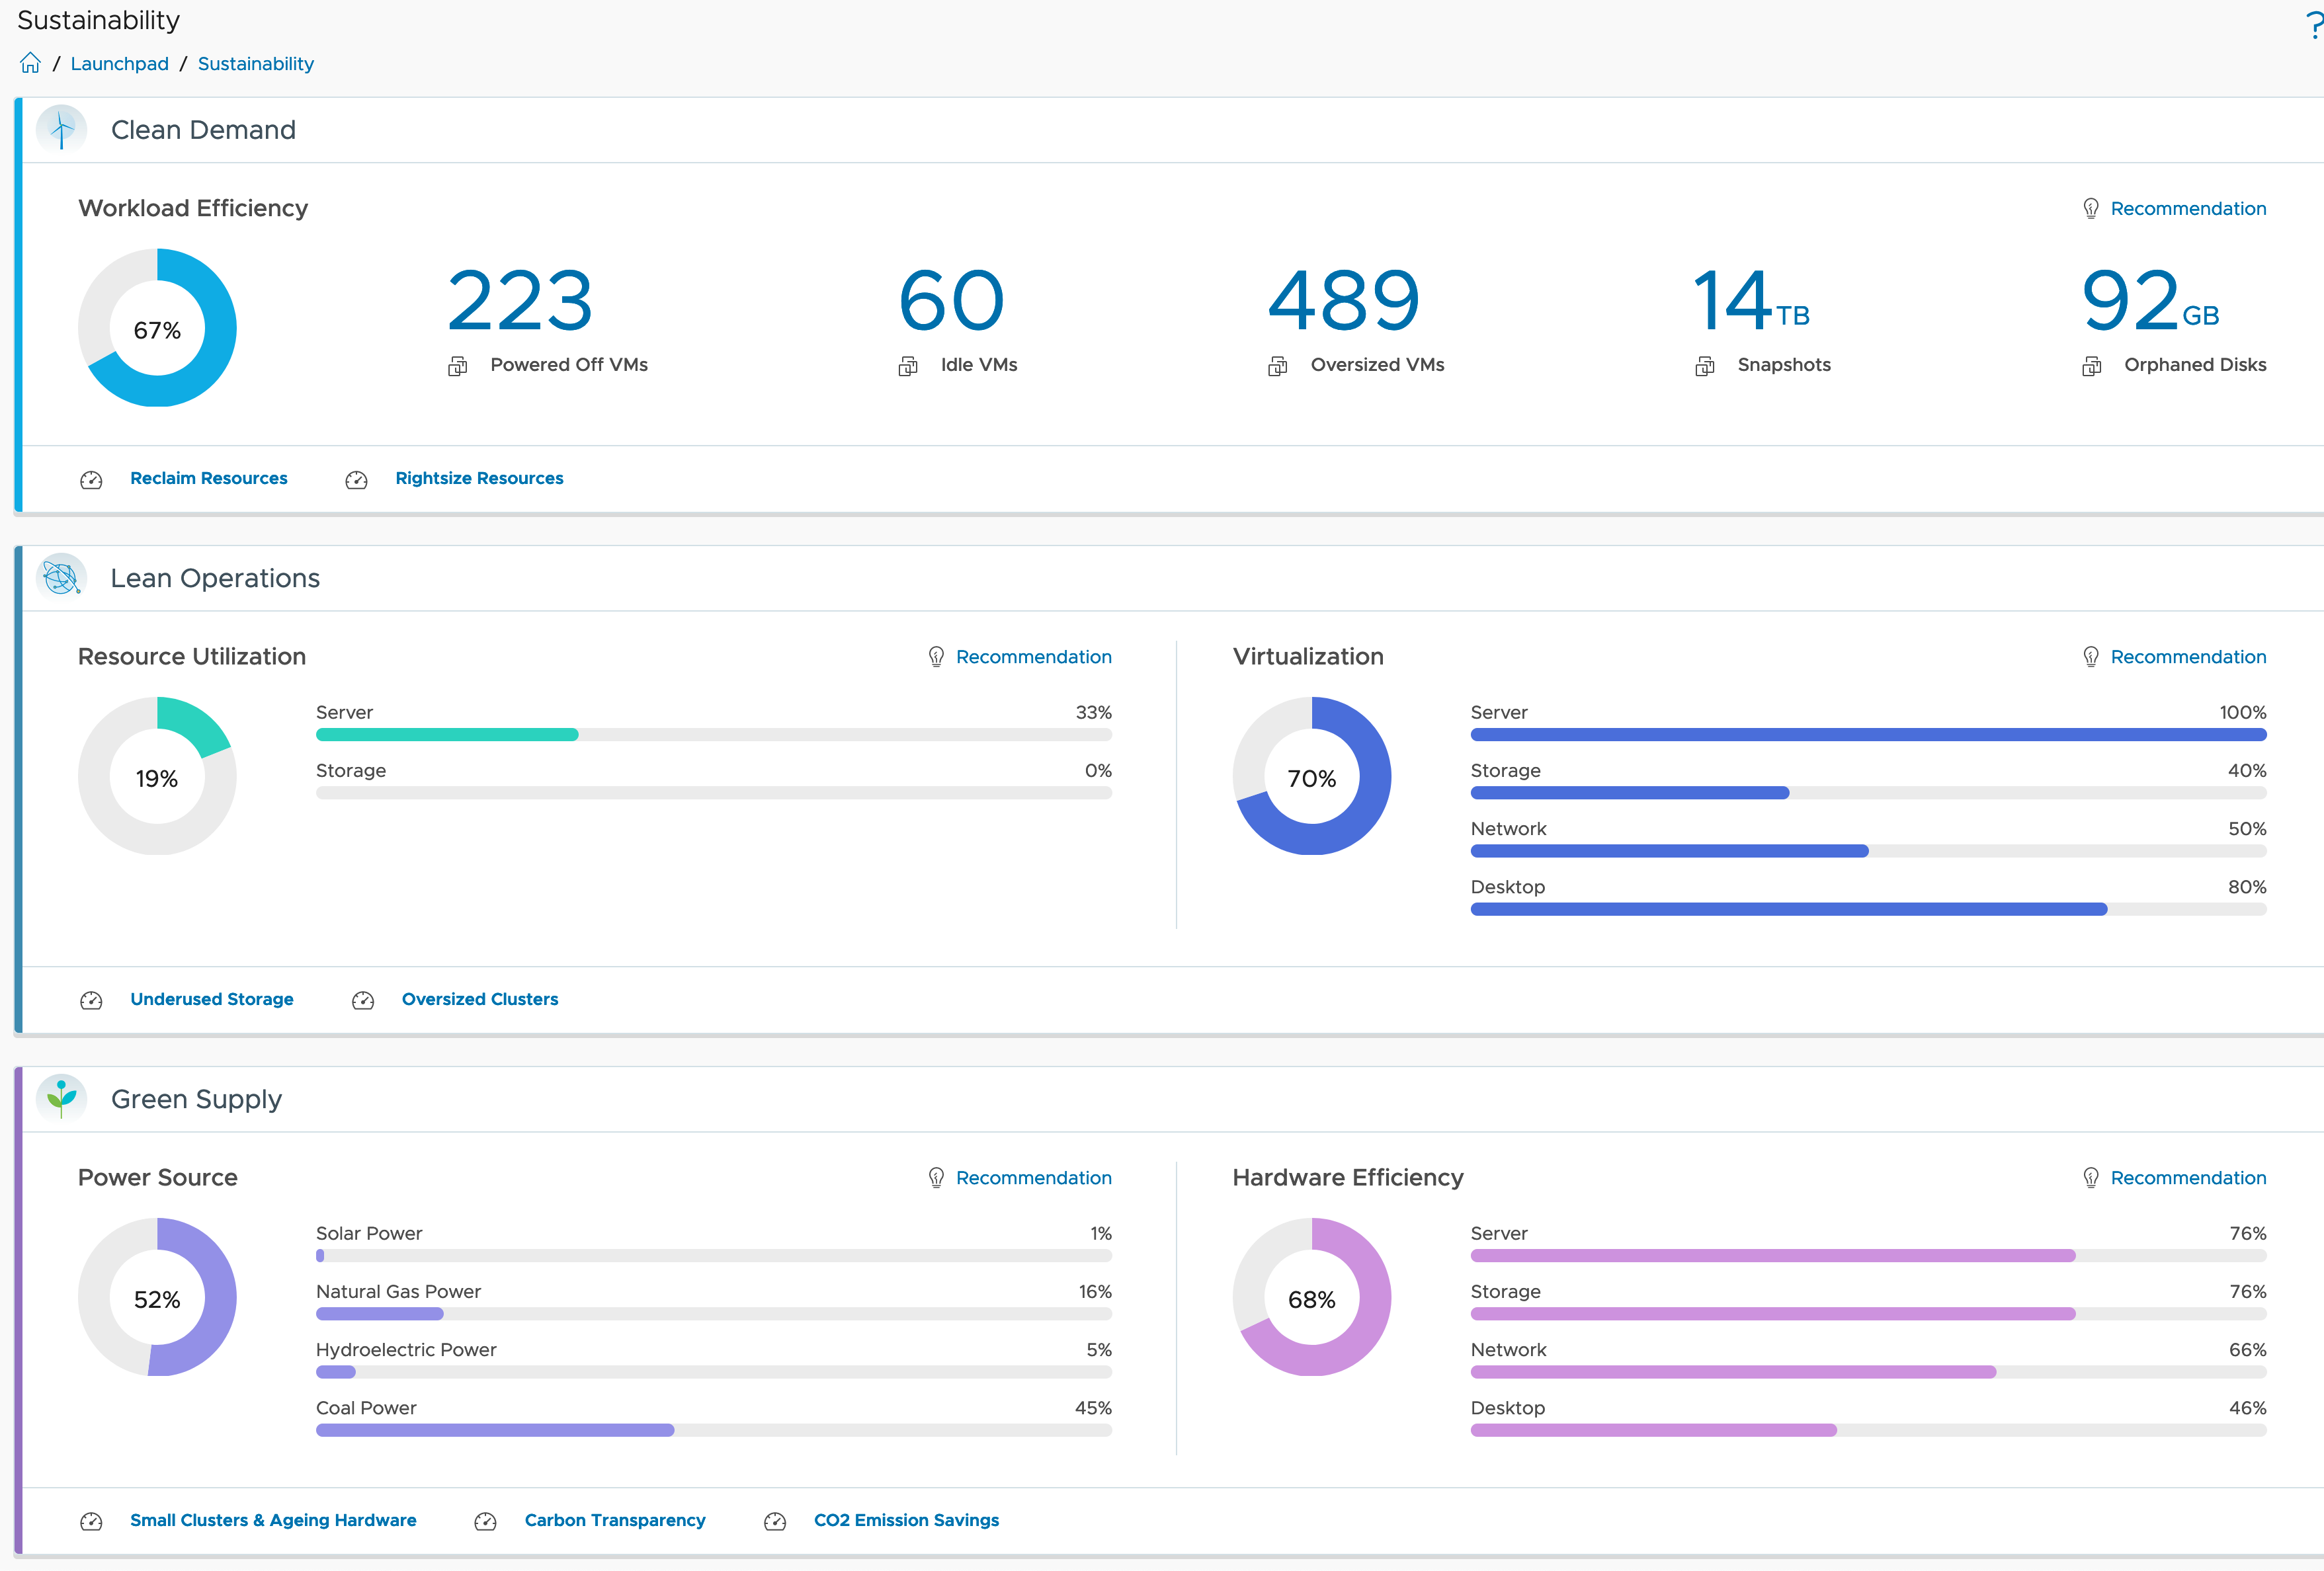
From Clean Demand overview helping find potentially unused resources (Virtual Machines, Snapshots, etc.) or not properly sized Virtual Machines, through Lean Operations focusing on provider efficiency up to Green Supply making energy consumption and carbon emissions transparent, Aria Operations offers the right tools to make the sustainability strategy a success.
Leveraging the available information many use cases can be easily implemented out-of-the-box:
- resource reclamation and rightsizing
- workload balancing
- insights into energy consumption, both at provider and at the consumer level
- insights into carbon emissions
- insights into energy costs
Use cases not possible OOTB
Even if the requirements and use cases are basically always the same, they usually differ in detail. And of course, these details cannot all be mapped as features in the product.
On the other hand, VMware Aria Operations offers excellent options for expanding the feature set without waiting for a new version and thus being able to address practically all use cases.
One of such use cases was:
- I need to see the power usage of my vSphere Clusters in this month, from the beginning of the month up to today – Month To Date or MTD values
- I want to see the energy costs of my vSphere Clusters as MTD value
- I want to display my current Power Usage Effectiveness (PUE) value in VMware Aria Operations
Prior to the possible solution, the next two paragraphs will give you a quick overview of the VMware Aria Operations functionalities building the foundation of my concept.
VMware Aria Operations REST API
The very well described Aria Operations REST API is probably the best way to extend functionality almost infinitely. In the end, Aria Operations is a data lake with many many methods and algorithms to generate helpful insights from raw data.
Every Aria Operations instance, SaaS as well as on-premises, provides a Swagger UI which makes it really easy to get familiar with the very extensive REST API. You can access the Swagger you by simply navigating to:
https://www.mgmt.cloud.vmware.com/vrops-cloud/suite-api
or
https://$localurl/suite-api

In my concept I will use few of the Resource and Resources methods to gather information, calculate and add new data to existing objects in Aria Operations.
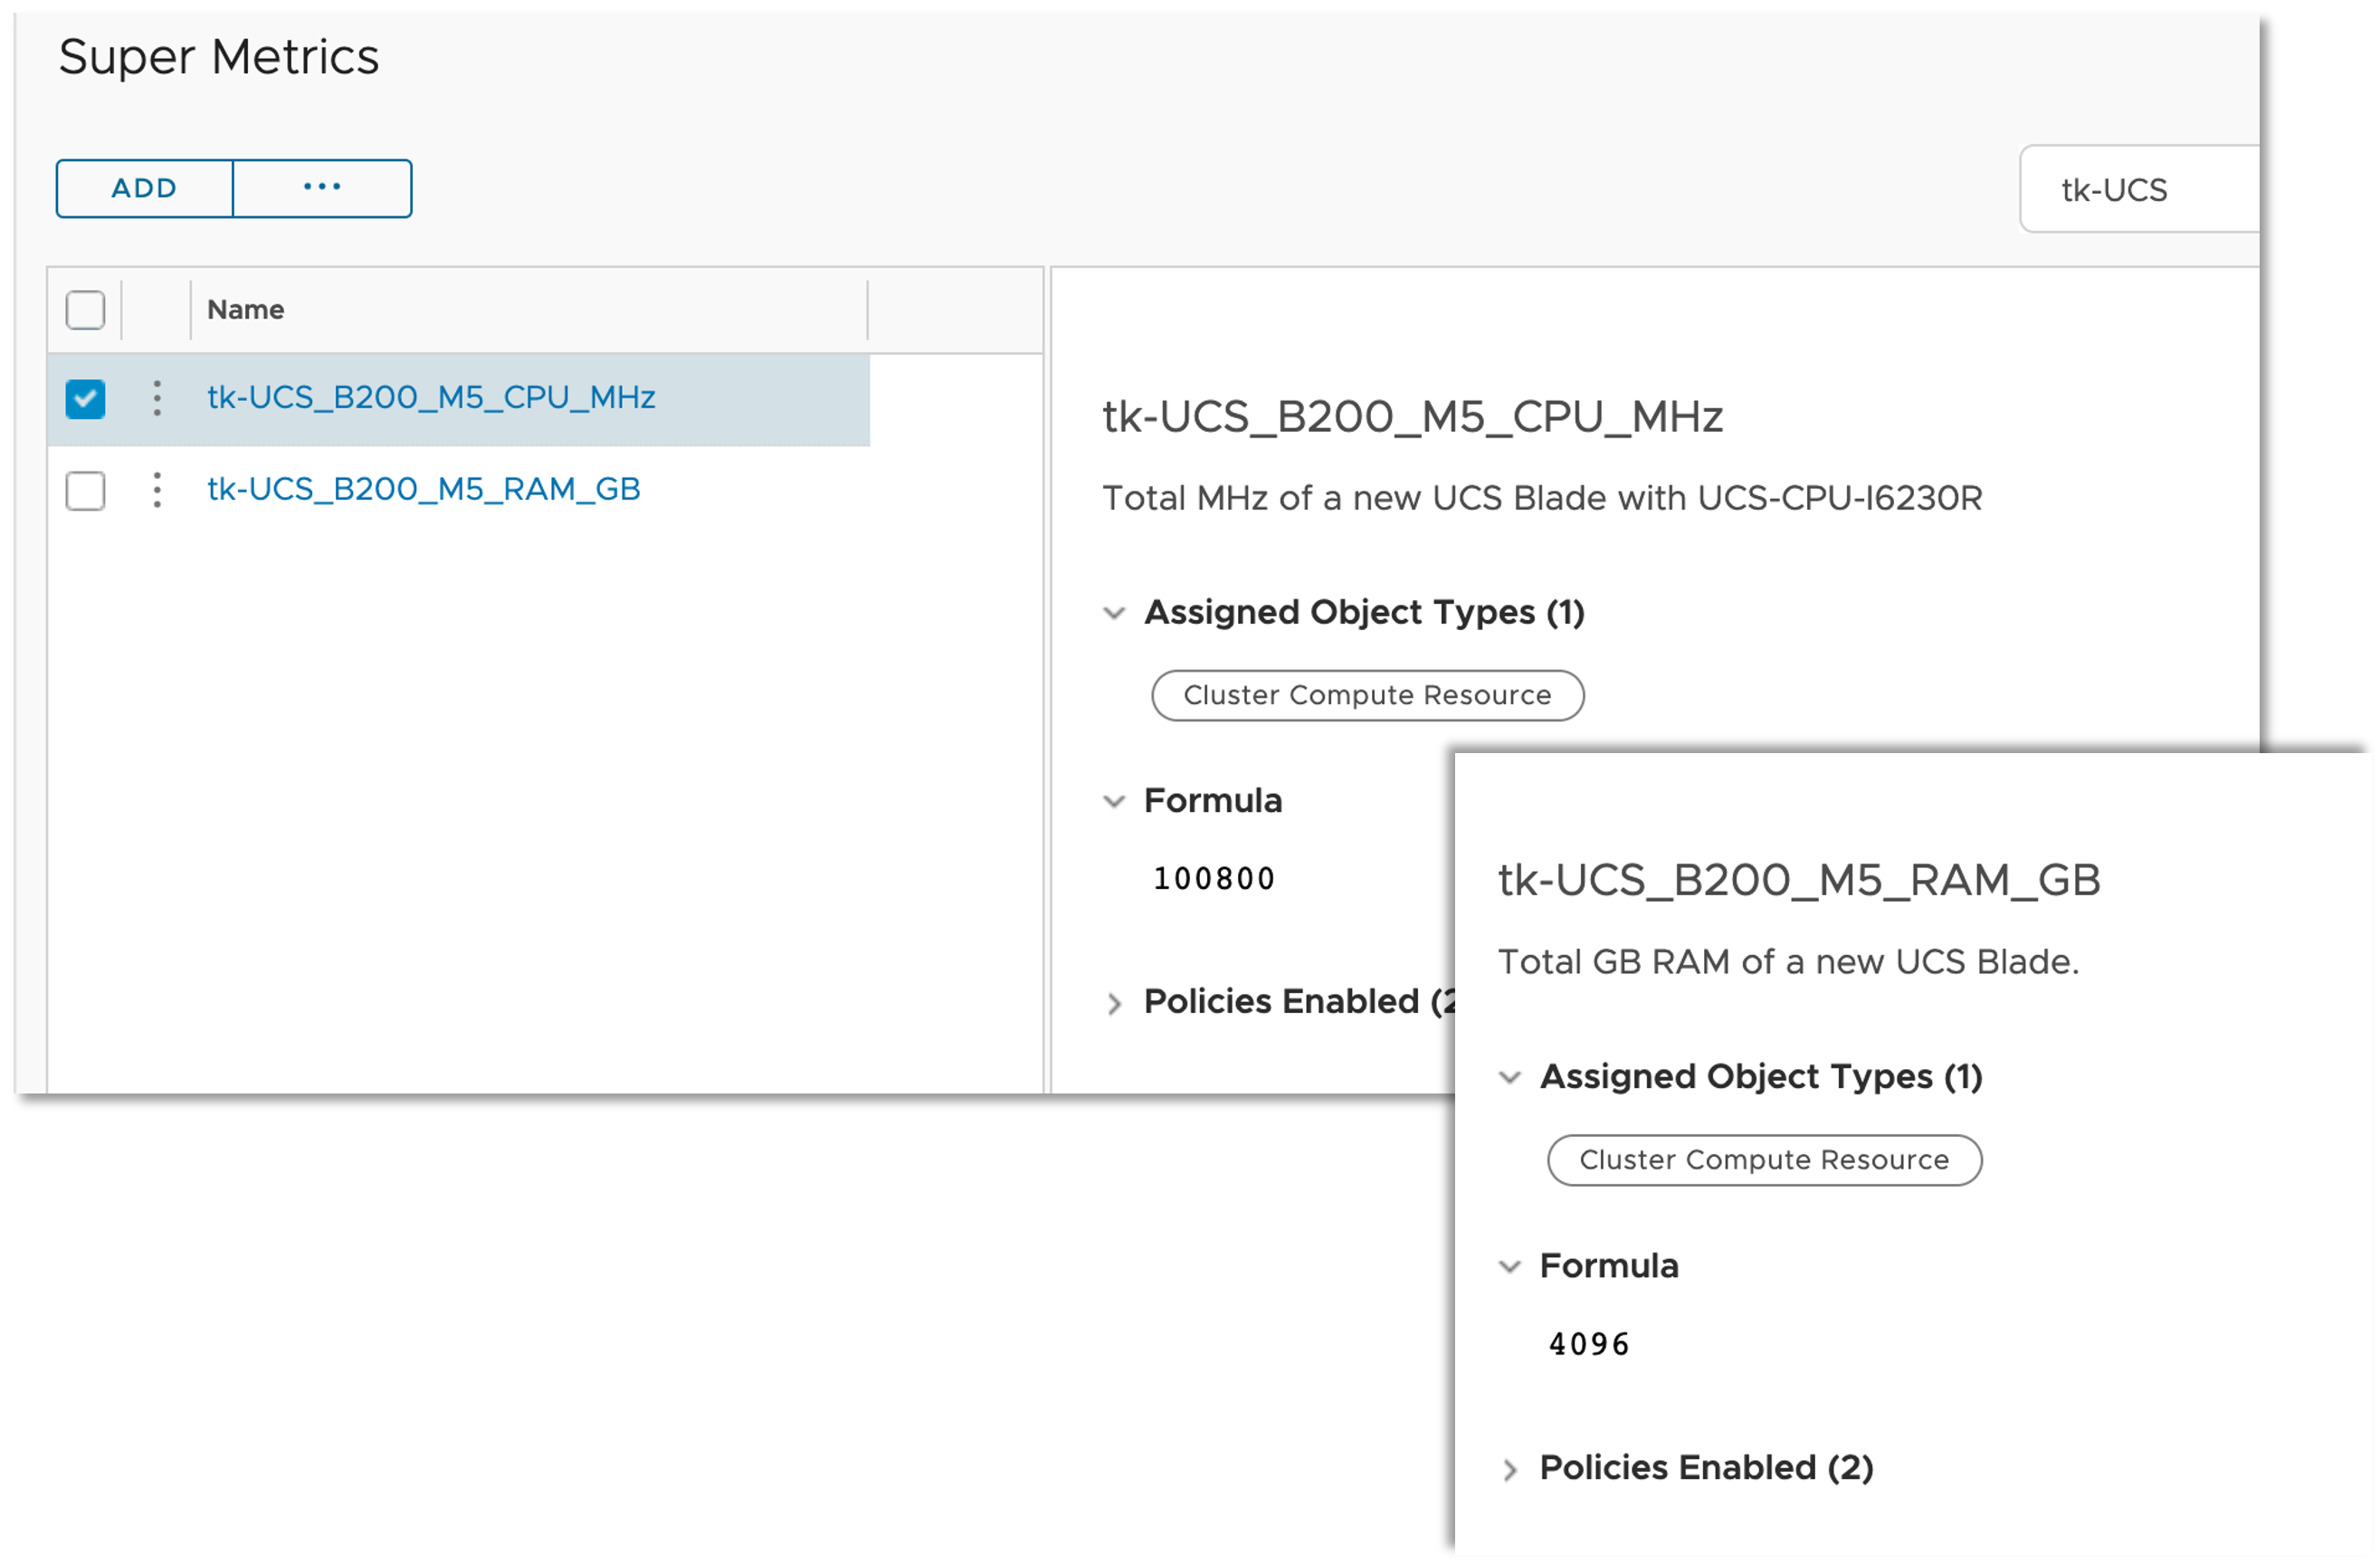
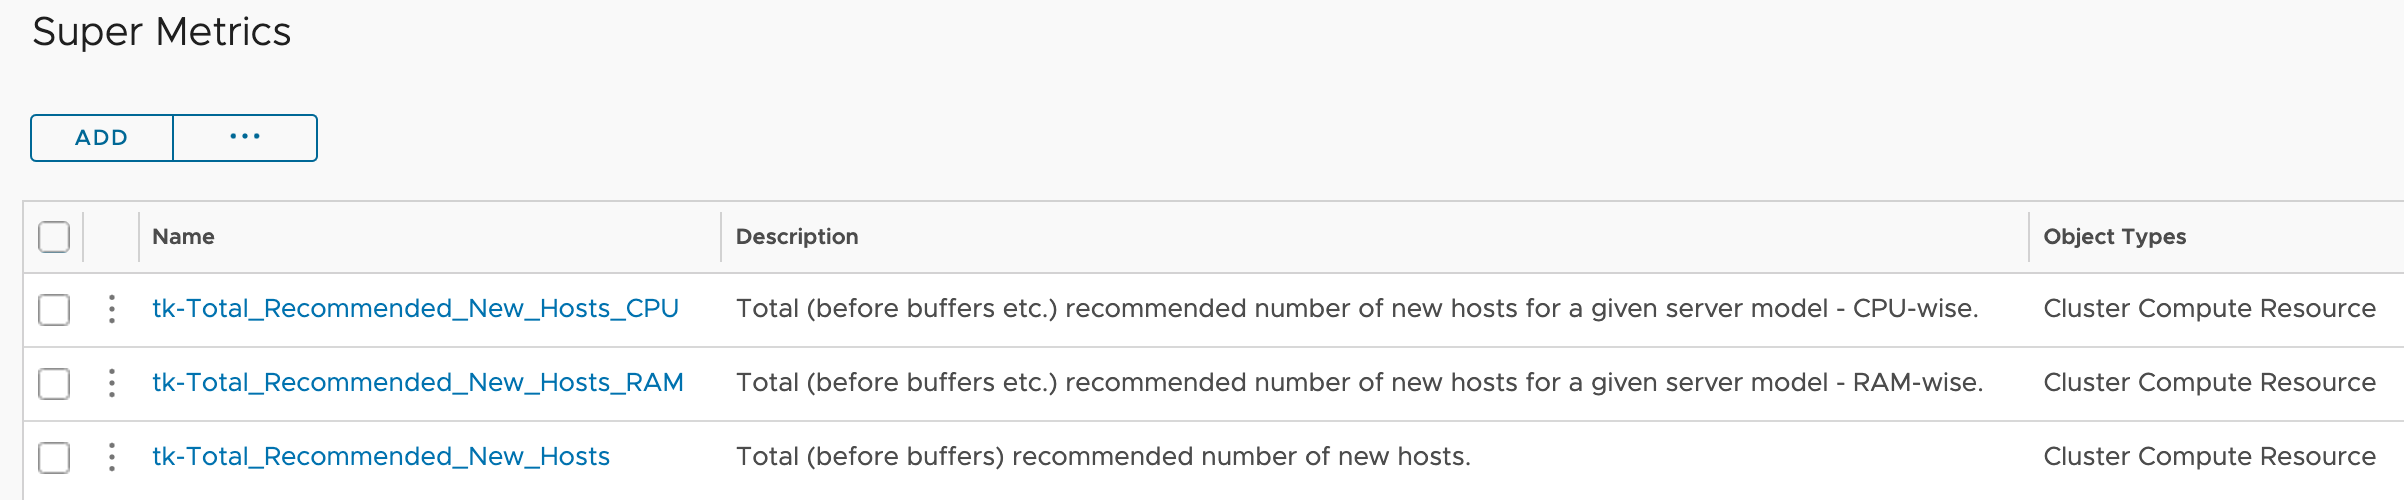
VMware Aria Operations Super Metrics
Sometimes the task is to determine new metrics based on already known metrics or properties. You often don’t even have to resort to programmatic approaches, the VMware Aria Operations Super Metrics provide almost everything to generate new information from existing data with little effort.
Super Metrics are another part of my concept and if you would like to learn how to create your own Super Metrics, please go and check out my video series here:
The Concept
To stay focused on the objectives, here again the requirements:
- I need to see the power usage of my vSphere Clusters in this month, from the beginning of the month up to today – Month To Date or MTD values
- I want to see the energy costs of my vSphere Clusters as MTD value
- I want to display my current Power Usage Effectiveness (PUE) value in VMware Aria Operations (still WiP)
Based on the requirements, here is the data or metrics I need in Aria Operations:
- MTD value – how many seconds or minutes or hours since the beginning of the current month
- power consumption of my ESXi hosts per hour (or minute etc.)
- current price of energy for any of my ESXi hosts (might be different per host)
- the total energy consumption of my data center(s) (facility including cooling, lighting etc.)
Using this information I can finally calculate the data requested in the use cases. The overall process in my concept is depicted in the following figure (I have removed the login operations for better visibility).

Let’s start with the easiest part – the energy price.
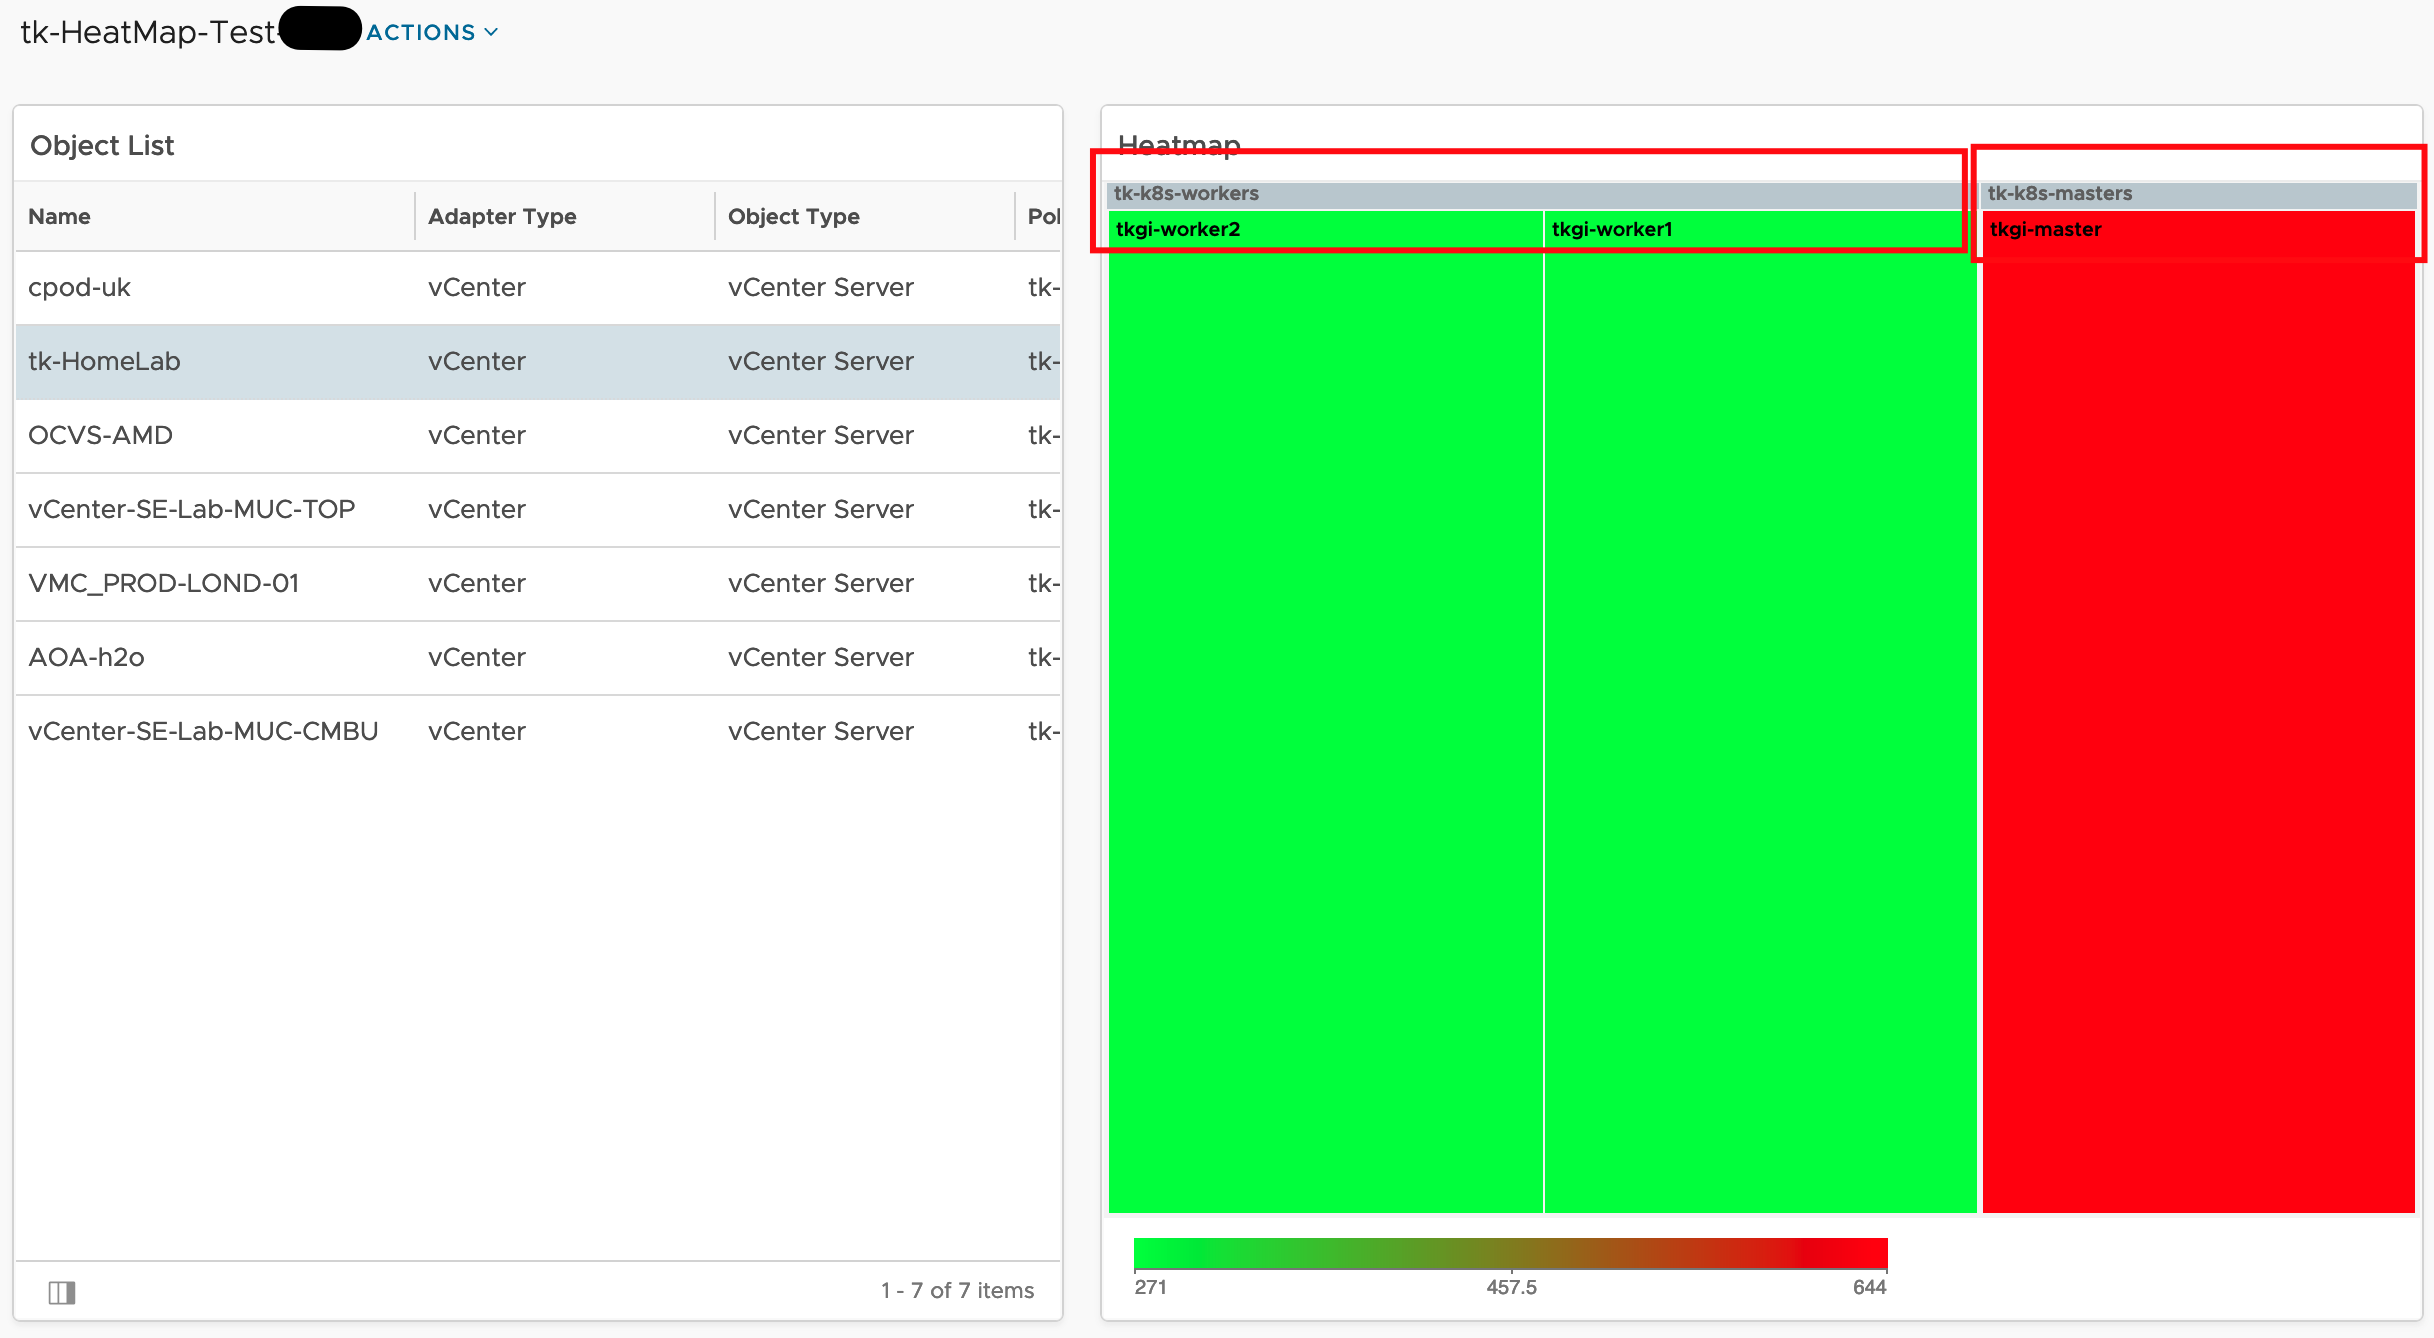
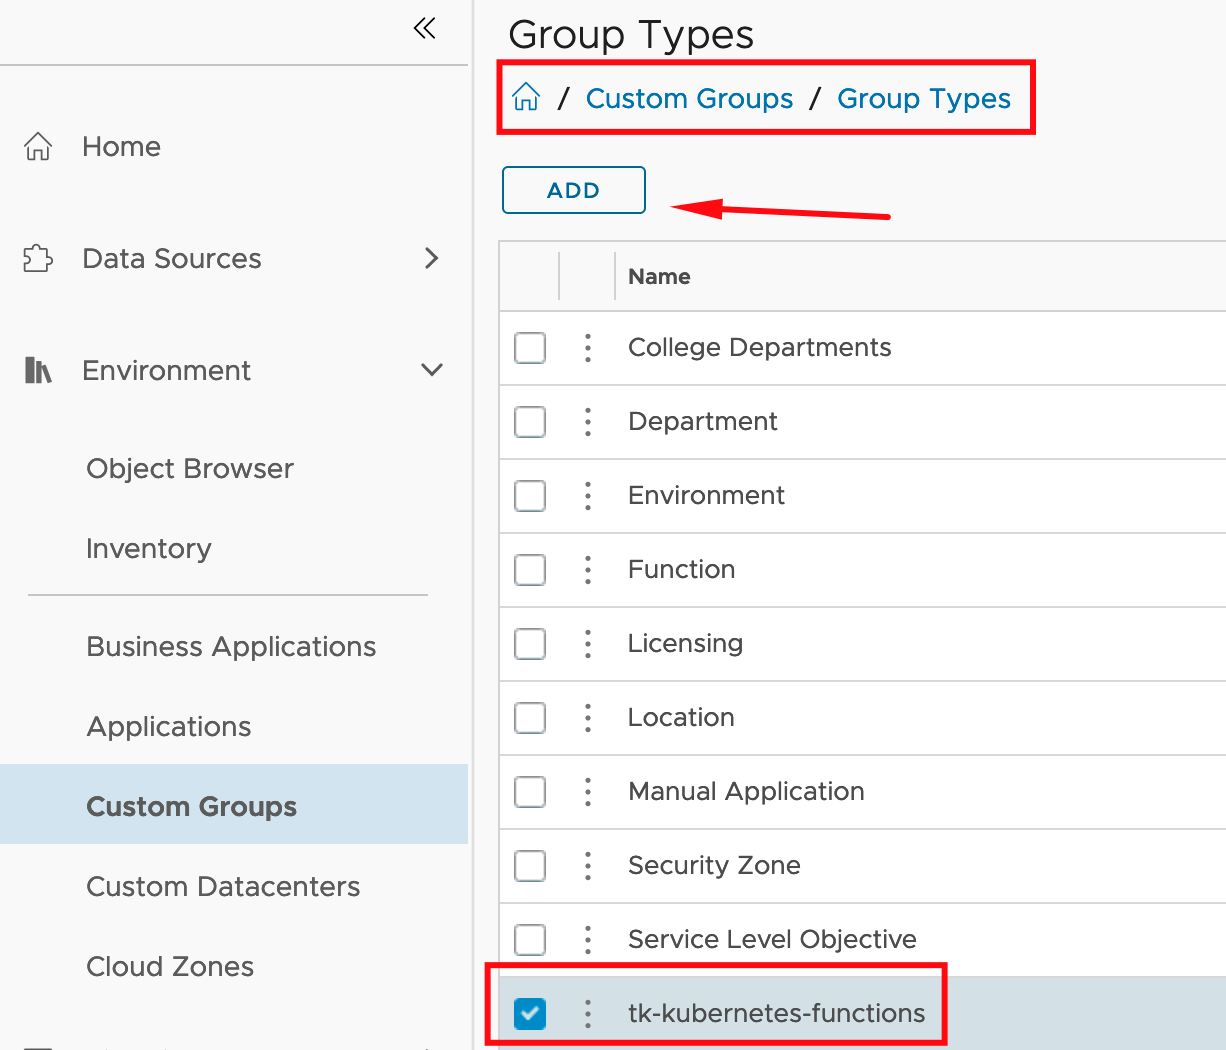
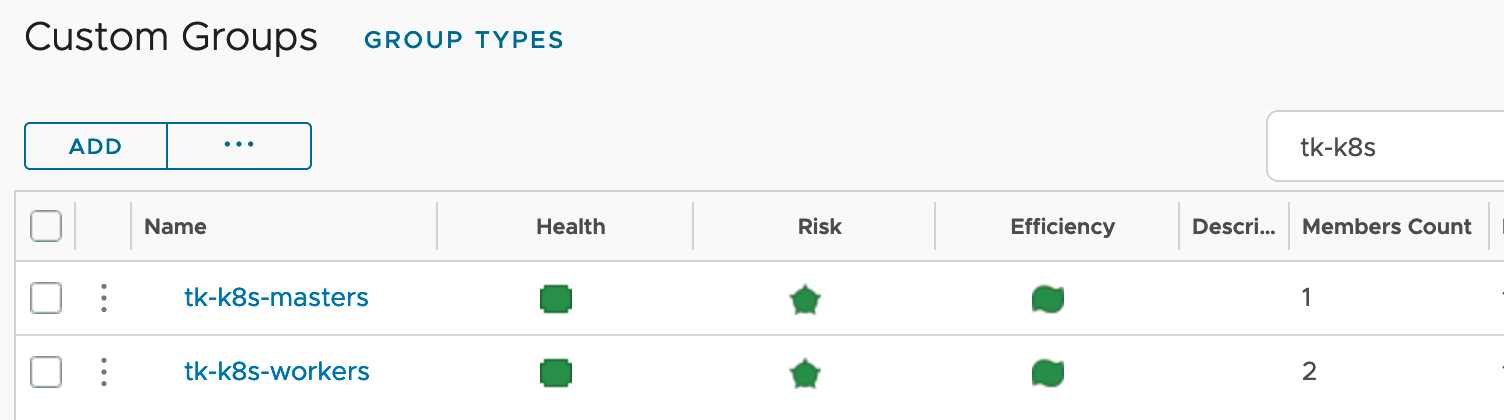
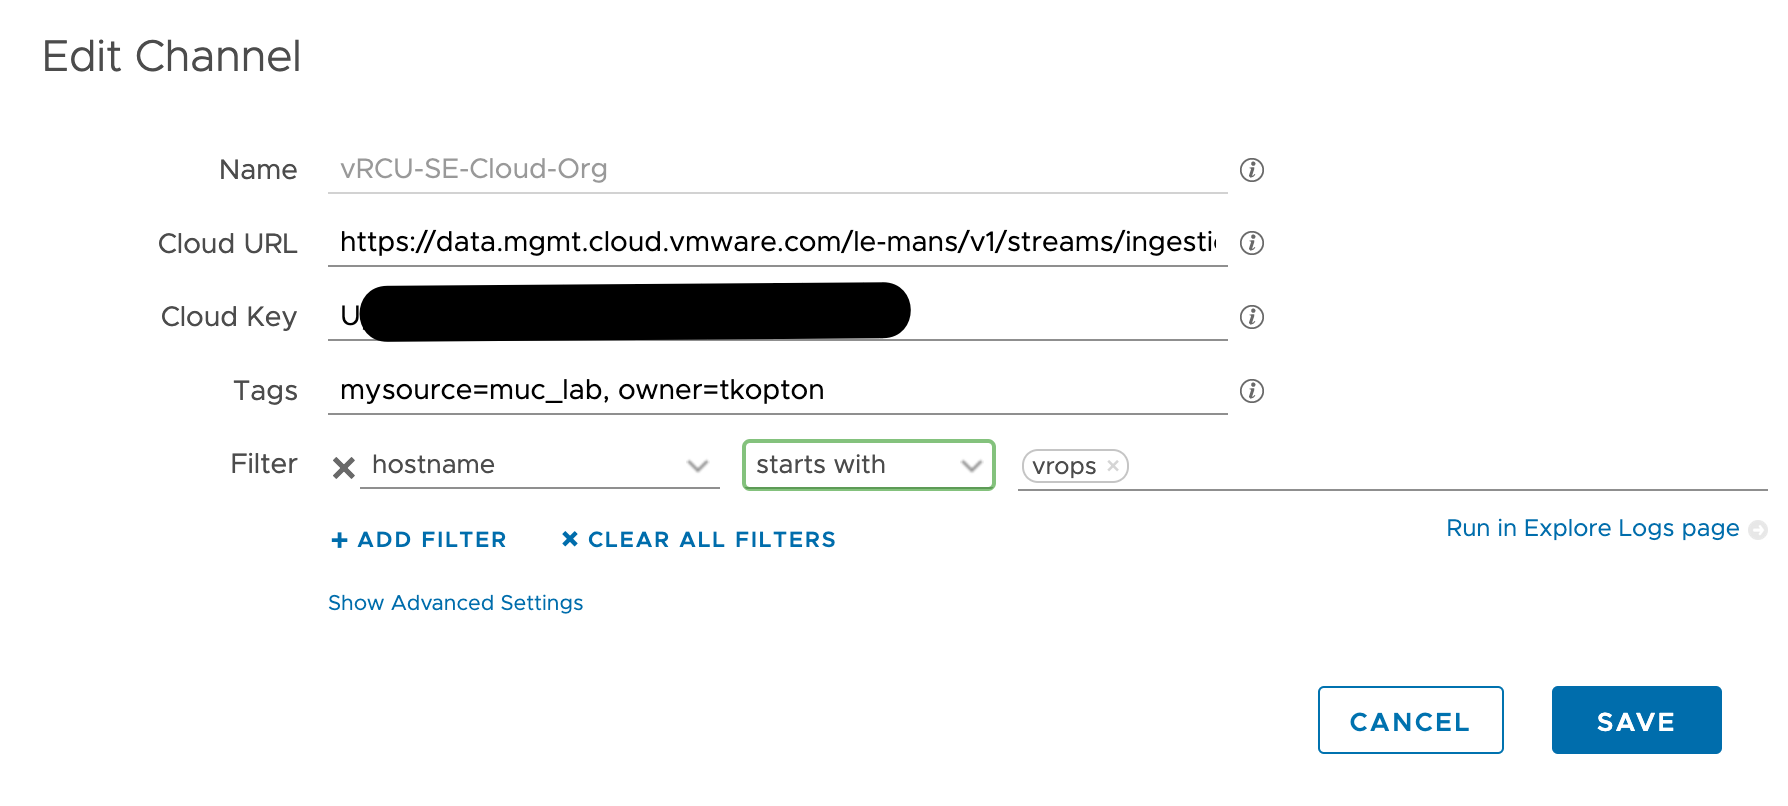
The are different approaches on how to add this data to Aria Operations. I have decided to use the Custom Group construct to organize my clusters and add automatically add a new custom property, Electricity Rate.
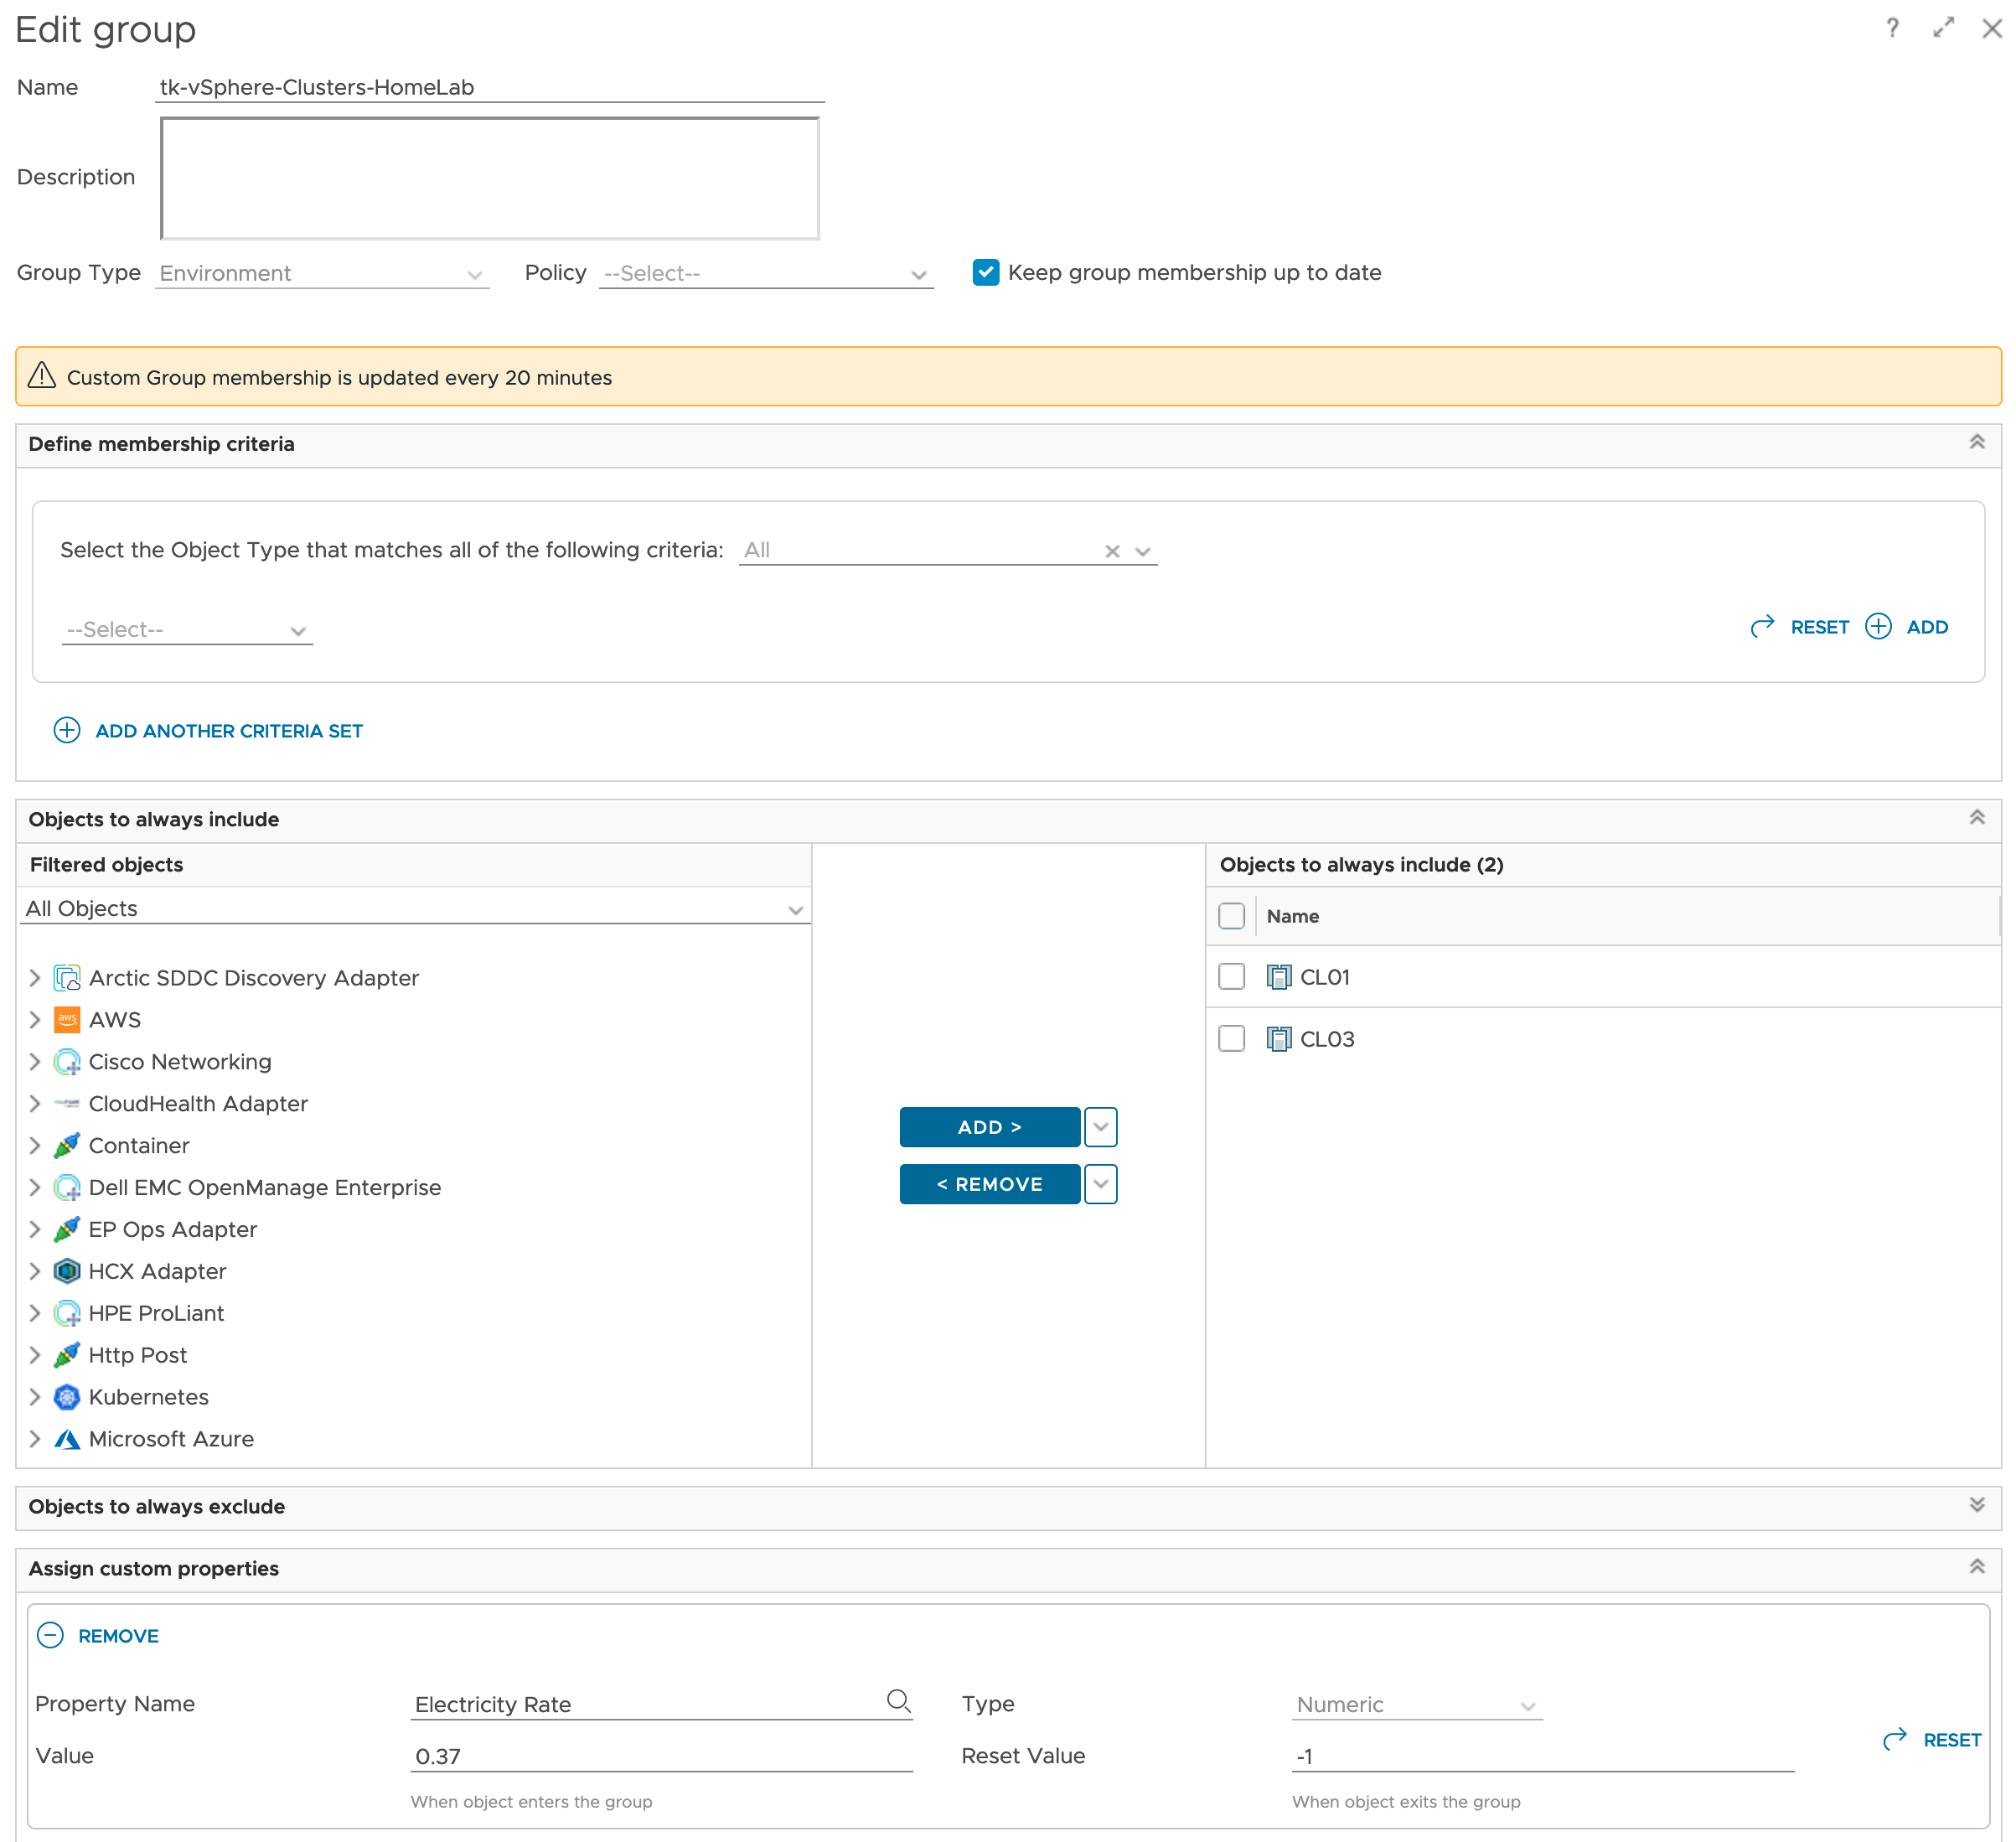
If using different energy prices for different ESXi hosts within one cluster is a constraint, the same method can be used to add the energy rate as custom property to every single ESXi host system. This value at the host level will make it easier to calculate MTD energy costs for every single ESXi system.
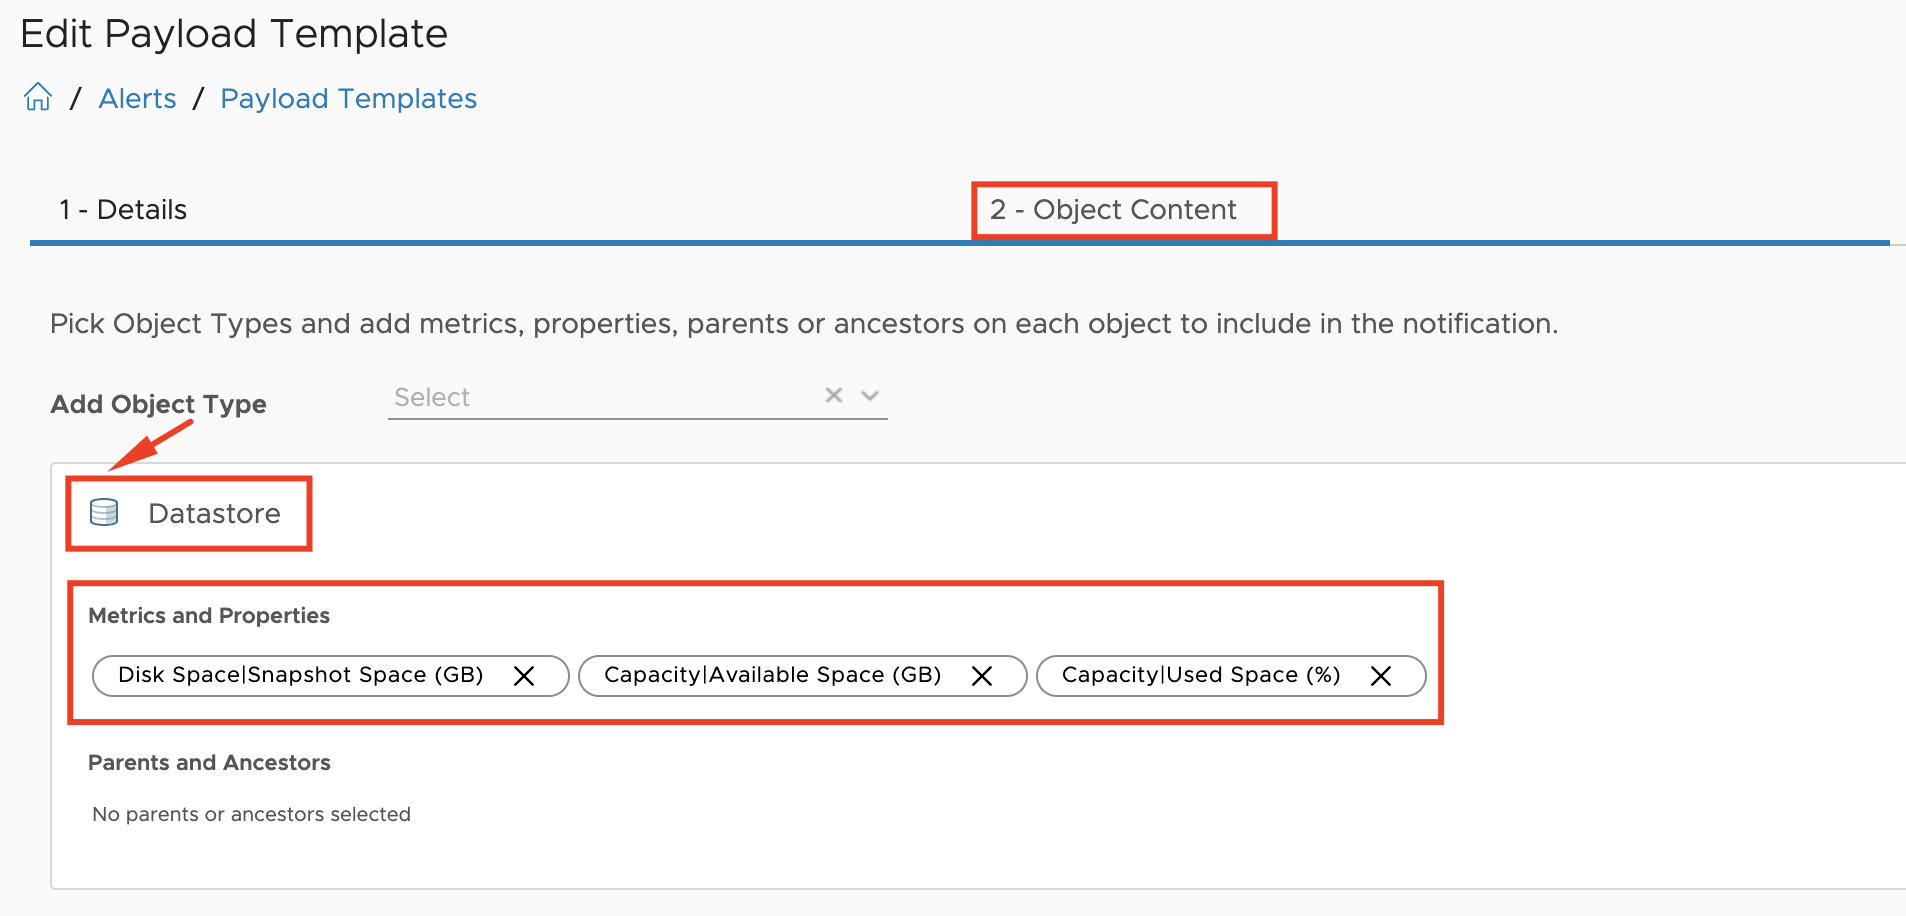
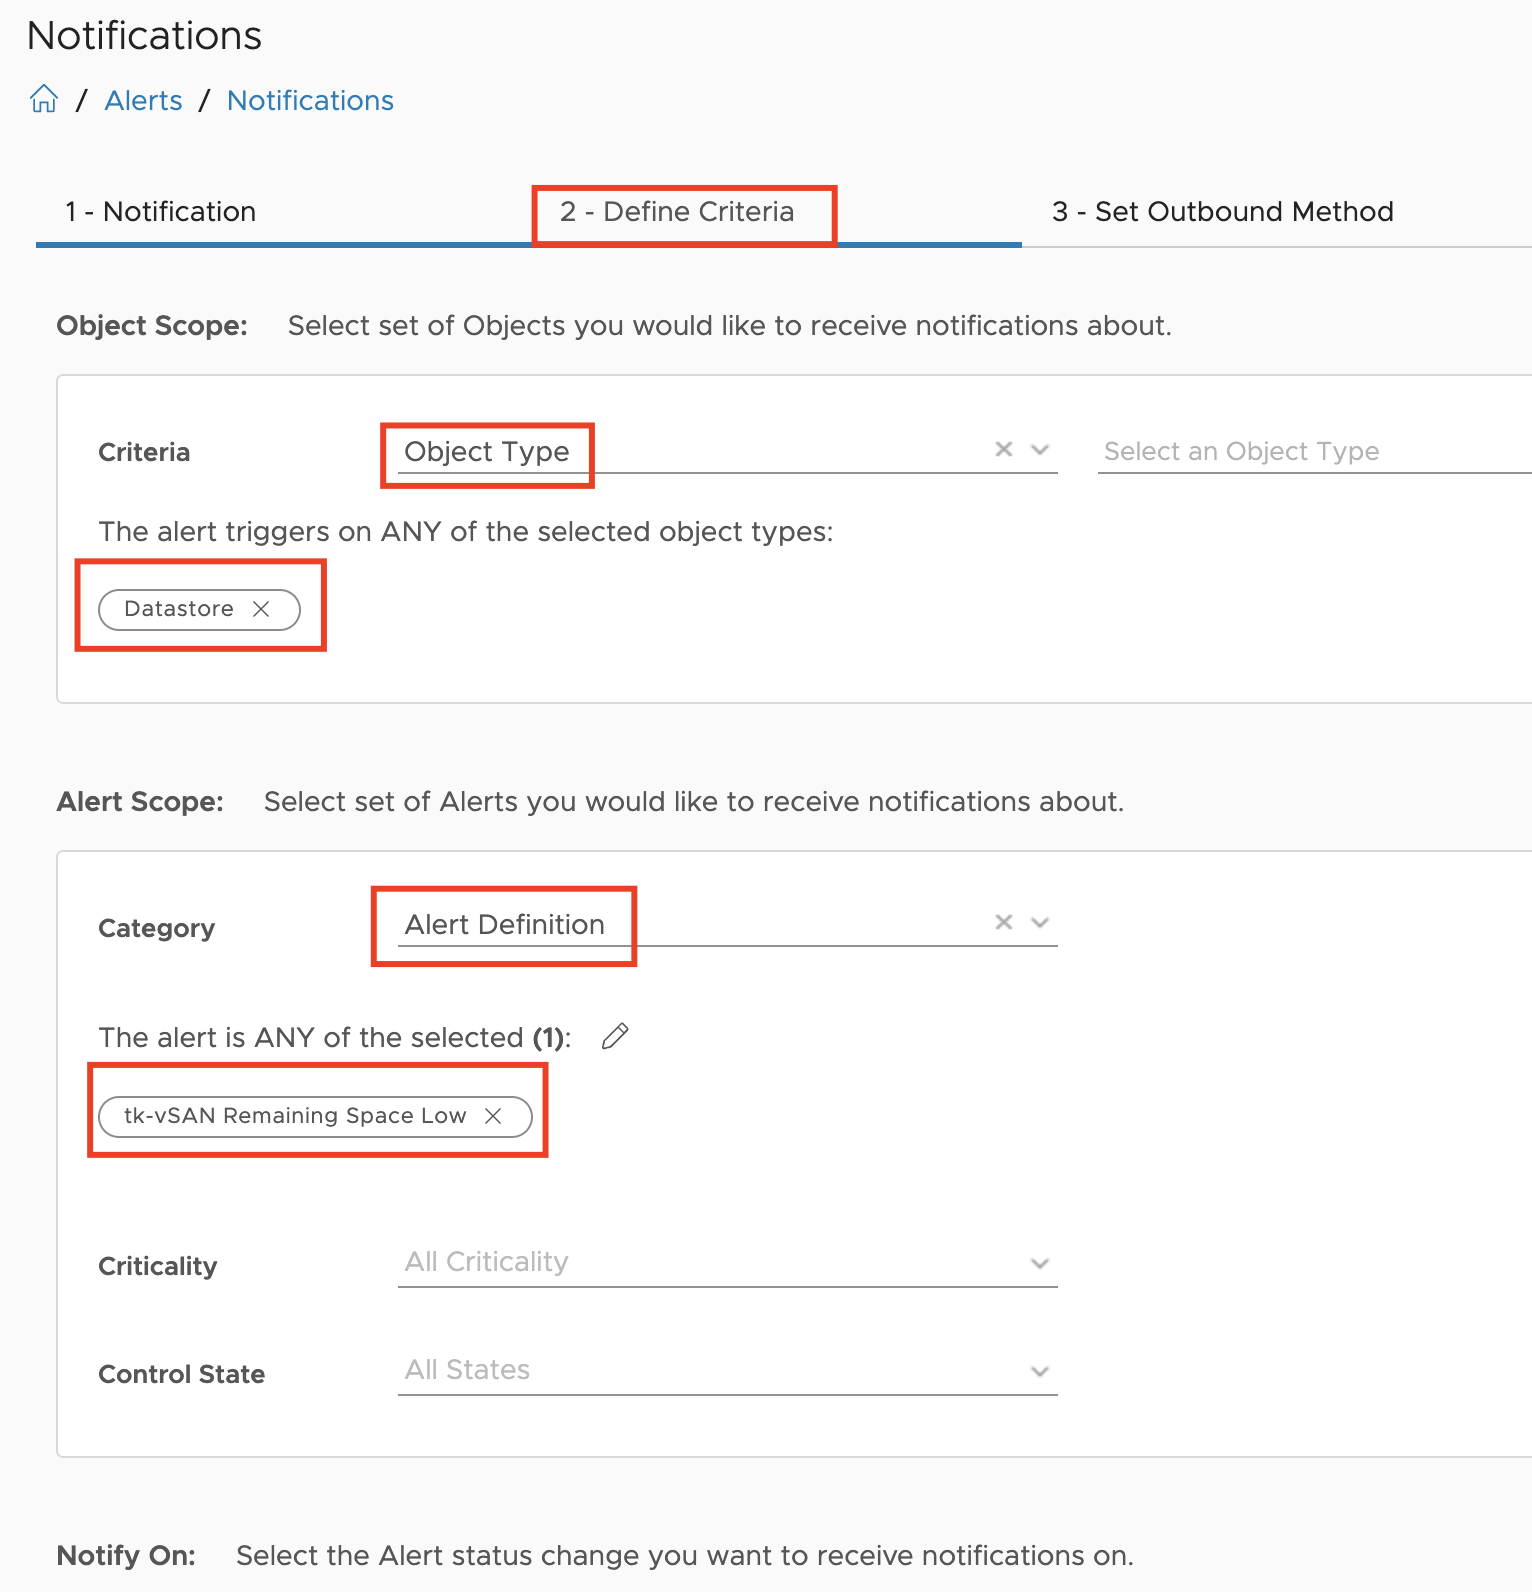
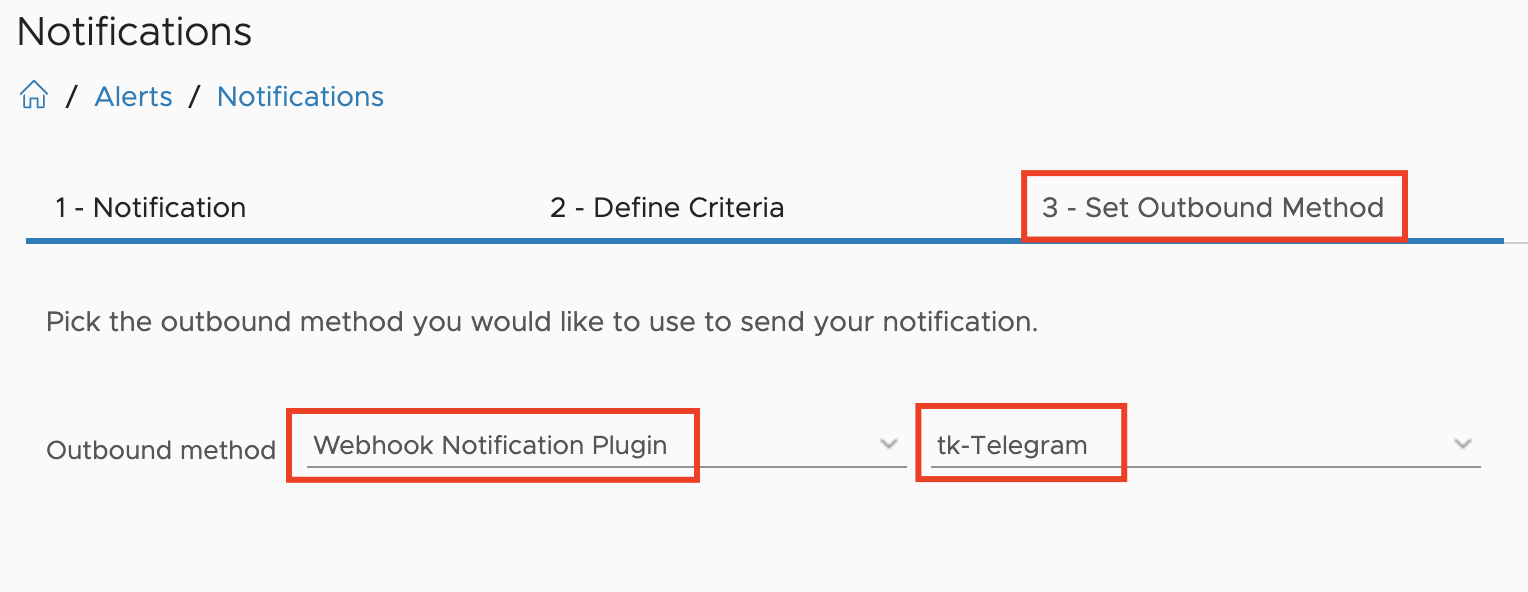
The next step, slightly more complex, is the calculation of the MTD energy consumption for every Host System object which is having the necessary power metrics, and pushing this new value back to Aria Operations as custom metric. The next picture shows the Aria Automation Orchestrator workflows I have created to accomplish this task.
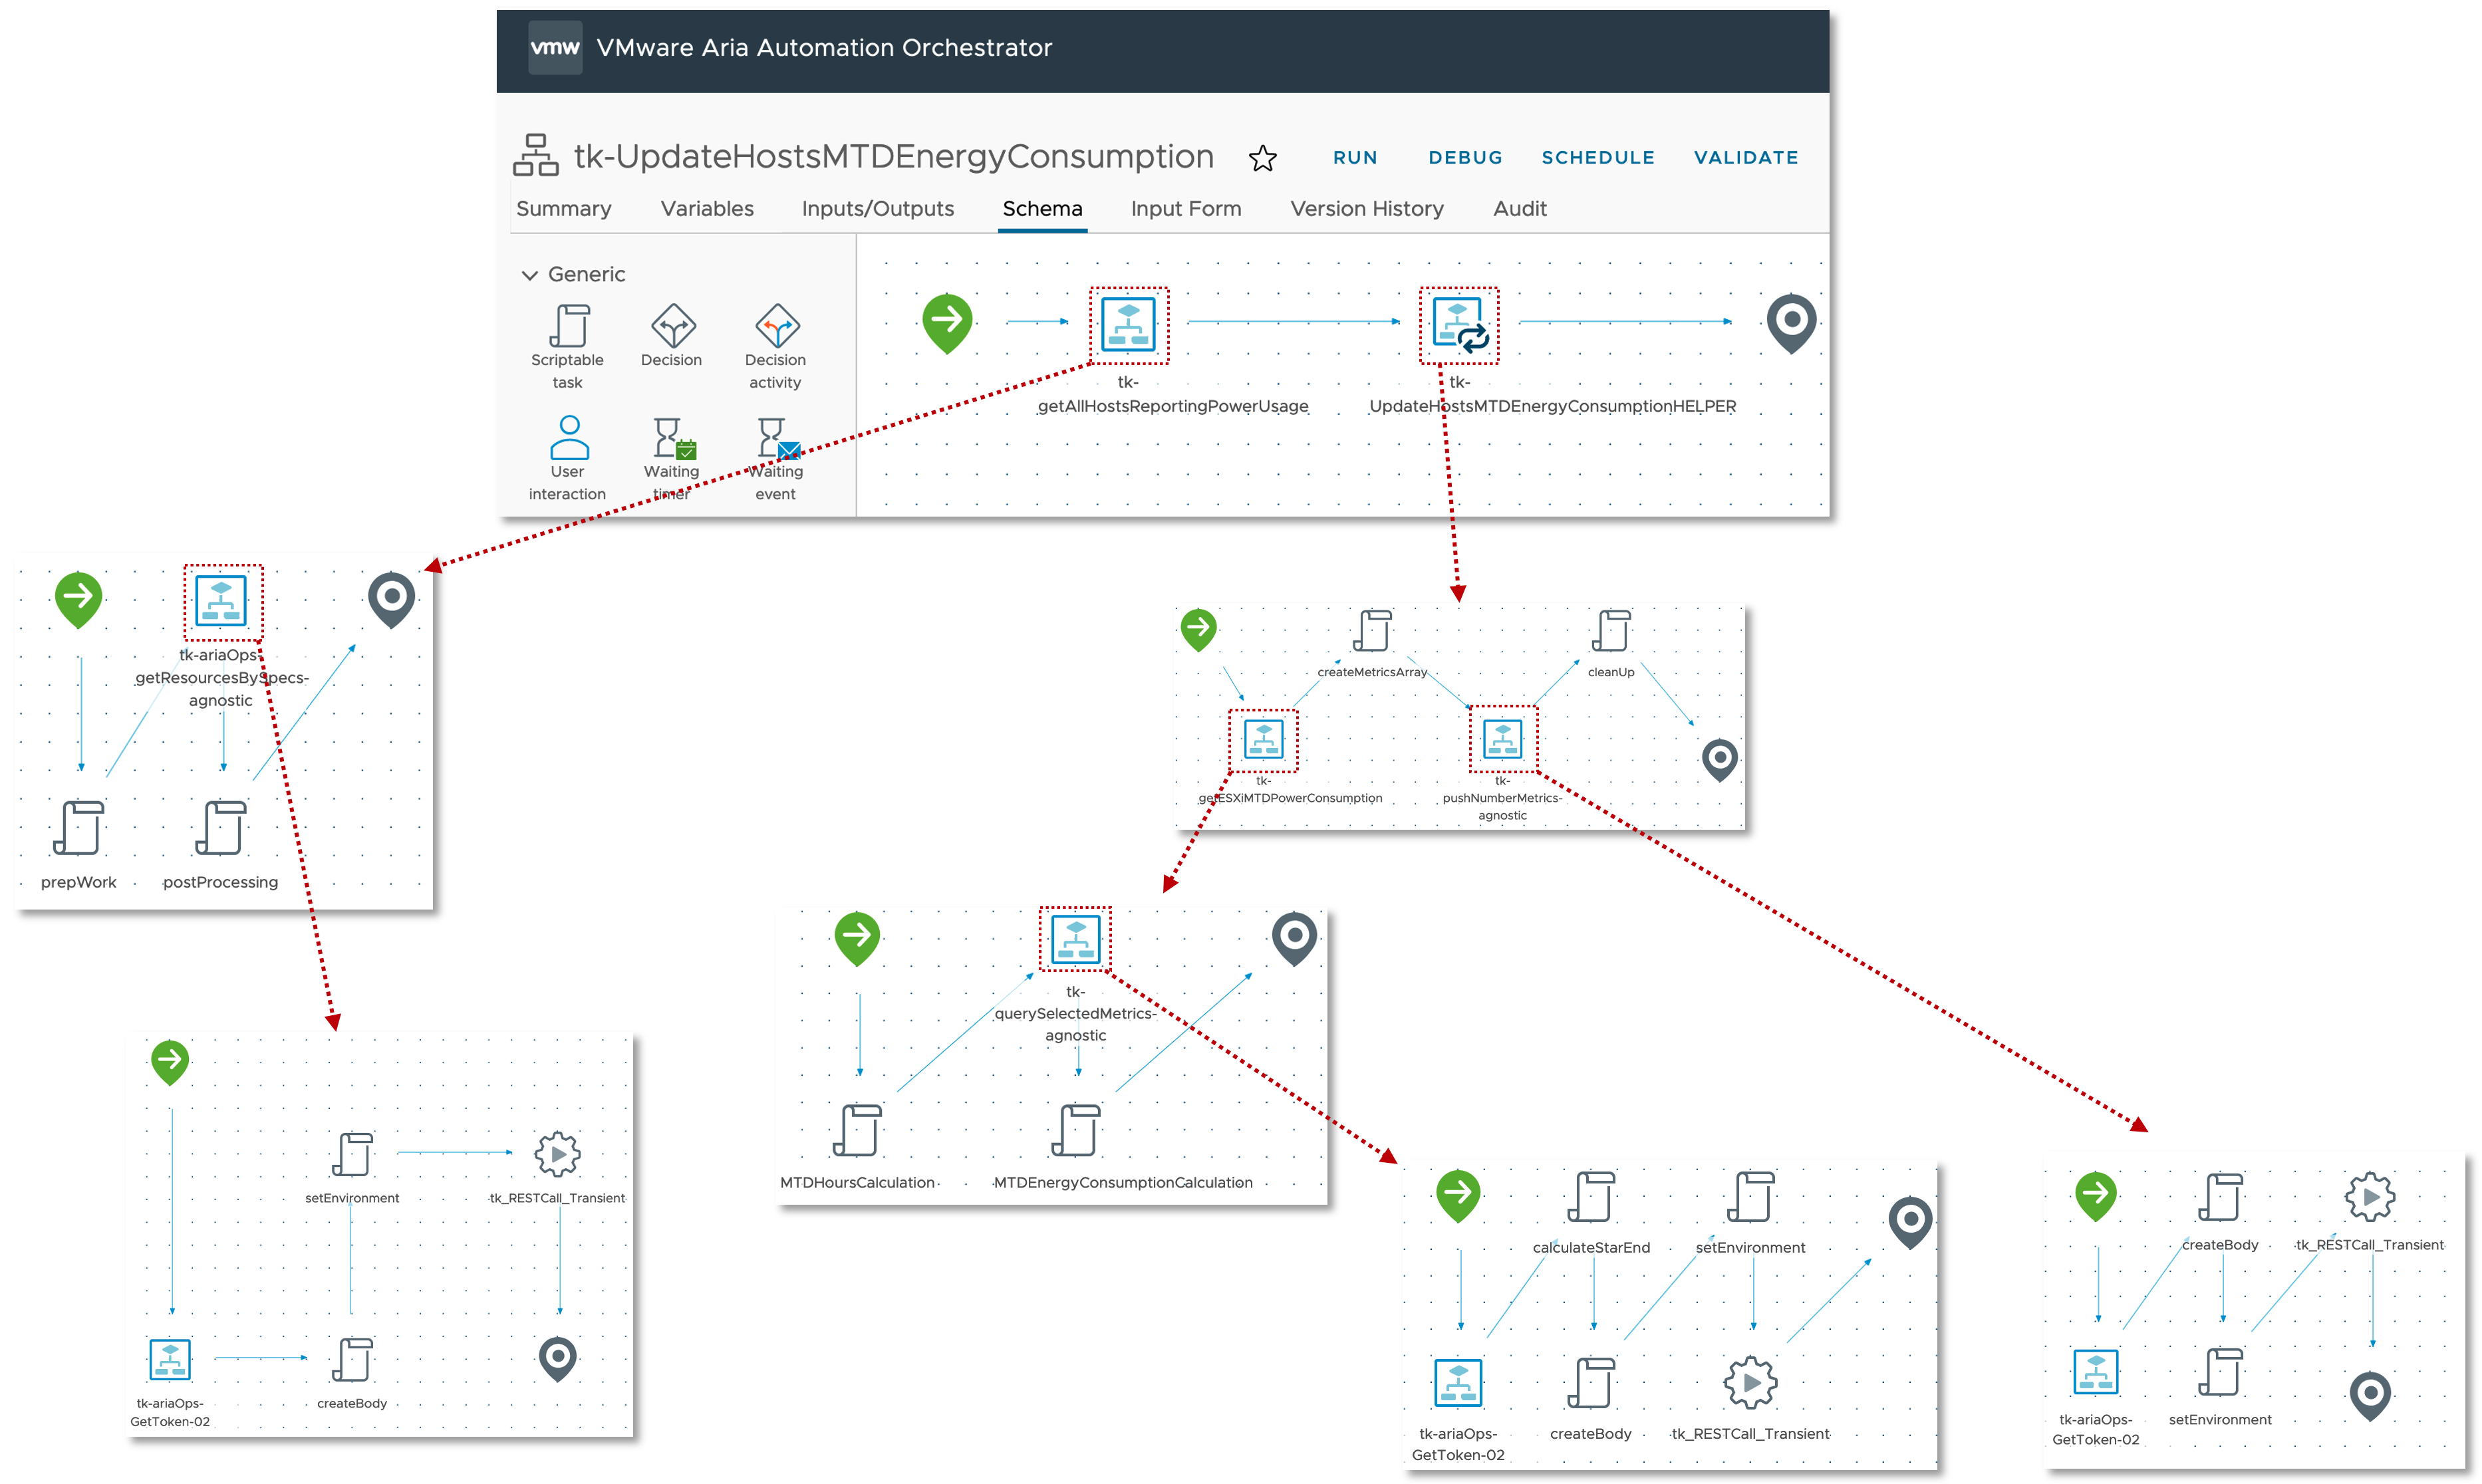
At the first glance this workflow may appear very confusing but there is an own concept behind this approach. The idea is to have a Aria Operations Automation Framework, re-usable building-blocks you stich together and implement new requirements. All workflows, actions, Super Metrics etc. will be available via VMware Code and my GitHub page. You will find all details at the end of this blog post.
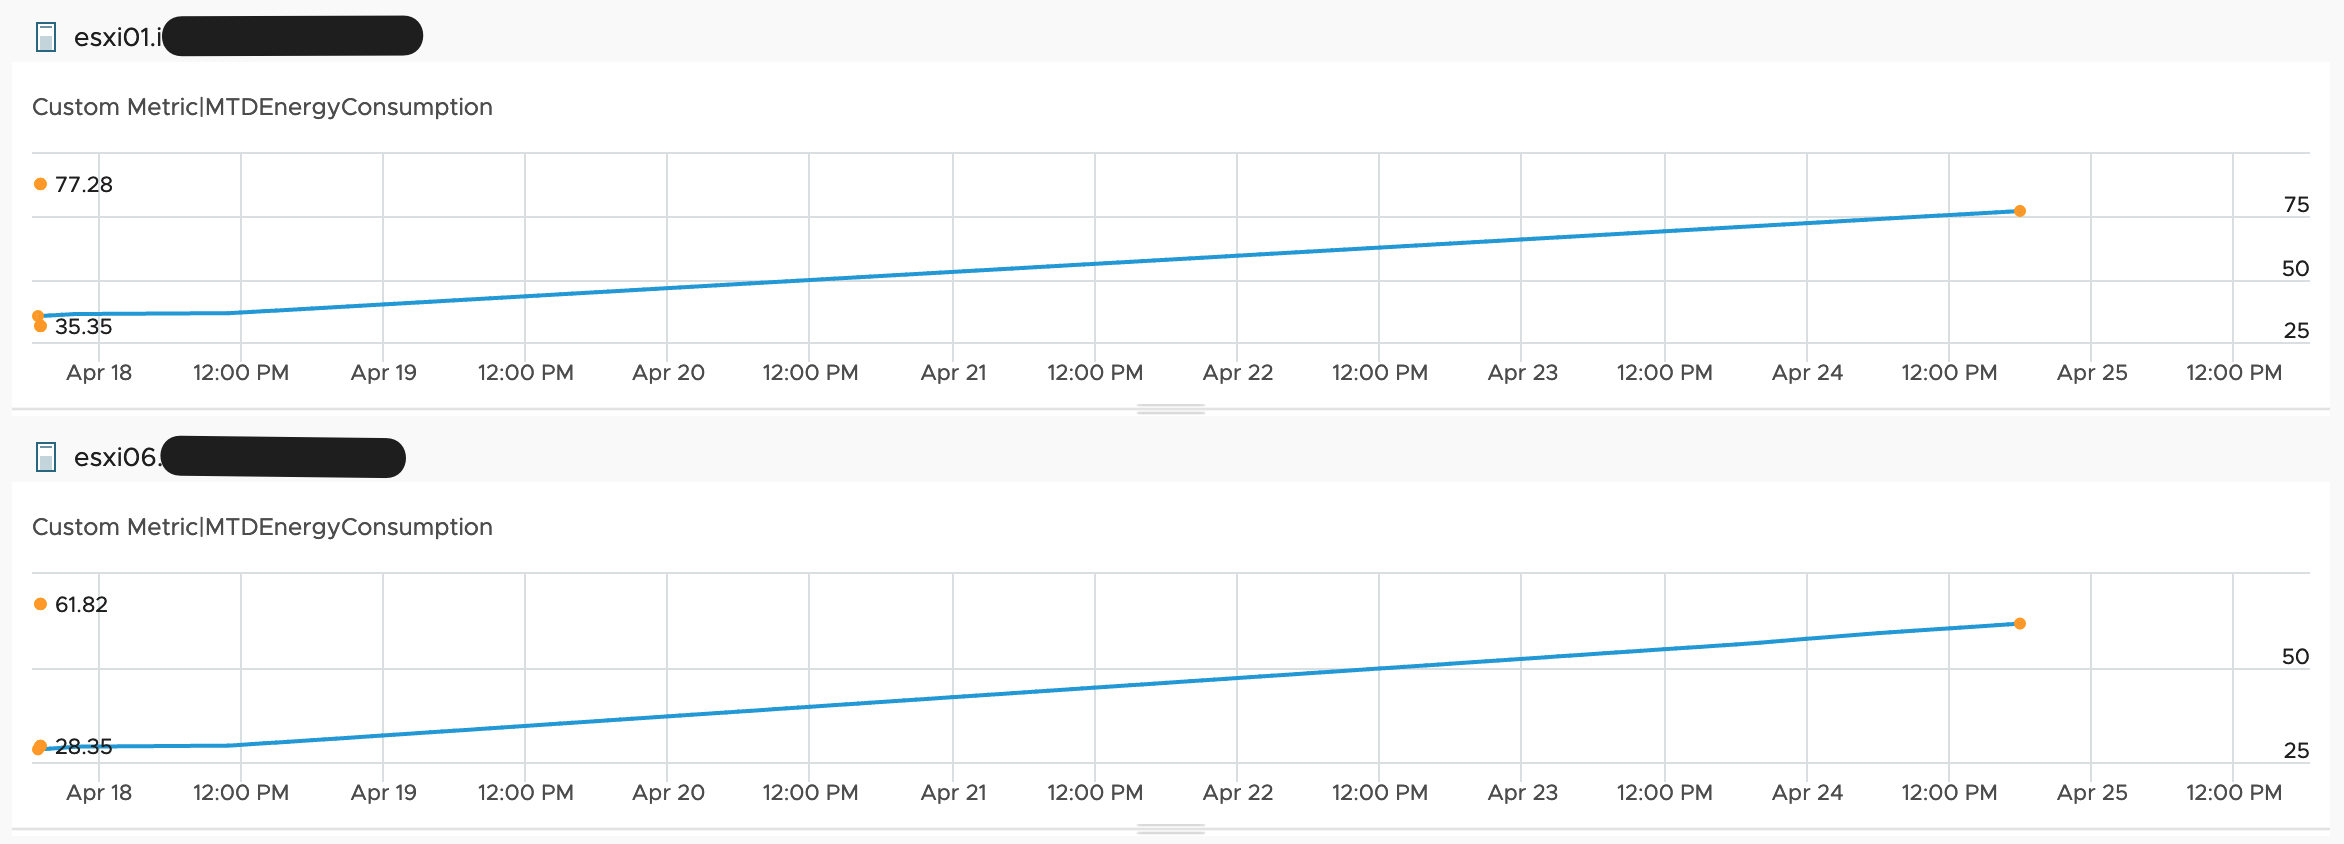
This workflow runs every hour and pushes the values to Aria Operations. The next picture shows the MTDEnergyConsumption metric of my two ESXi hosts.
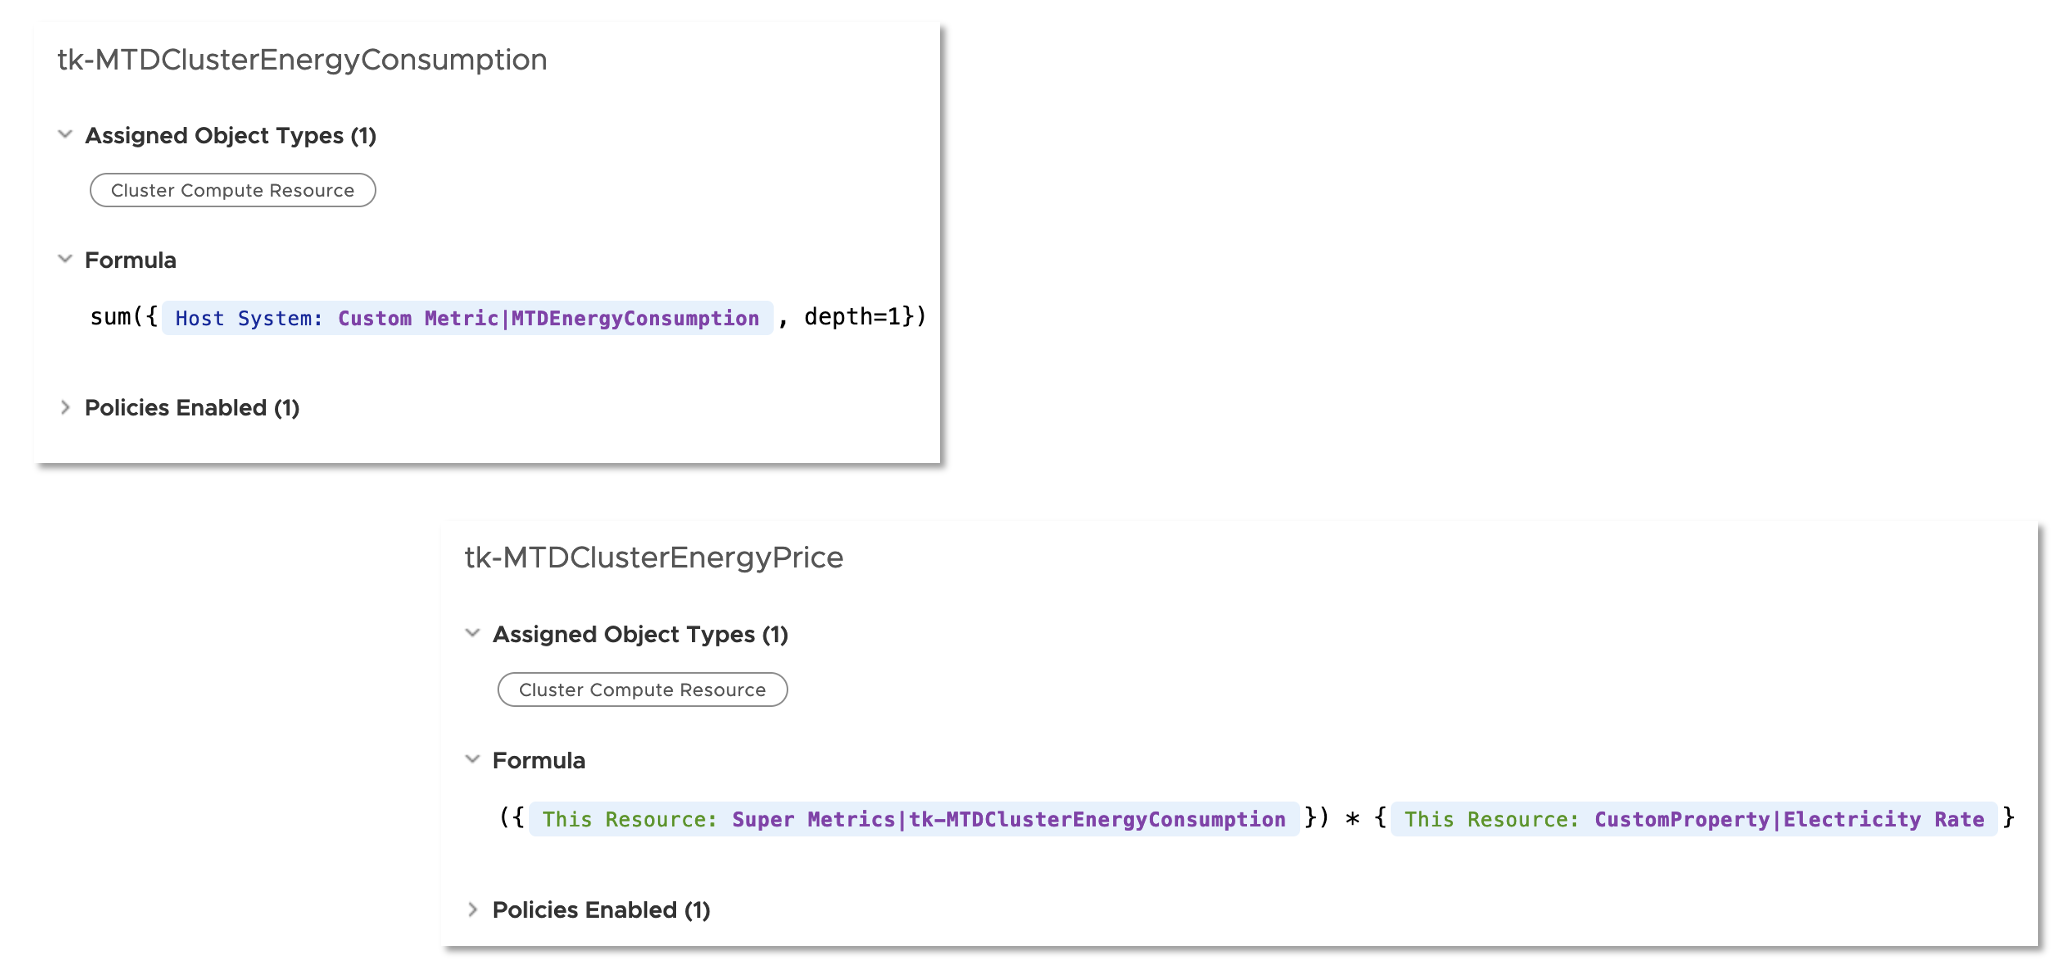
Finally we have the basic metrics, MTD energy consumption and energy price, to calculate additional metrics and visualize them in Aria Operations.
Super Metrics are the easiest way to calculate energy consumption at higher levels like clusters and data centers as well as the price of the consumed energy on all levels. Following picture shows two examples of such Super Metrics, cluster level energy usage and energy price – both as MTD values.
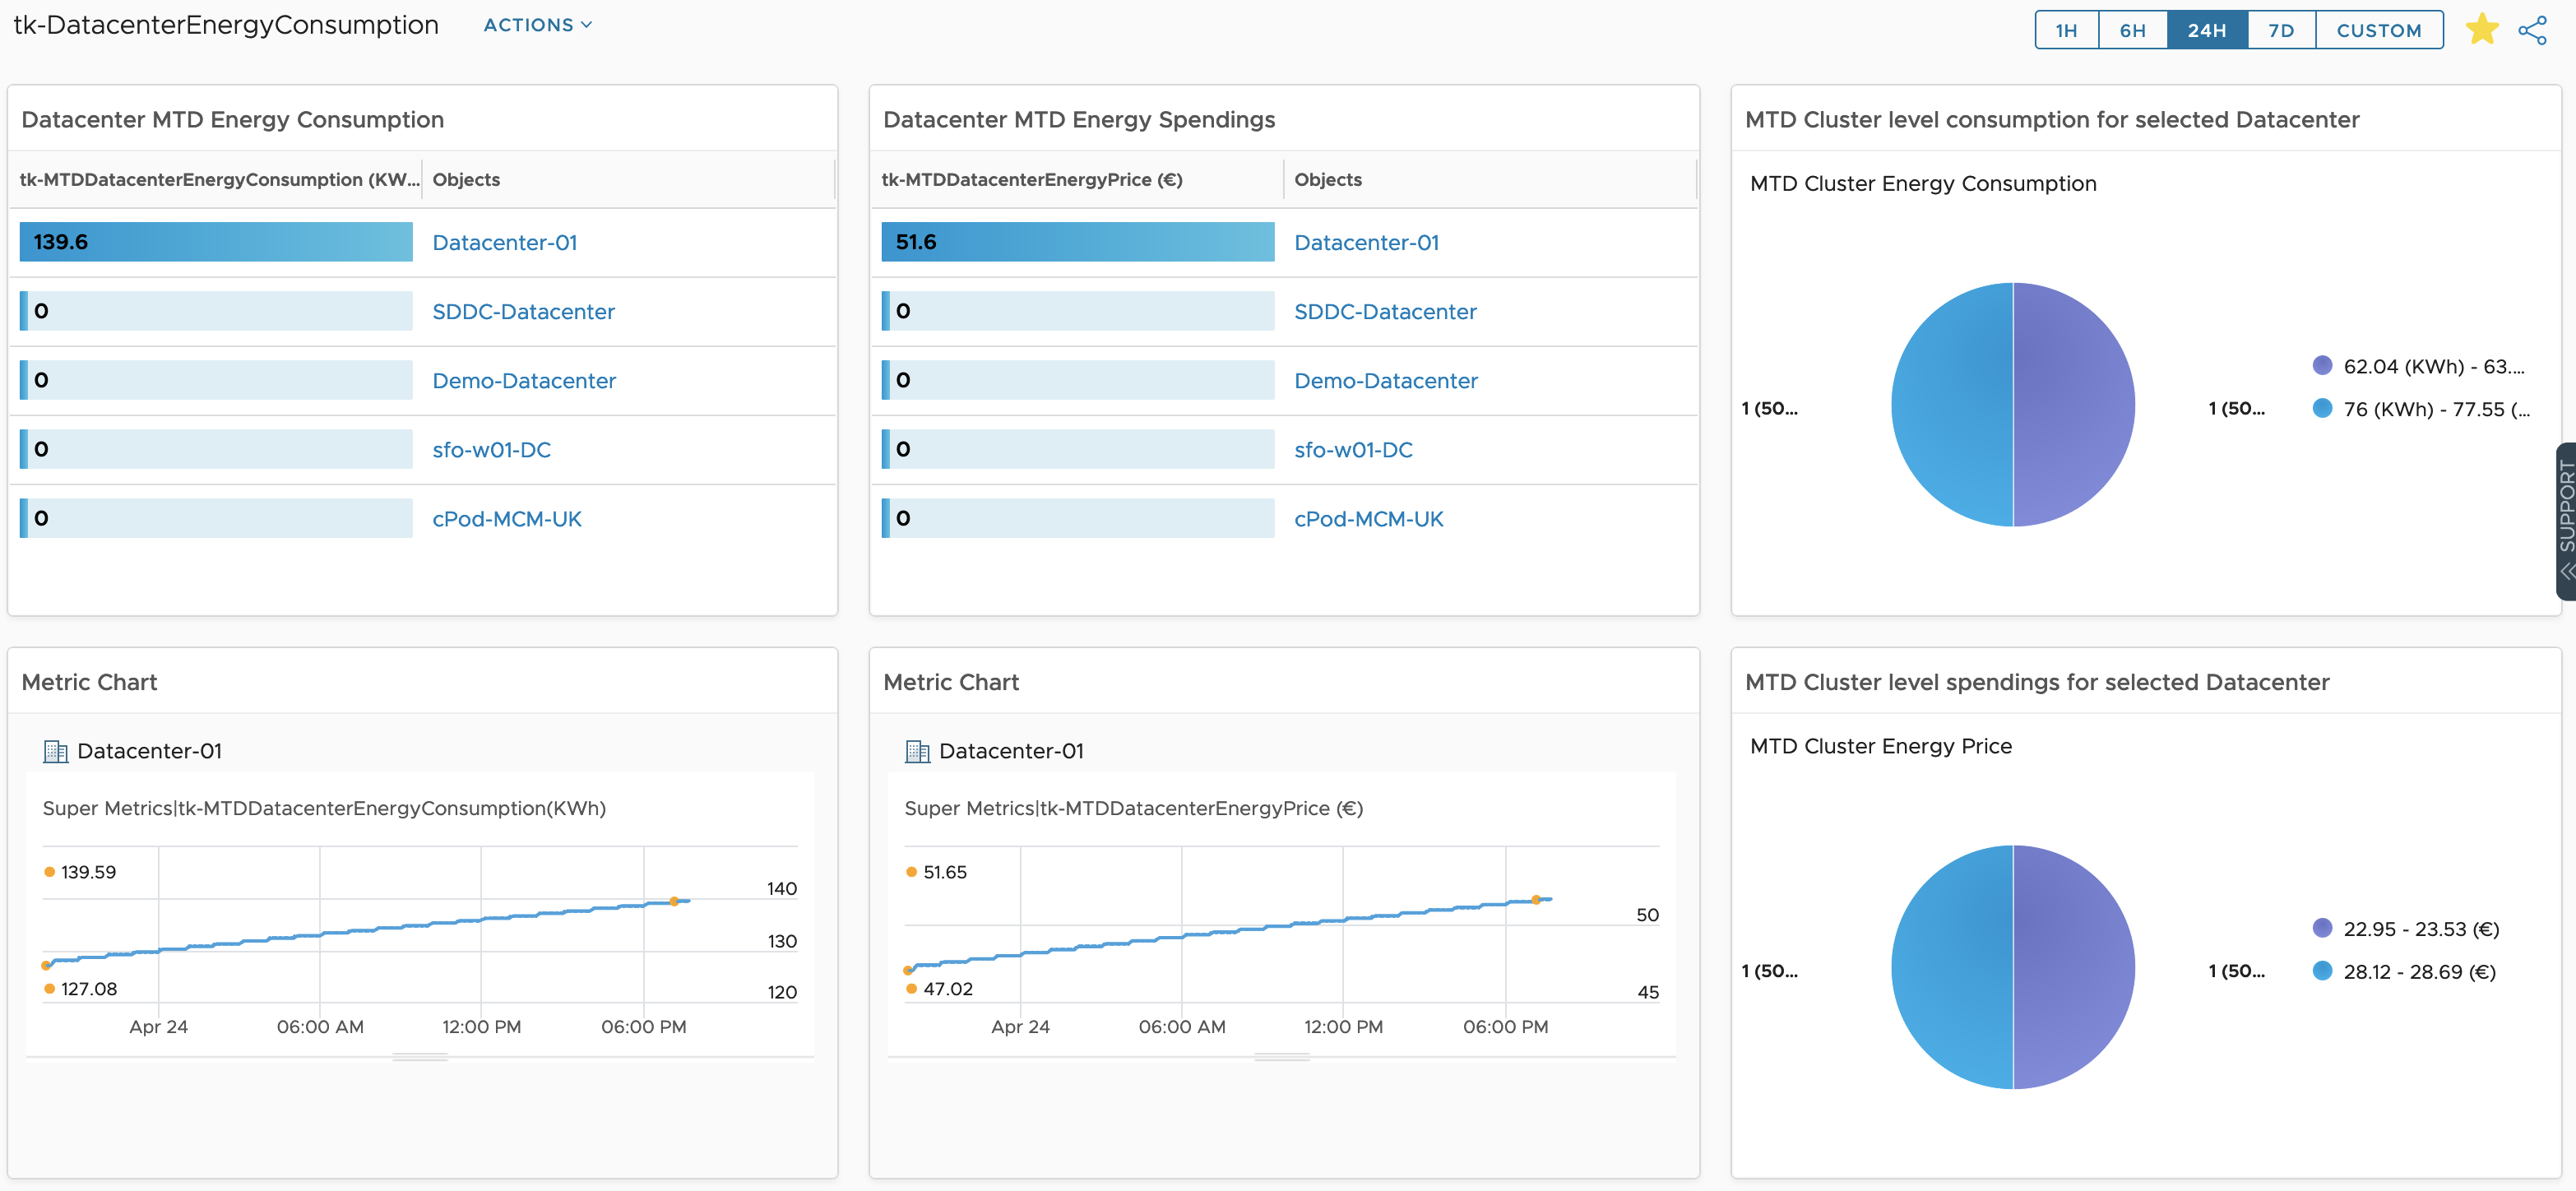
Finally we can use the new metrics to create Aria Operations Dashboards like this one which shows the Month to Date energy consumption and the costs for my Aria Operations Datacenter as well as its breakdown at cluster level.
Outlook
The calculation of the PUE value is still Work in Progress, thus you will receive an error message using the dashboard.
In the next blog post I will show how to add and use even more energy related data coming from basically any device to VMware Aria Operations.
Sources
The VMware Aria Automation Orchestrator workflows and the Aria Operations content is available here:
https://github.com/tkopton/aria-operations-content/tree/main/Sustainability-01
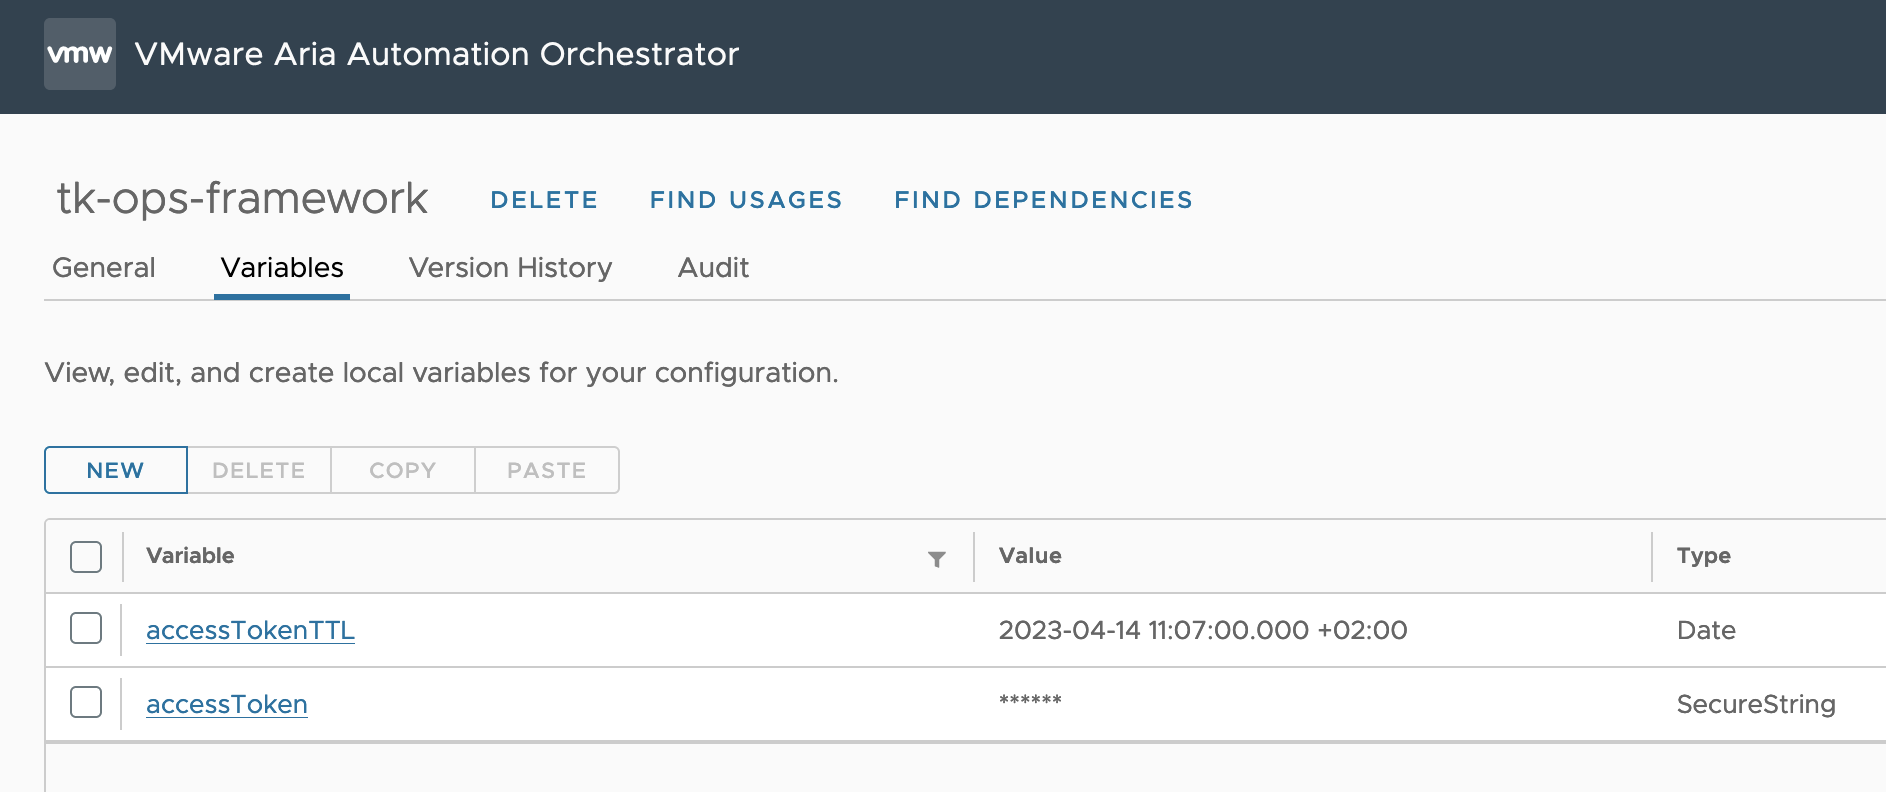
Please be aware that you will need to create a configuration in Aria Orchestrator, which I will use in an improved version of my workflows:
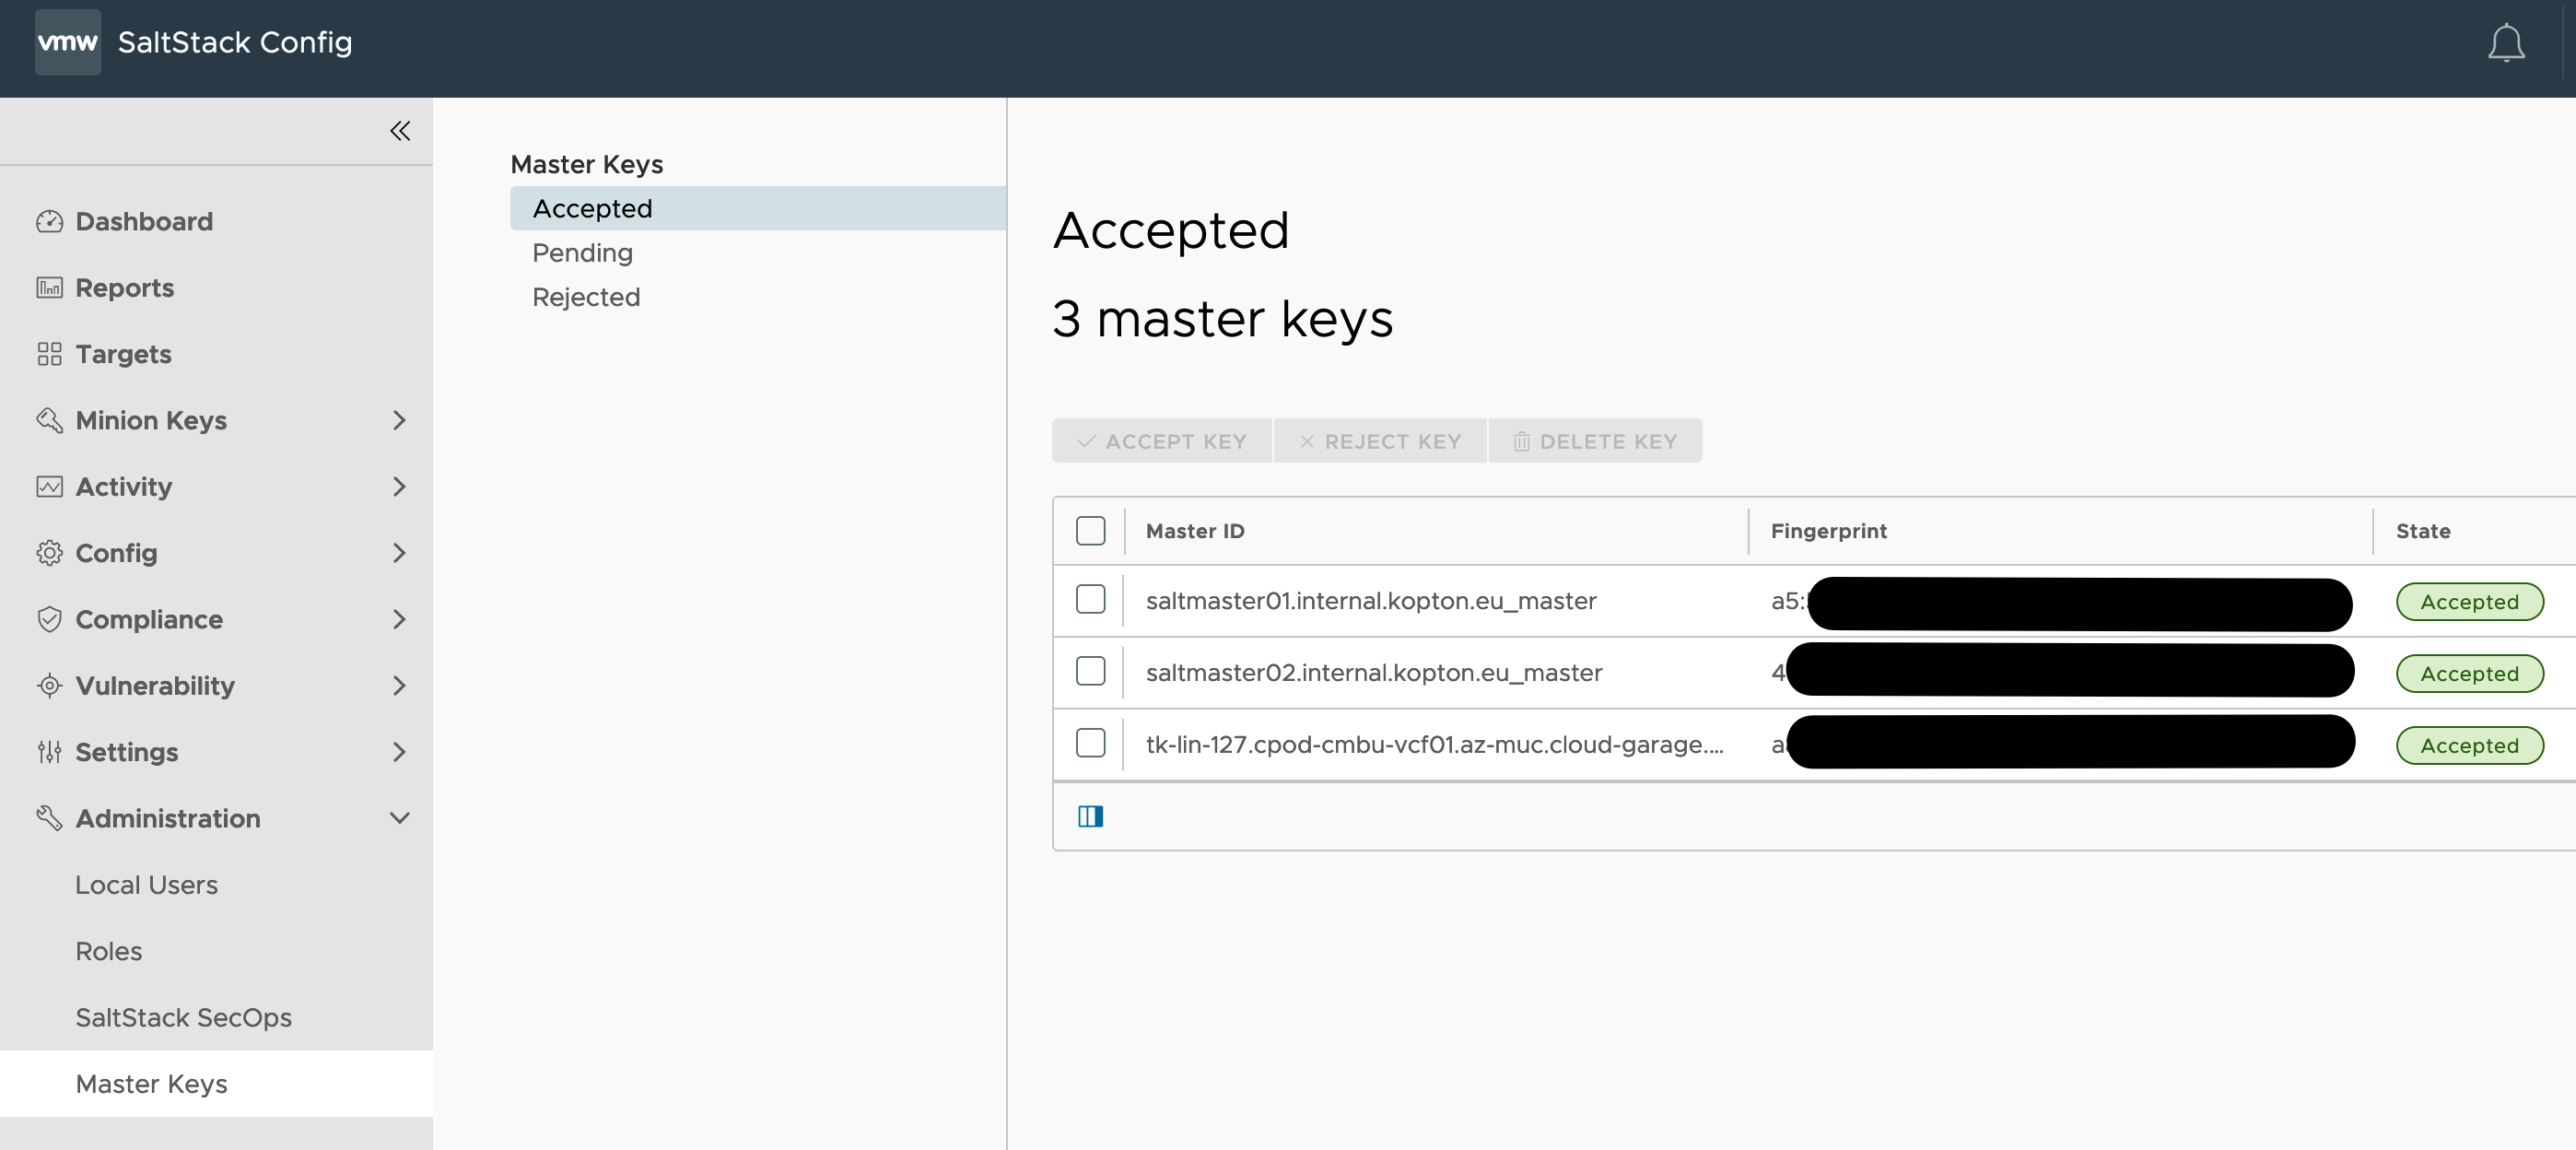
You will also need to create Custom Groups in your Aria Operations to group Hosts or/and Clusters and add the Energy Rate as Custom Property to these objects.
Stay safe.
Thomas – https://twitter.com/ThomasKopto


