In my article “Checking SSL/TLS Certificate Validity Period using vRealize Operations Application Monitoring Agents” published in 2020, I have described how to check the remaining validity of SSL/TLS certificates using Aria Operations, or to be more specific, using vRealize Operations 8.1 and 8.2 back in the days.
I did not expect this post to be utilized by some many customers to check their SSL/TLS certificates used to secure specifically non-VMware endpoints.
As things might have changed in latest versions of Aria Operations including the VMware Aria Operations SaaS offering, In this blog post I will describe how to check and adjust the configuration if required.
Application Monitoring – Agent Configuration
The first change is, that there is no Application Remote Collector (ARC) Aria Operations. Its functionality is now included in the Aria Operations Cloud Proxy.
A Cloud Proxy instance has to be deployed to the Aria Operations instance regardless the option being used, on-premises or SaaS. The following picture shows the Cloud Proxy in an on-premises Aria Operations instance.

To deploy and configure the Cloud Proxy please follow the official VMware documentation: https://docs.vmware.com/en/VMware-Aria-Operations/8.12/Getting-Started-Operations/GUID-7C52B725-4675-4A58-A0AF-6246AEFA45CD.html
The installation and configuration of the Aria Operations managed telegraf agent did not change significantly, the screenshots from my old post still apply. VMware documentation describes the installation, configuration and uninstallation process: https://docs.vmware.com/en/VMware-Aria-Operations/8.12/Configuring-Operations/GUID-0C121456-370C-467E-874B-38ACC93E3776.html
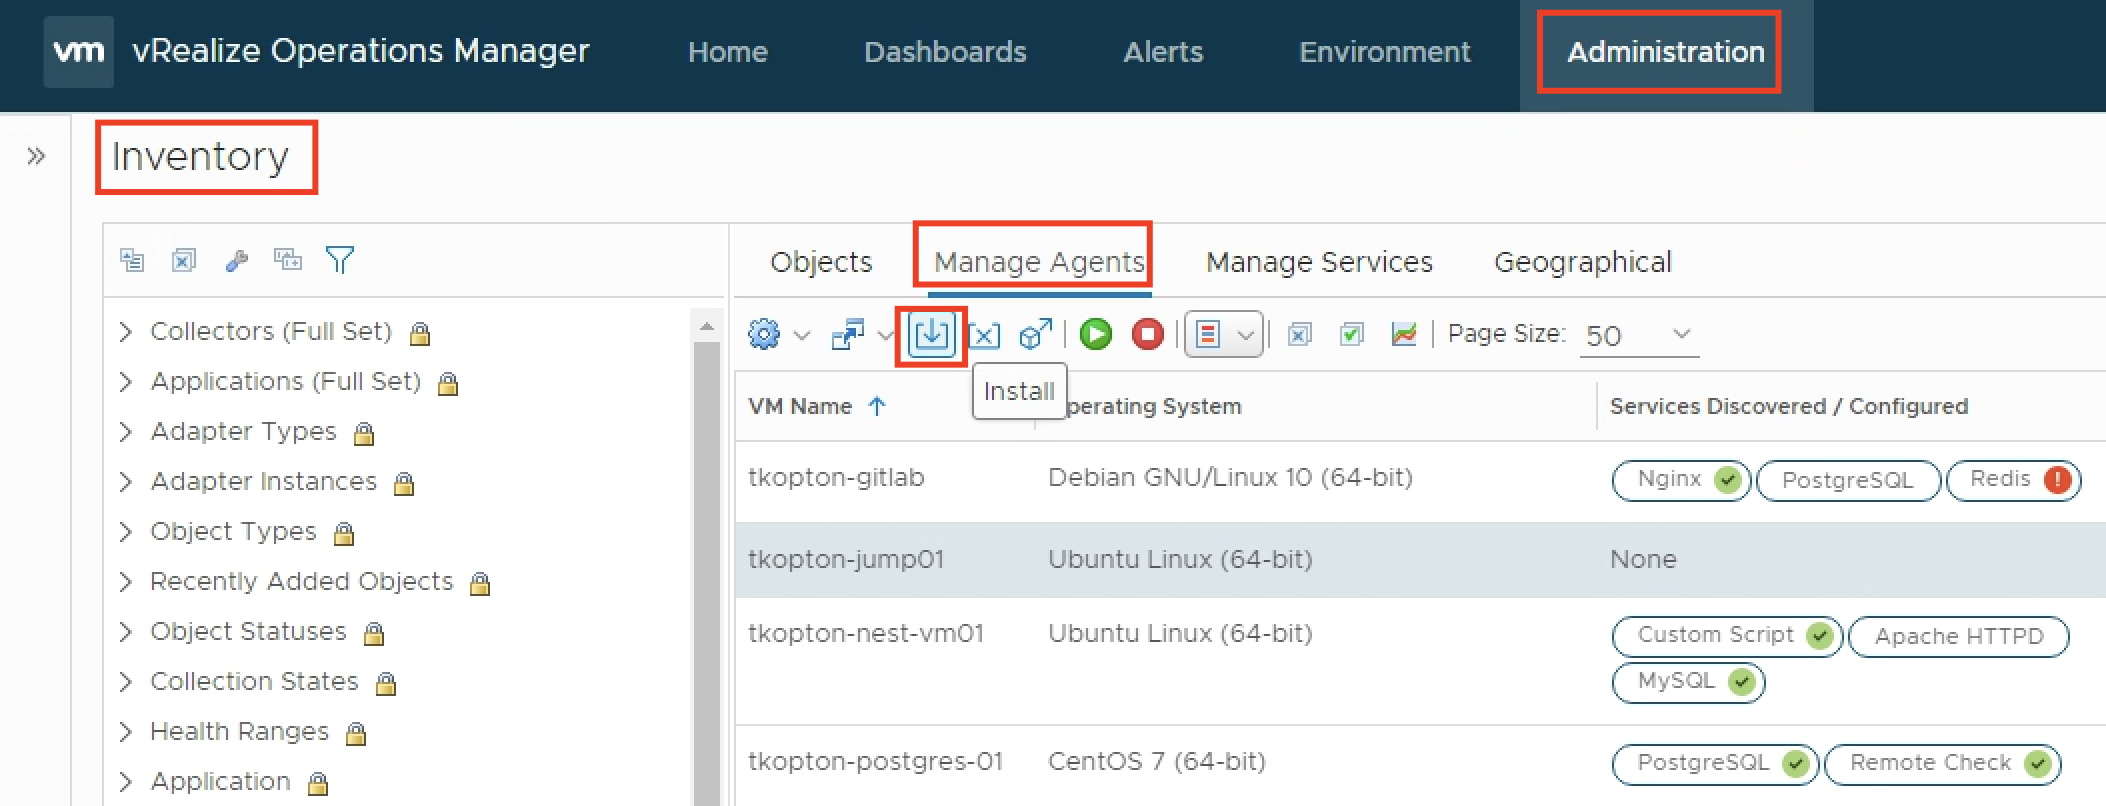
Once the agent has been installed and is running, the actual configuration of the agent becomes available.
The agent basically:
- discovers supported applications and can be configured to monitor those applications
- provide the ability to run remote check, like ICMP or TCP tests
- provide the ability to run custom scripts locally
The ability to run scripts and report the integer output as metric back to Aria Operations is exactly what we need to run certificate checks.
The actual script is fairly easy and available, together with the Aria Operations dashboard, via VMware Code:
https://code.vmware.com/samples?id=7464
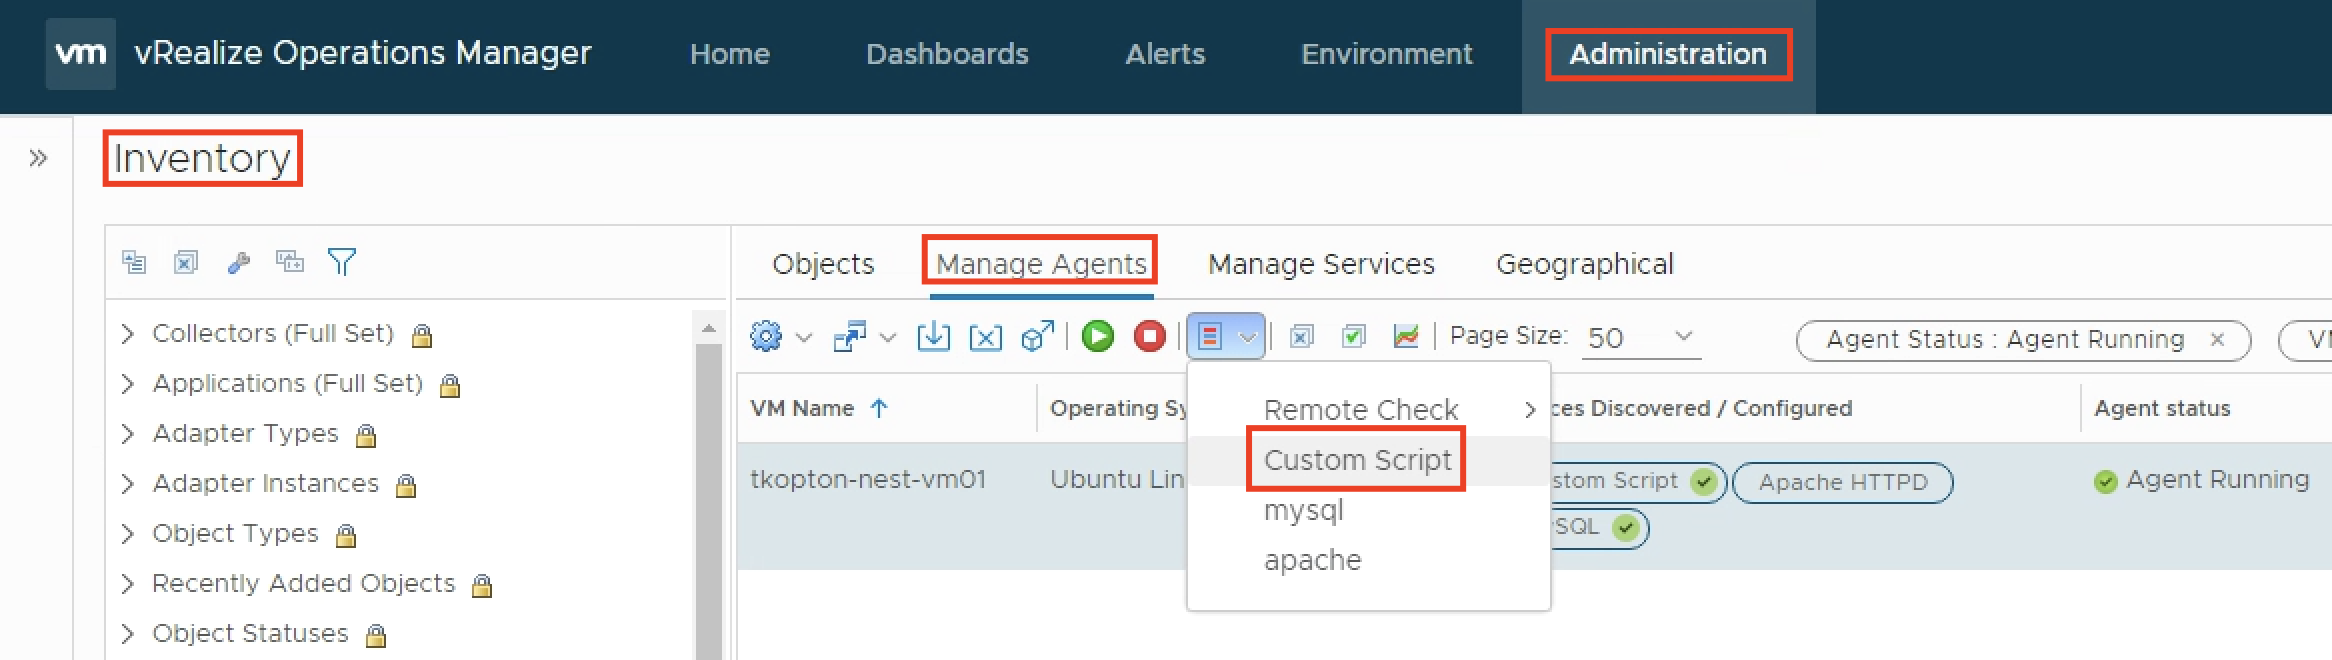
To let the agent run the script and provide a metric, we configure the agent with few options, the process has changed slightly in newer versions and you will find it under the Applications section.

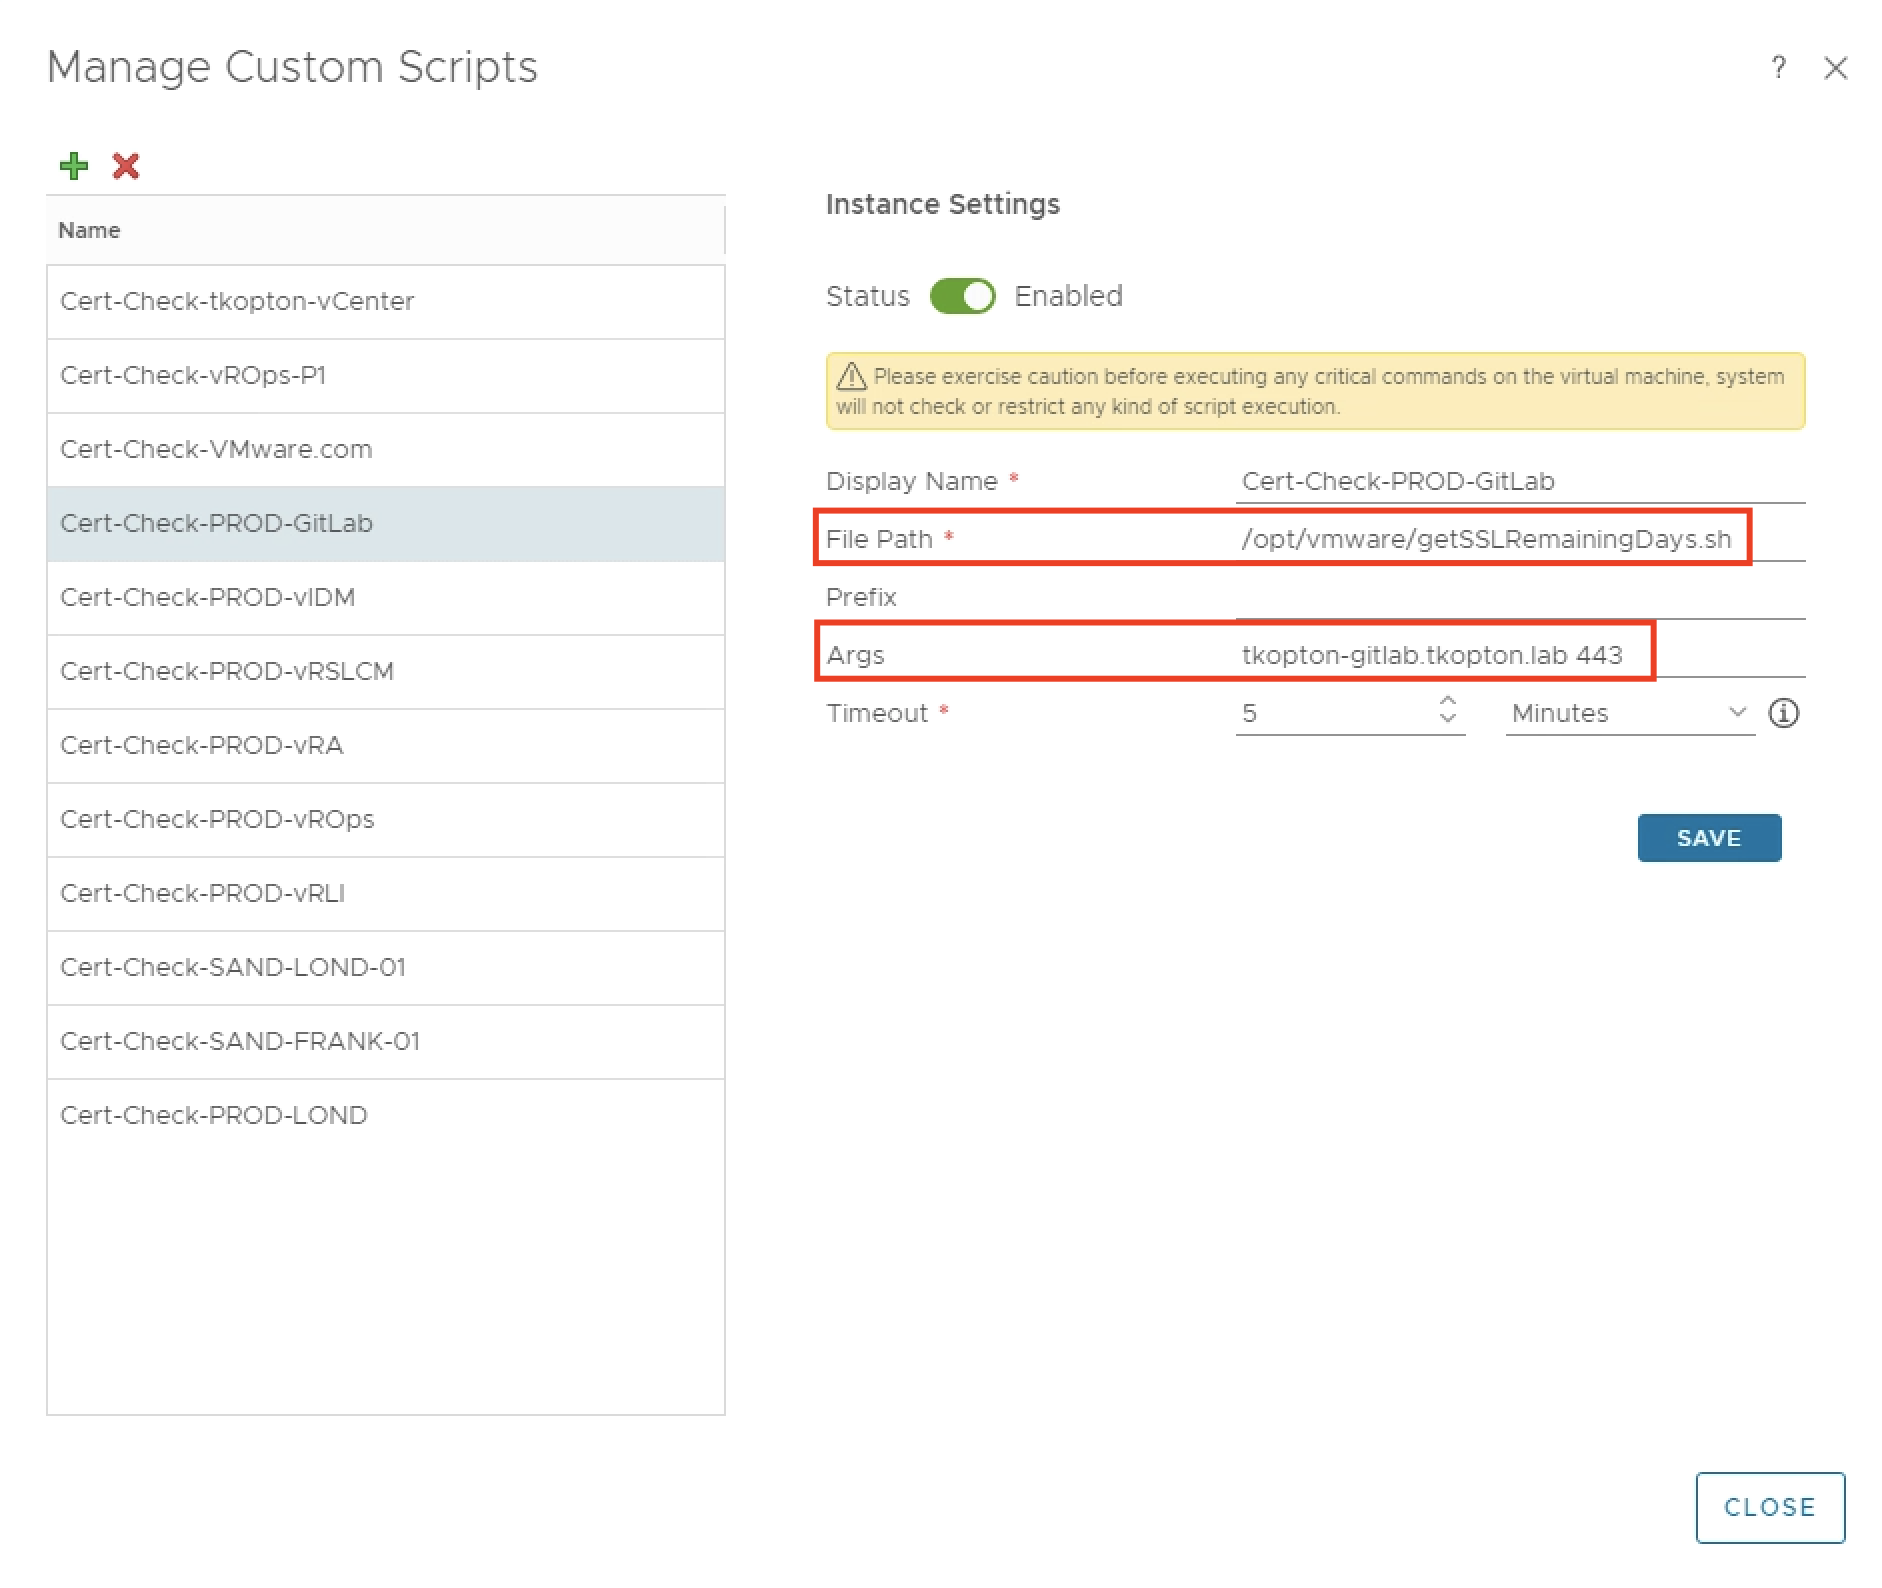
The script itself expects two parameters, the endpoint to check and the port number.

One agent, like for example a designated Linux Virtual Machine, can run multiple instances of the same script with different options or completely different scripts.
All scripts need to be placed in /opt/vmware and the arcuser (as per default configuration) needs the execute permissions.
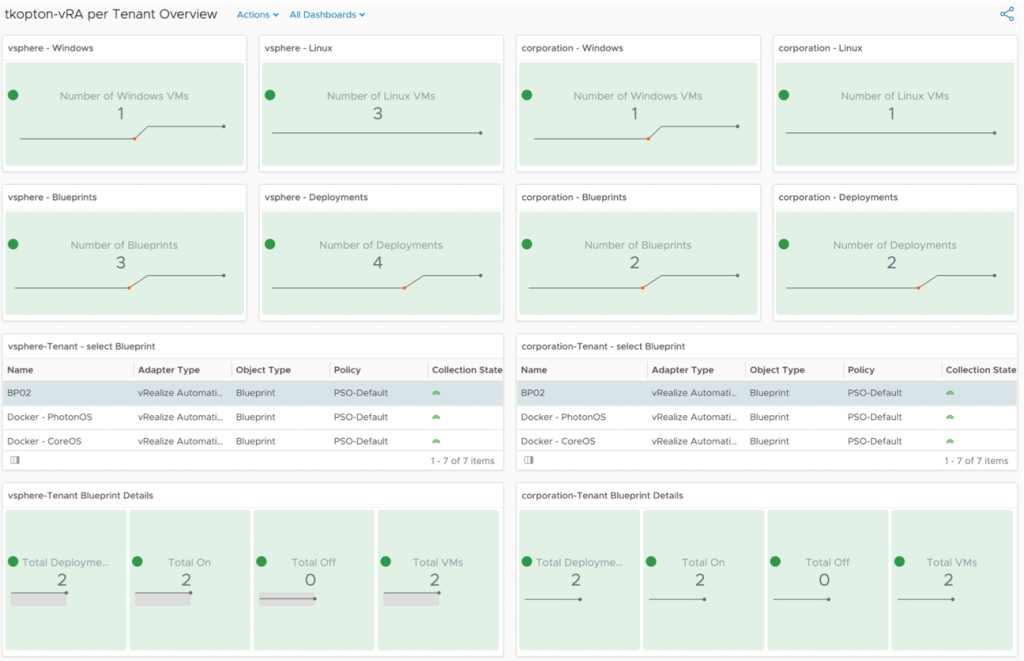
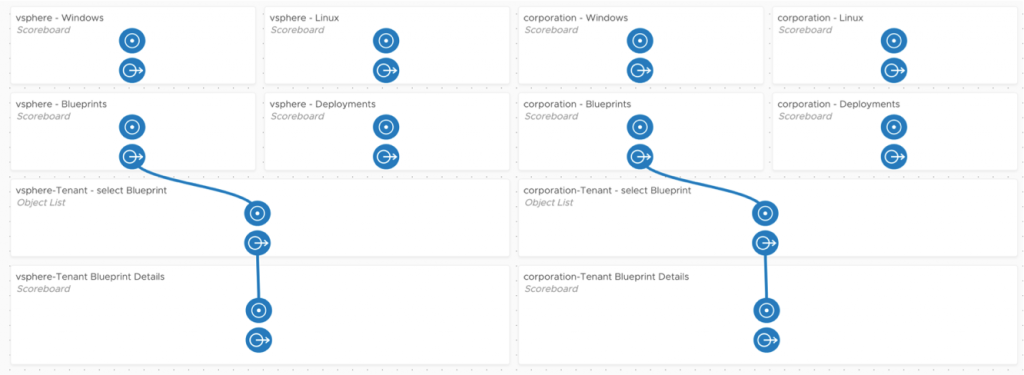
Dashboard
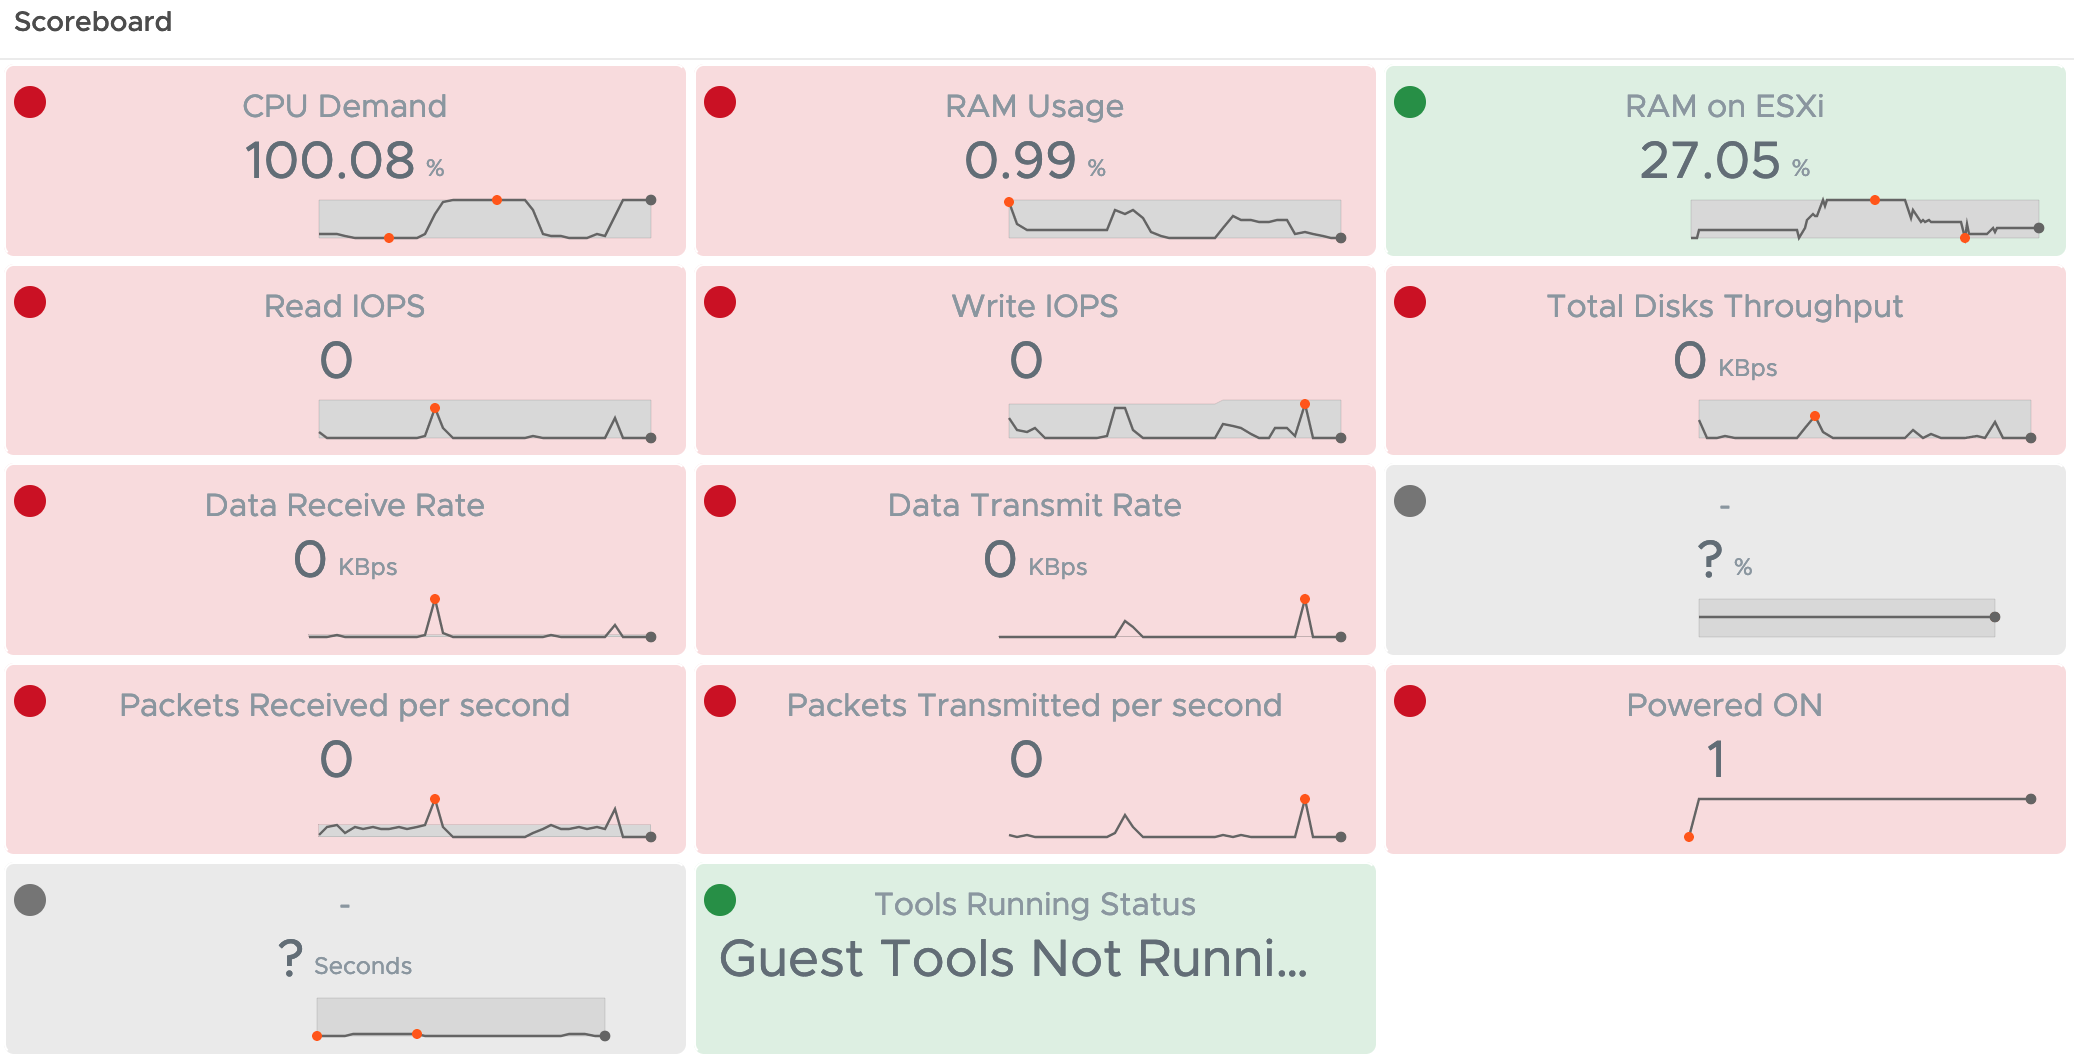
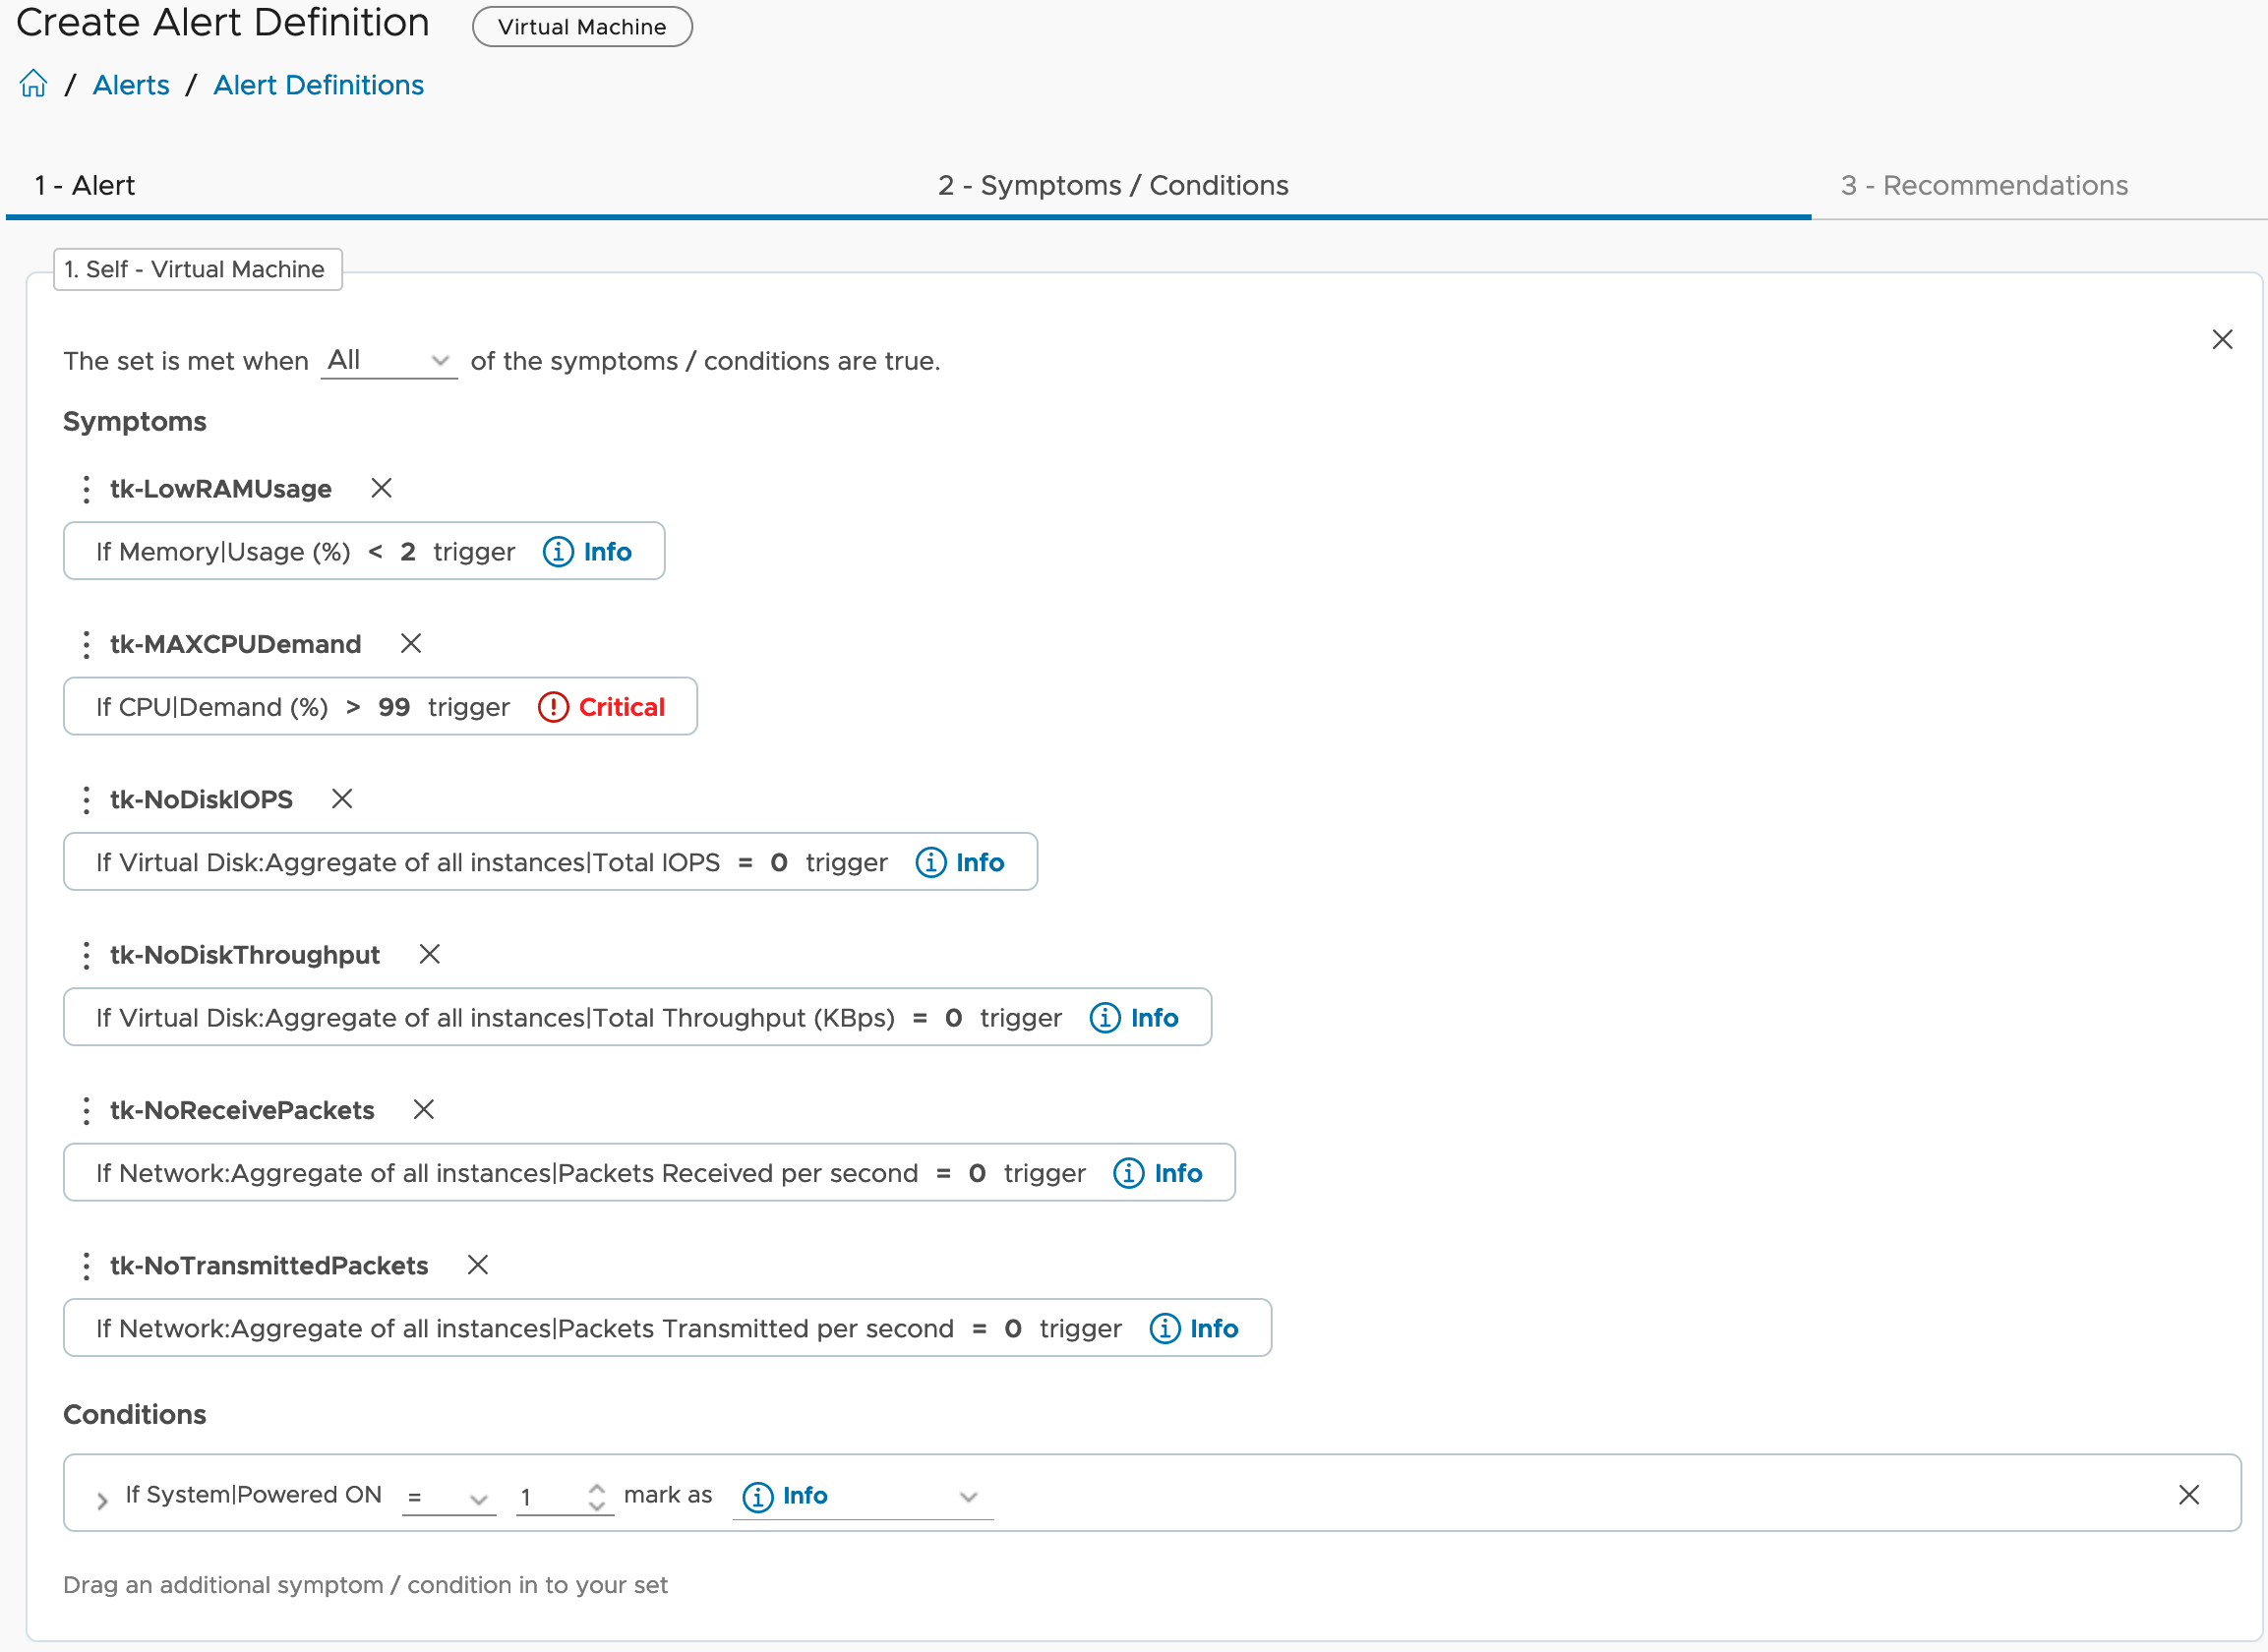
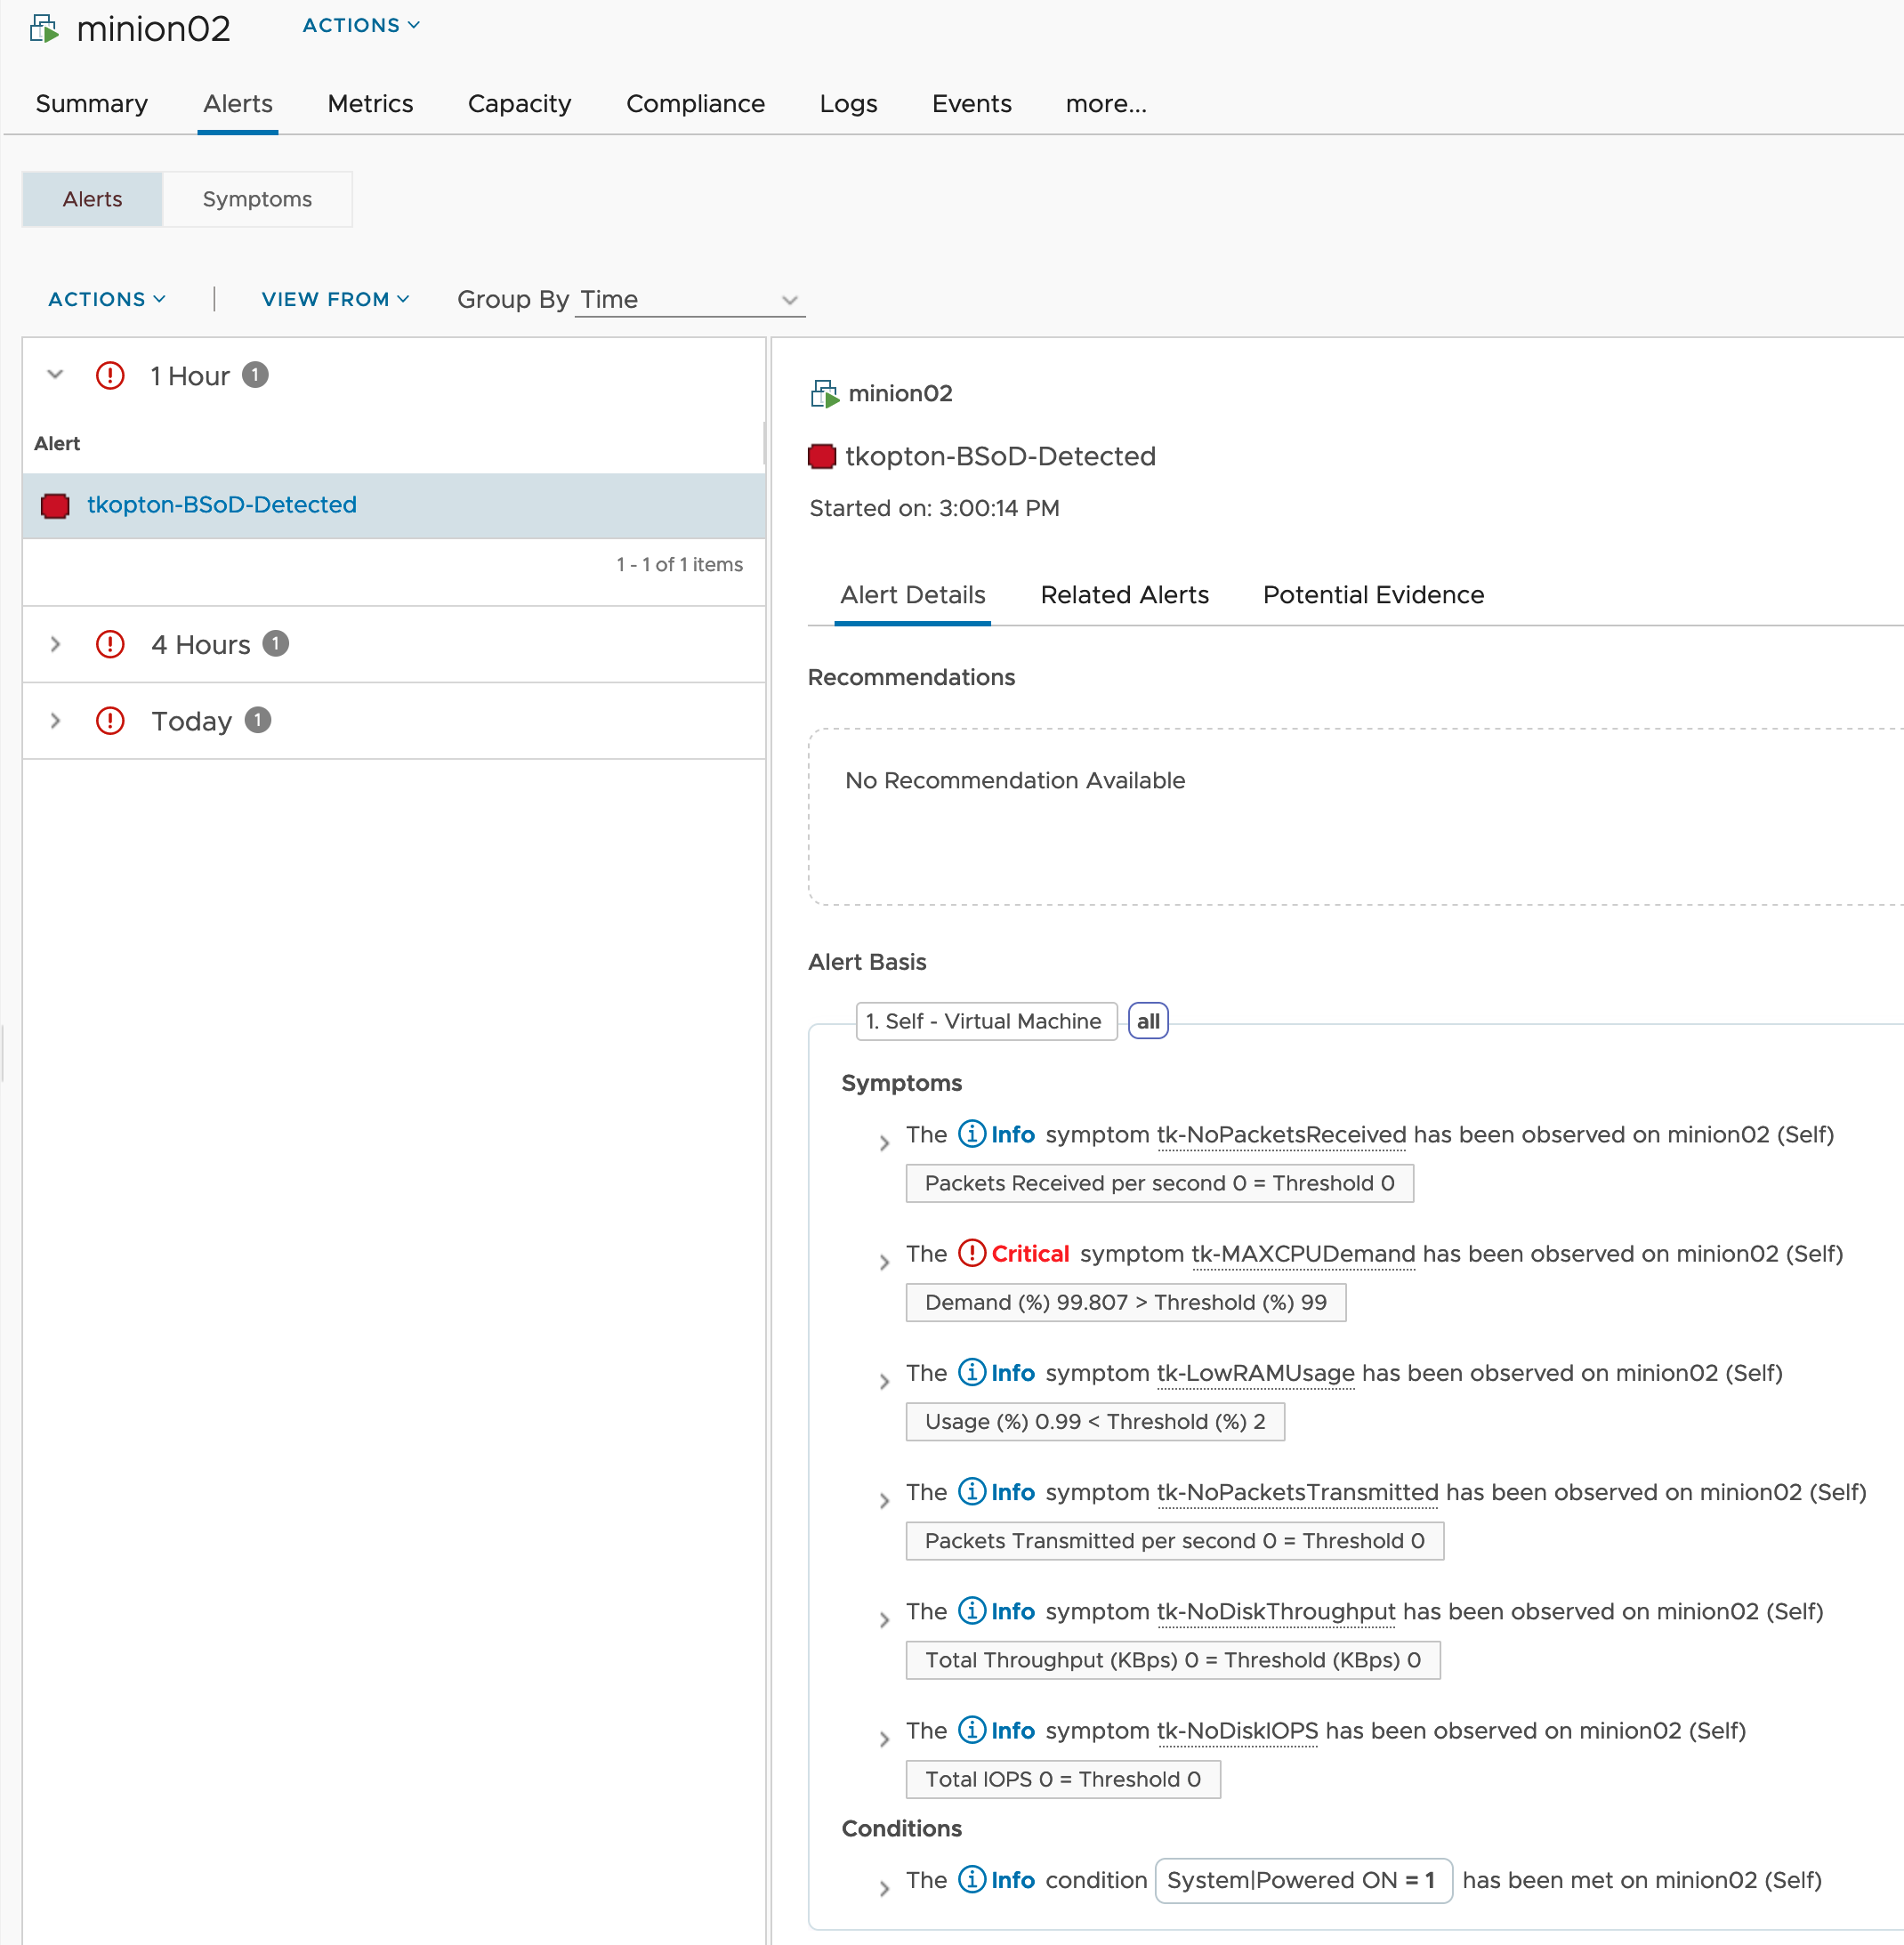
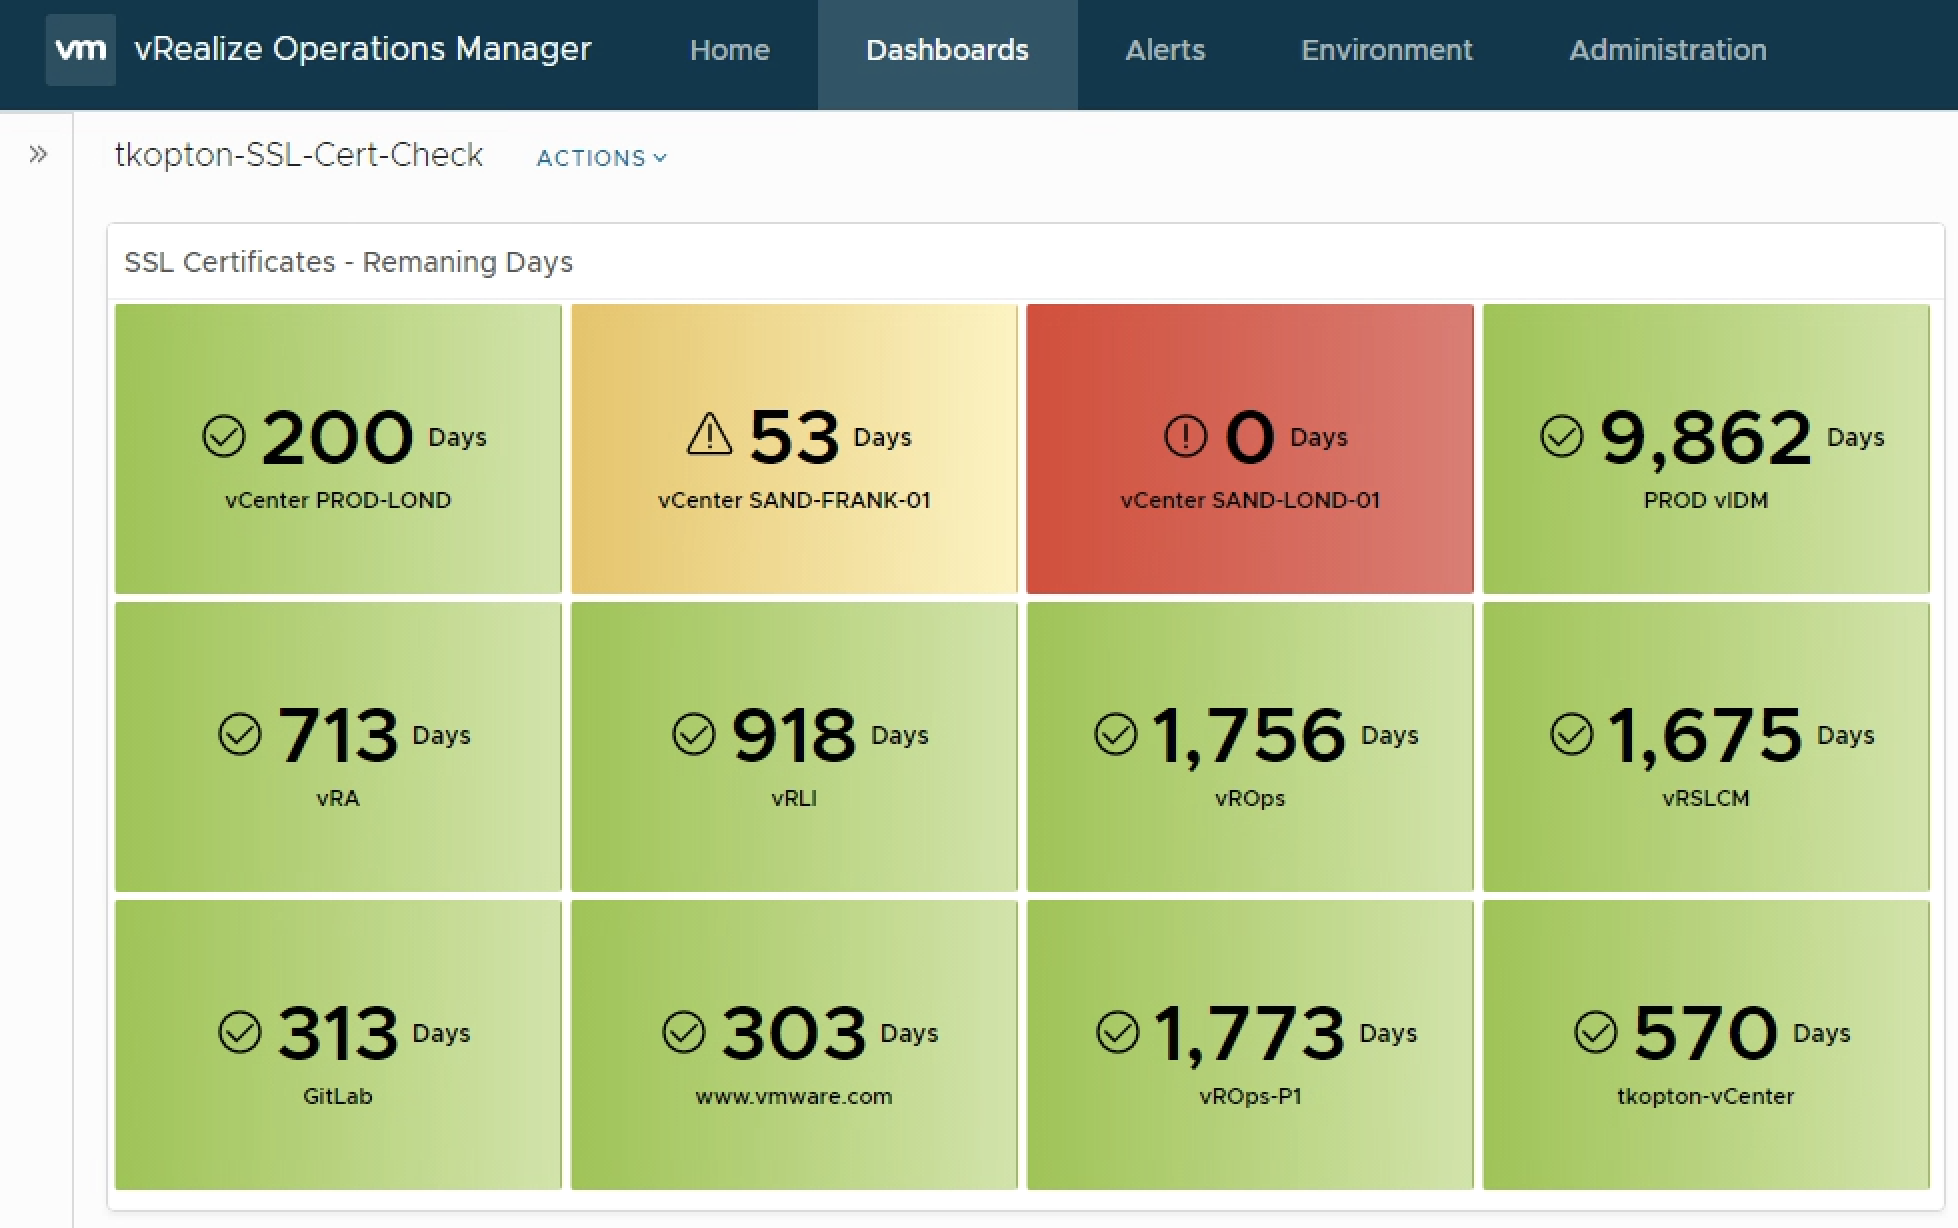
The running custom scripts provide a metric per script. The values can be used to populate dashboards or views or serve as metrics for symptoms and alert definitions.

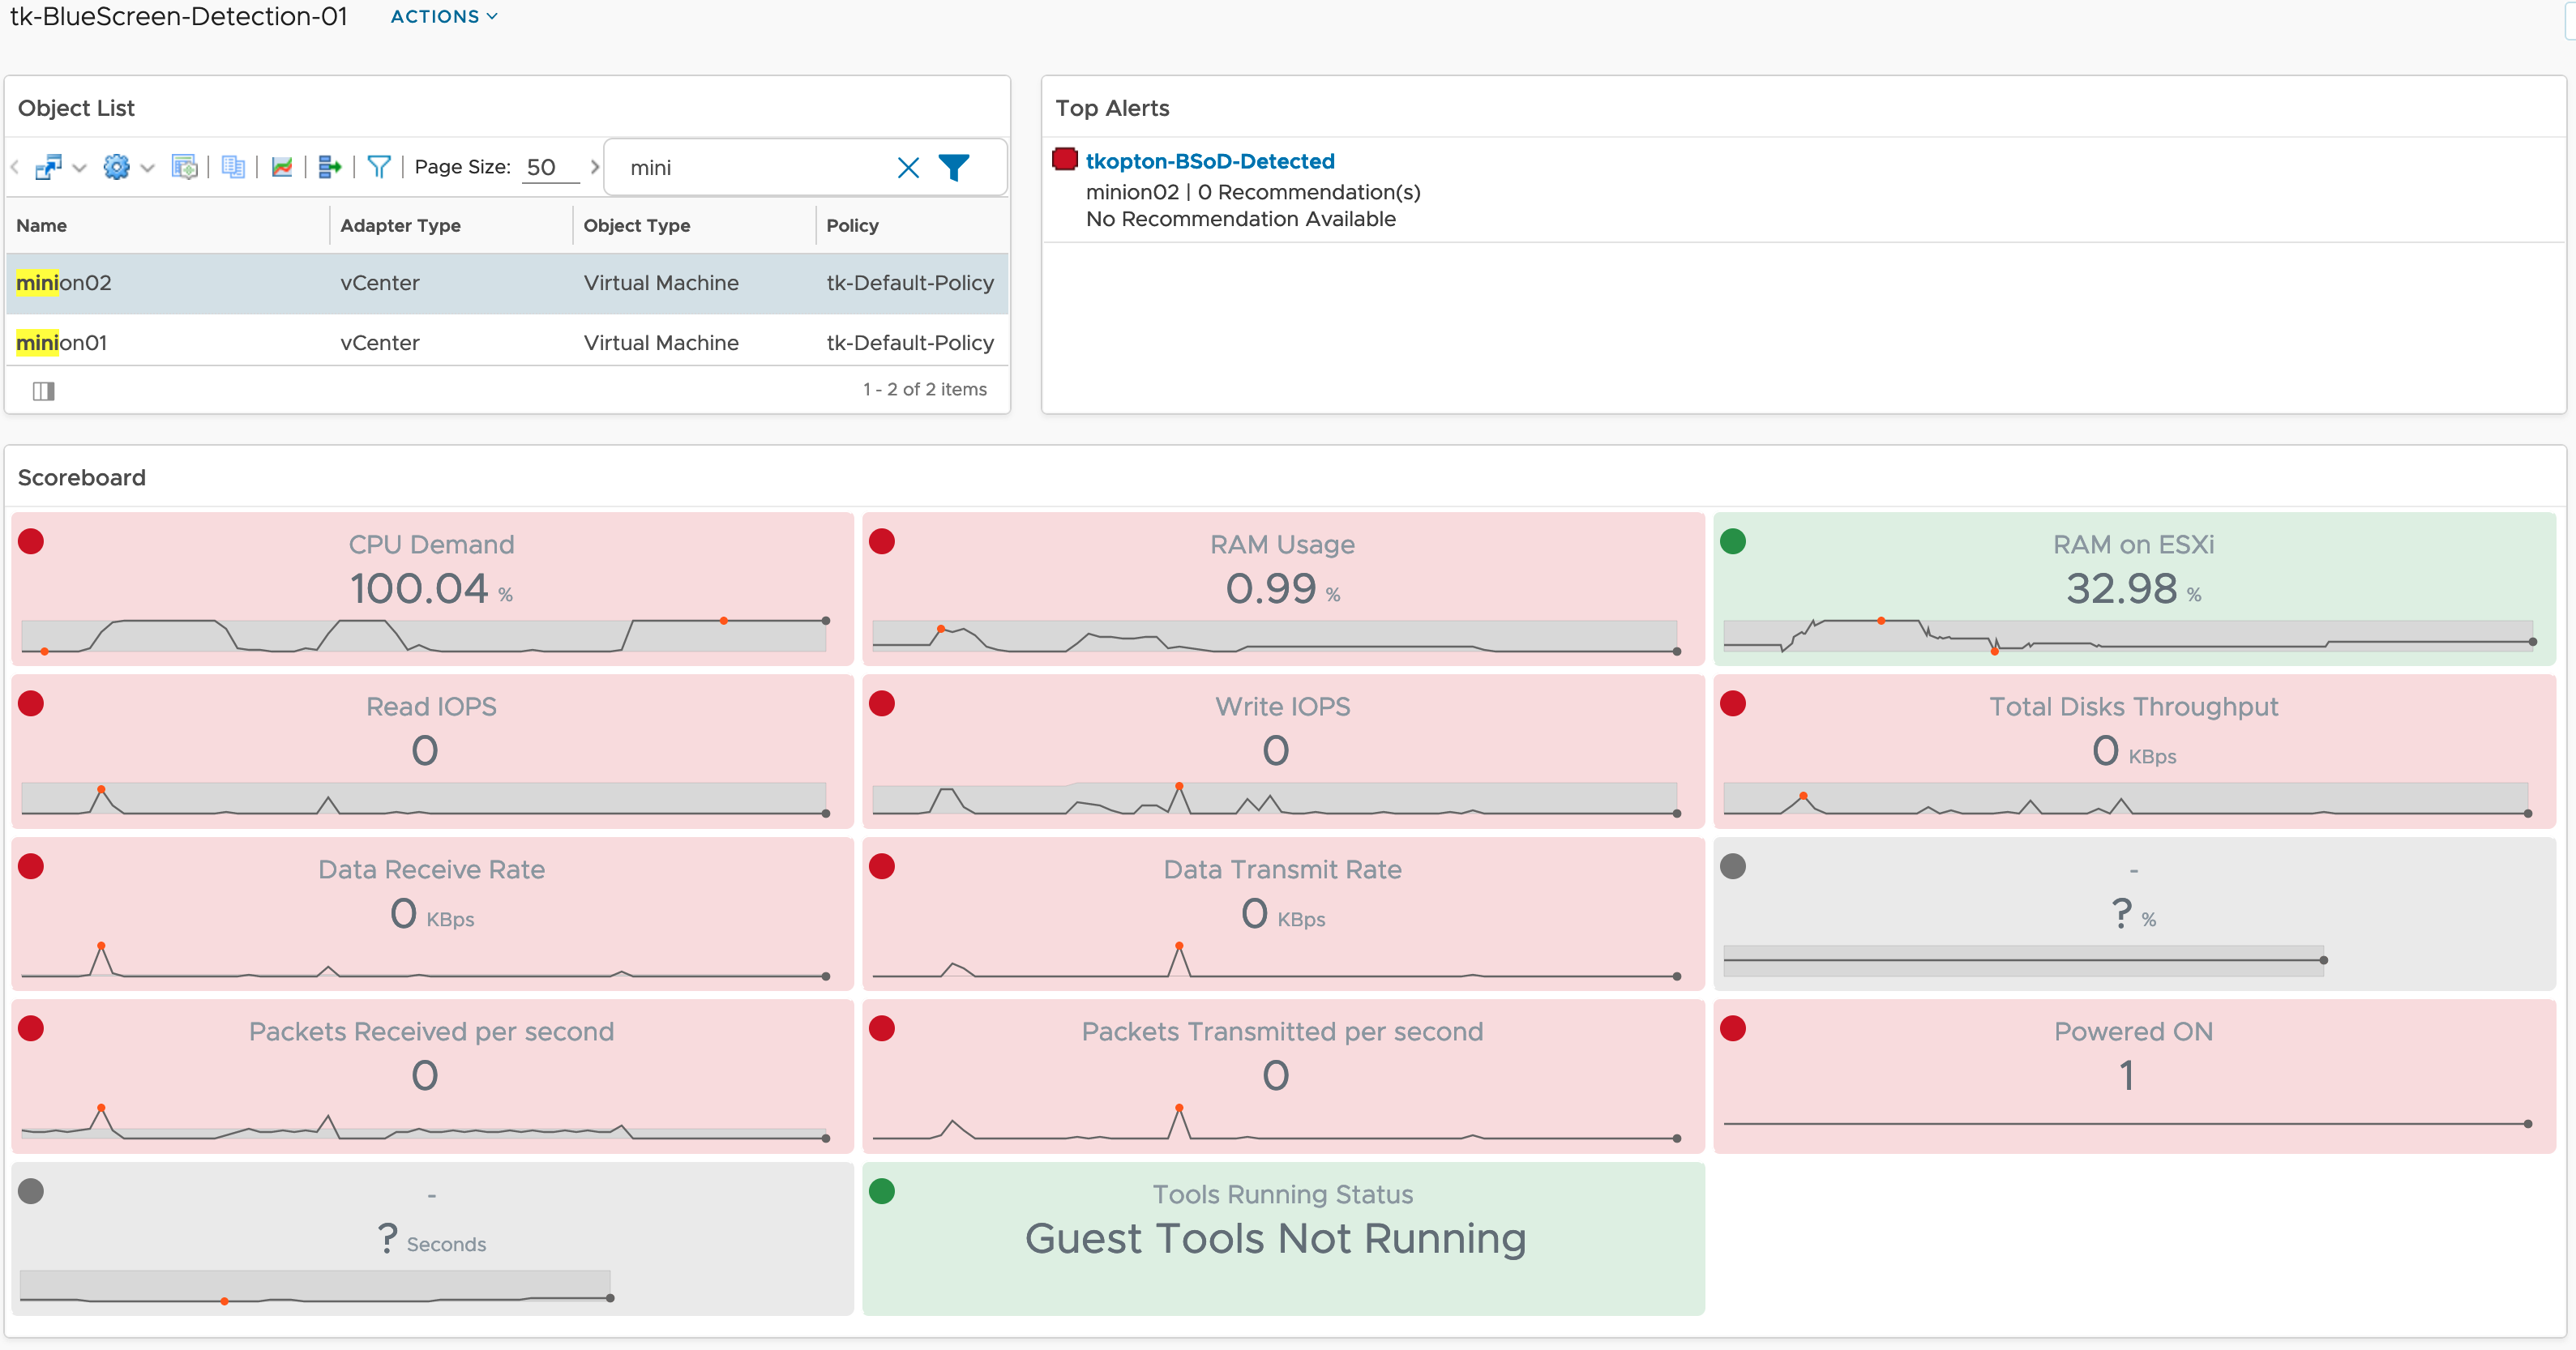
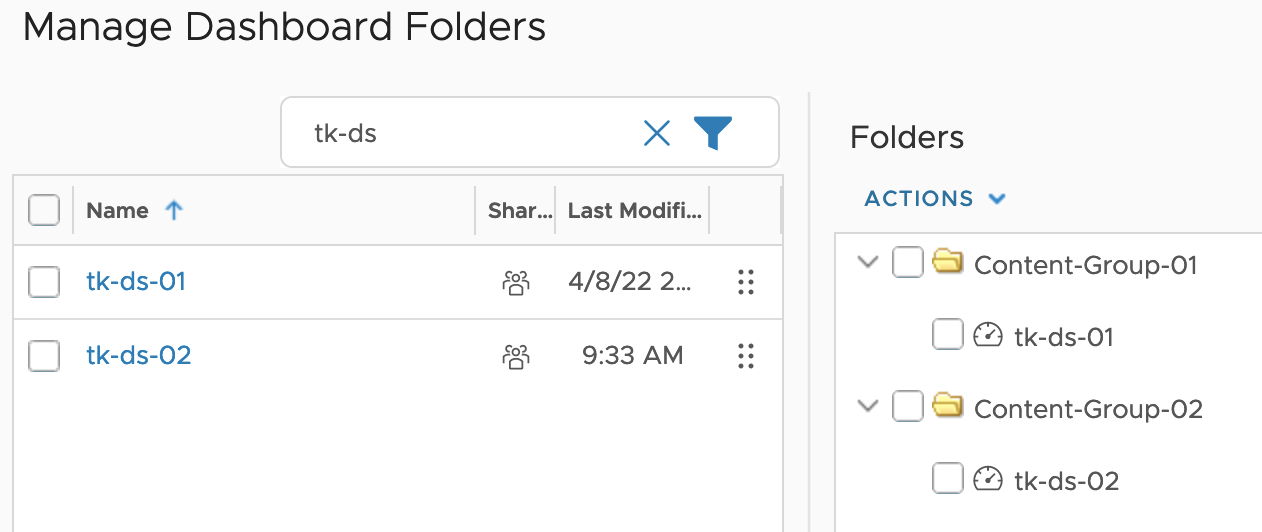
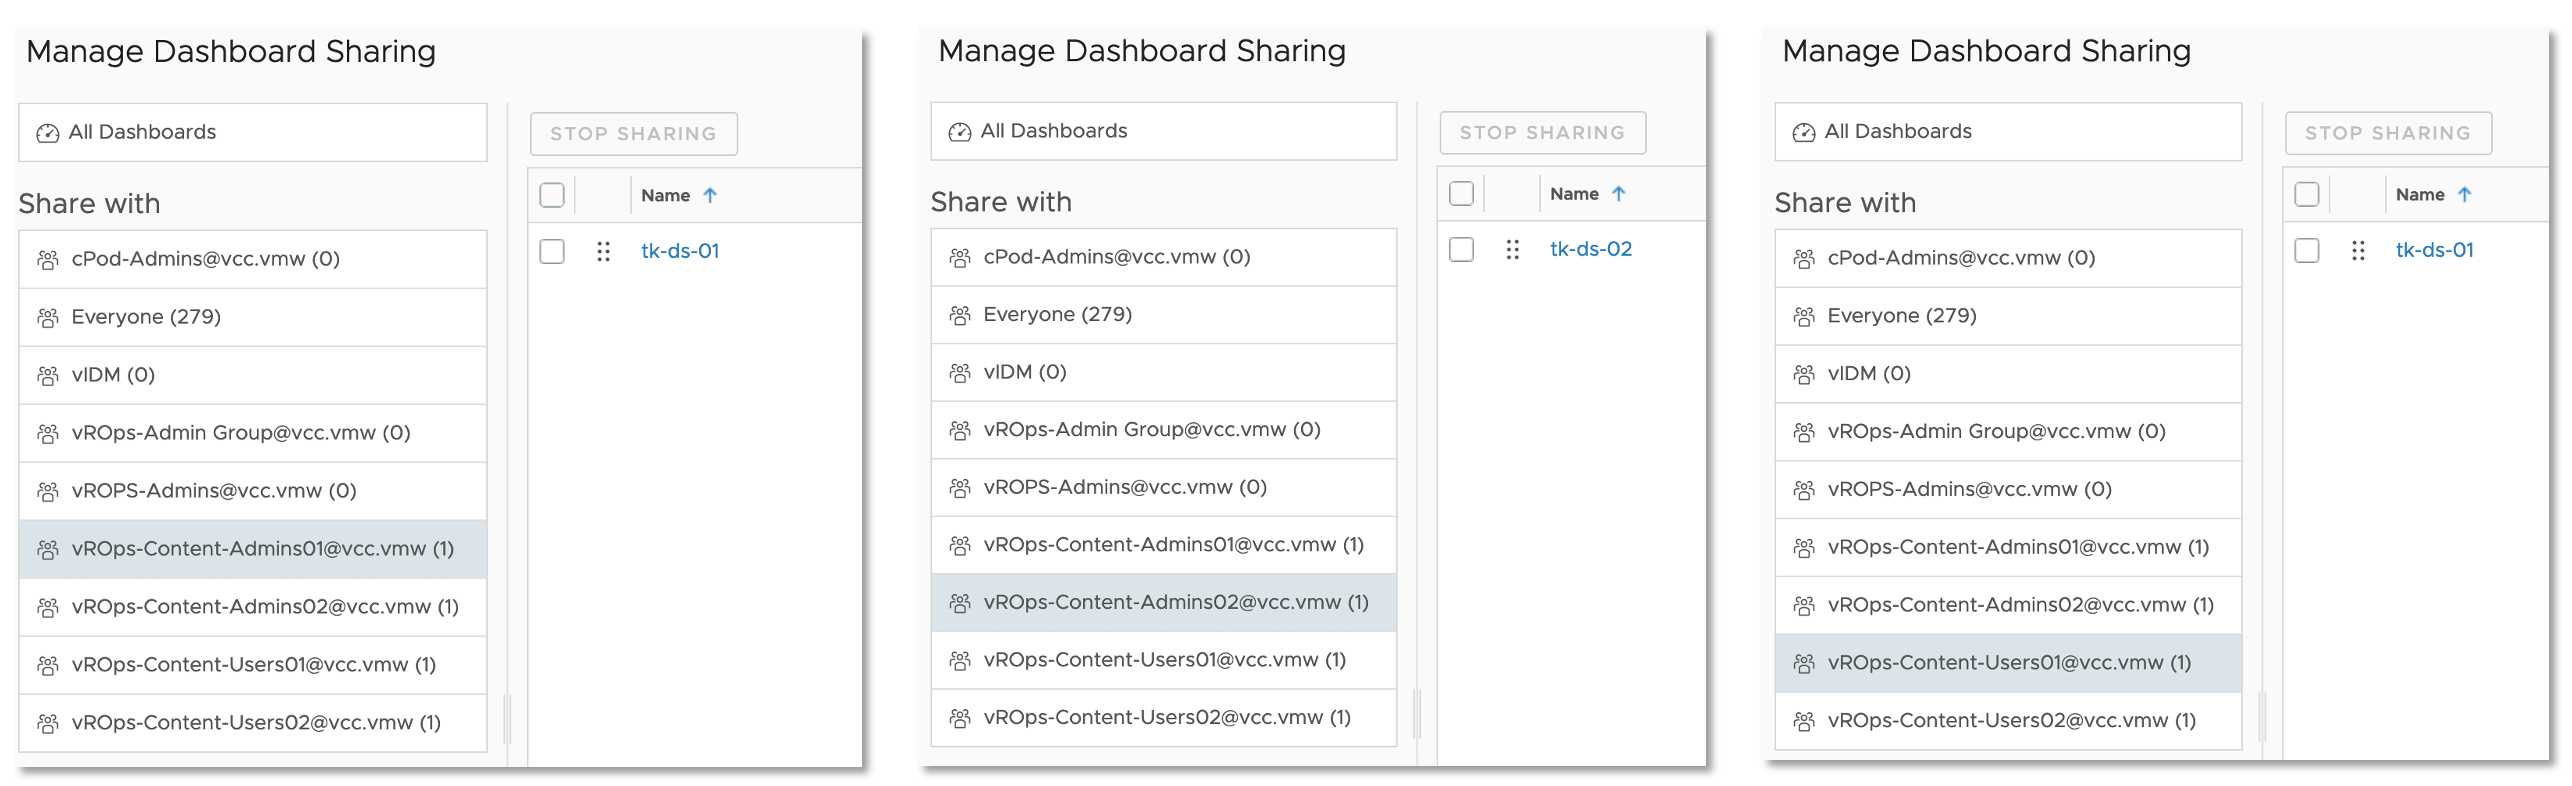
After downloading and importing the Dashboard into Aria Operations, please do not forget to reconfigure the Scoreboard widget. You will need to remove my custom script metrics and add yours, as shown here.

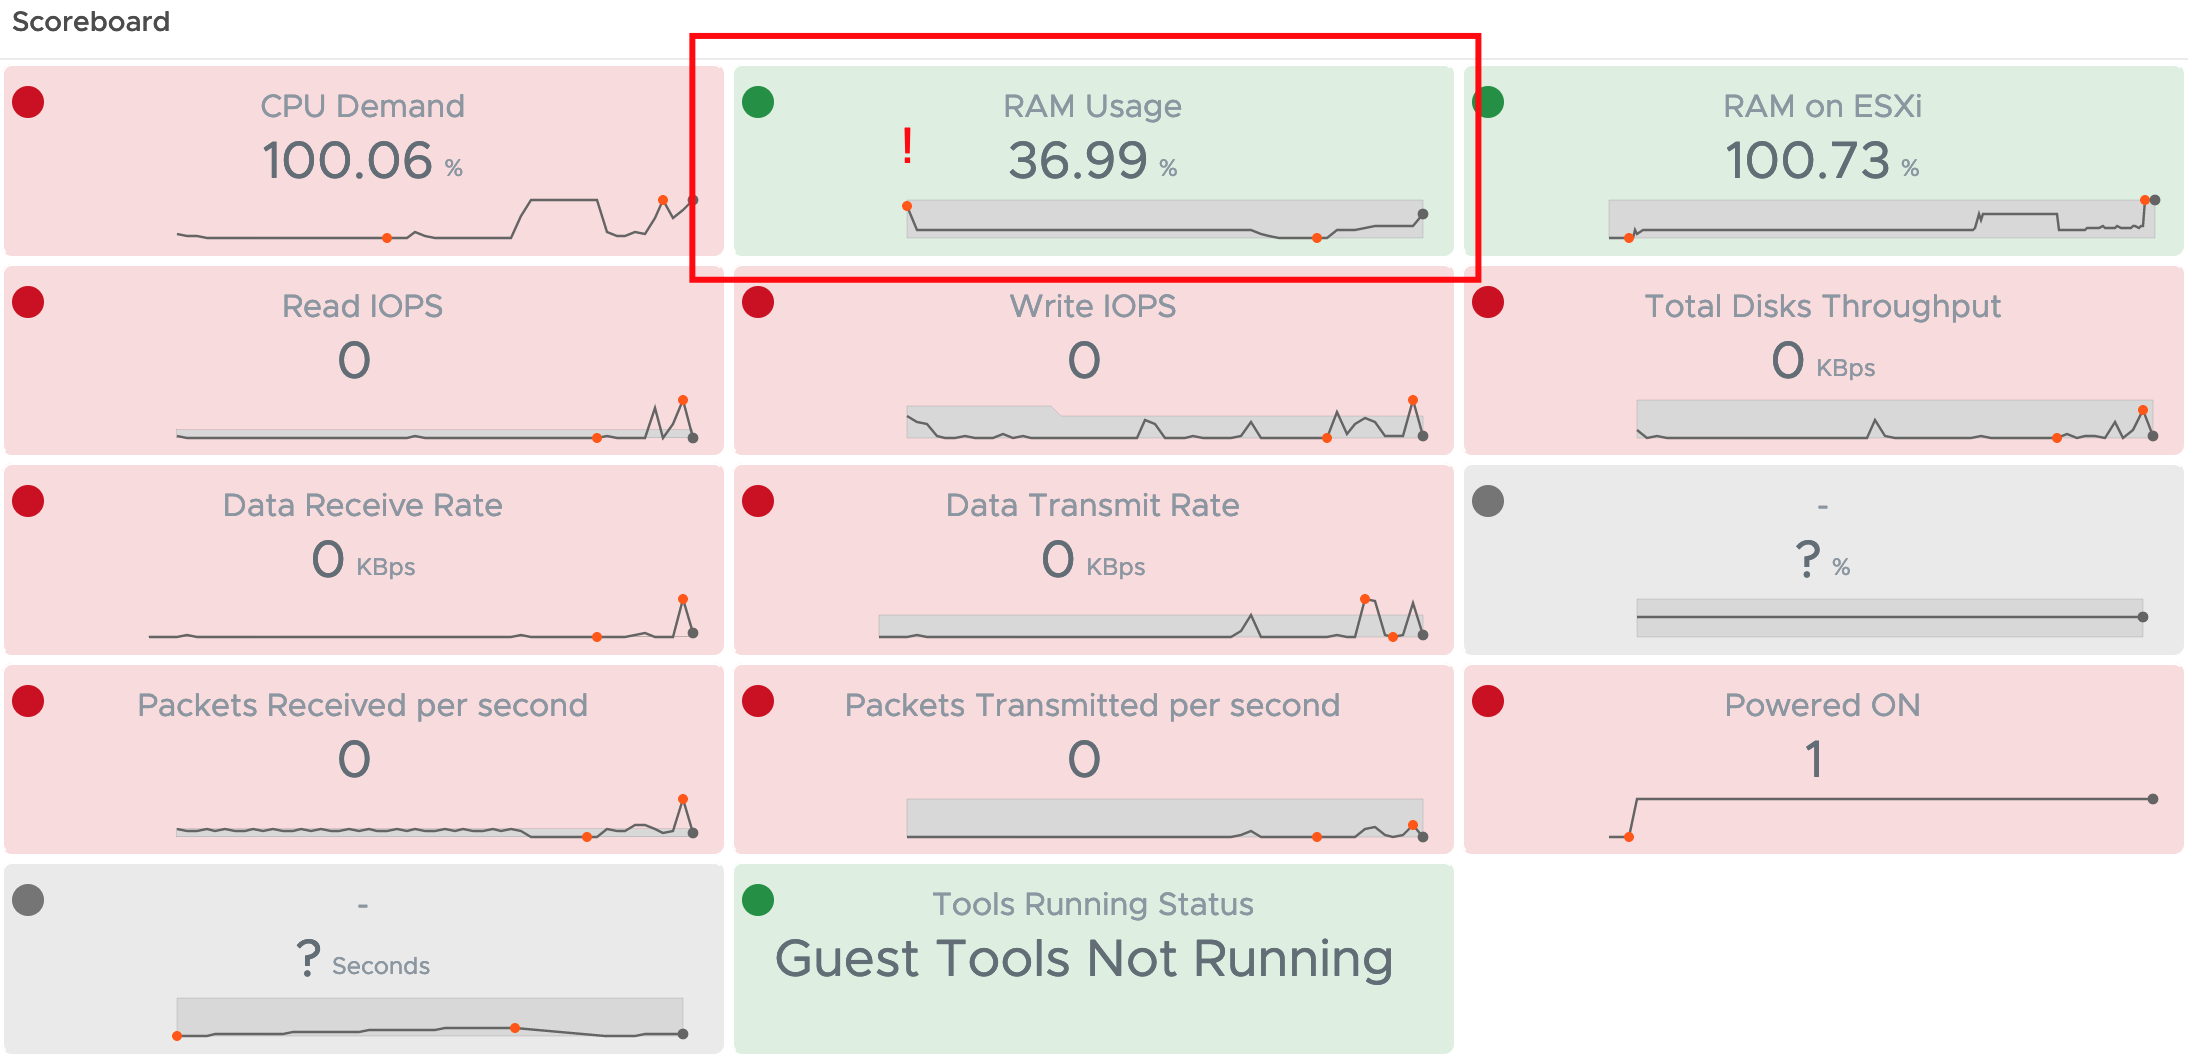
A nice option is, to retain one of the examples as with one click apply the custom settings to all your custom script metrics as shown in the following picture, obviously you will need to change the Box Label. For some reason it does not copy the unit, it has to be specified on every new metric manually.

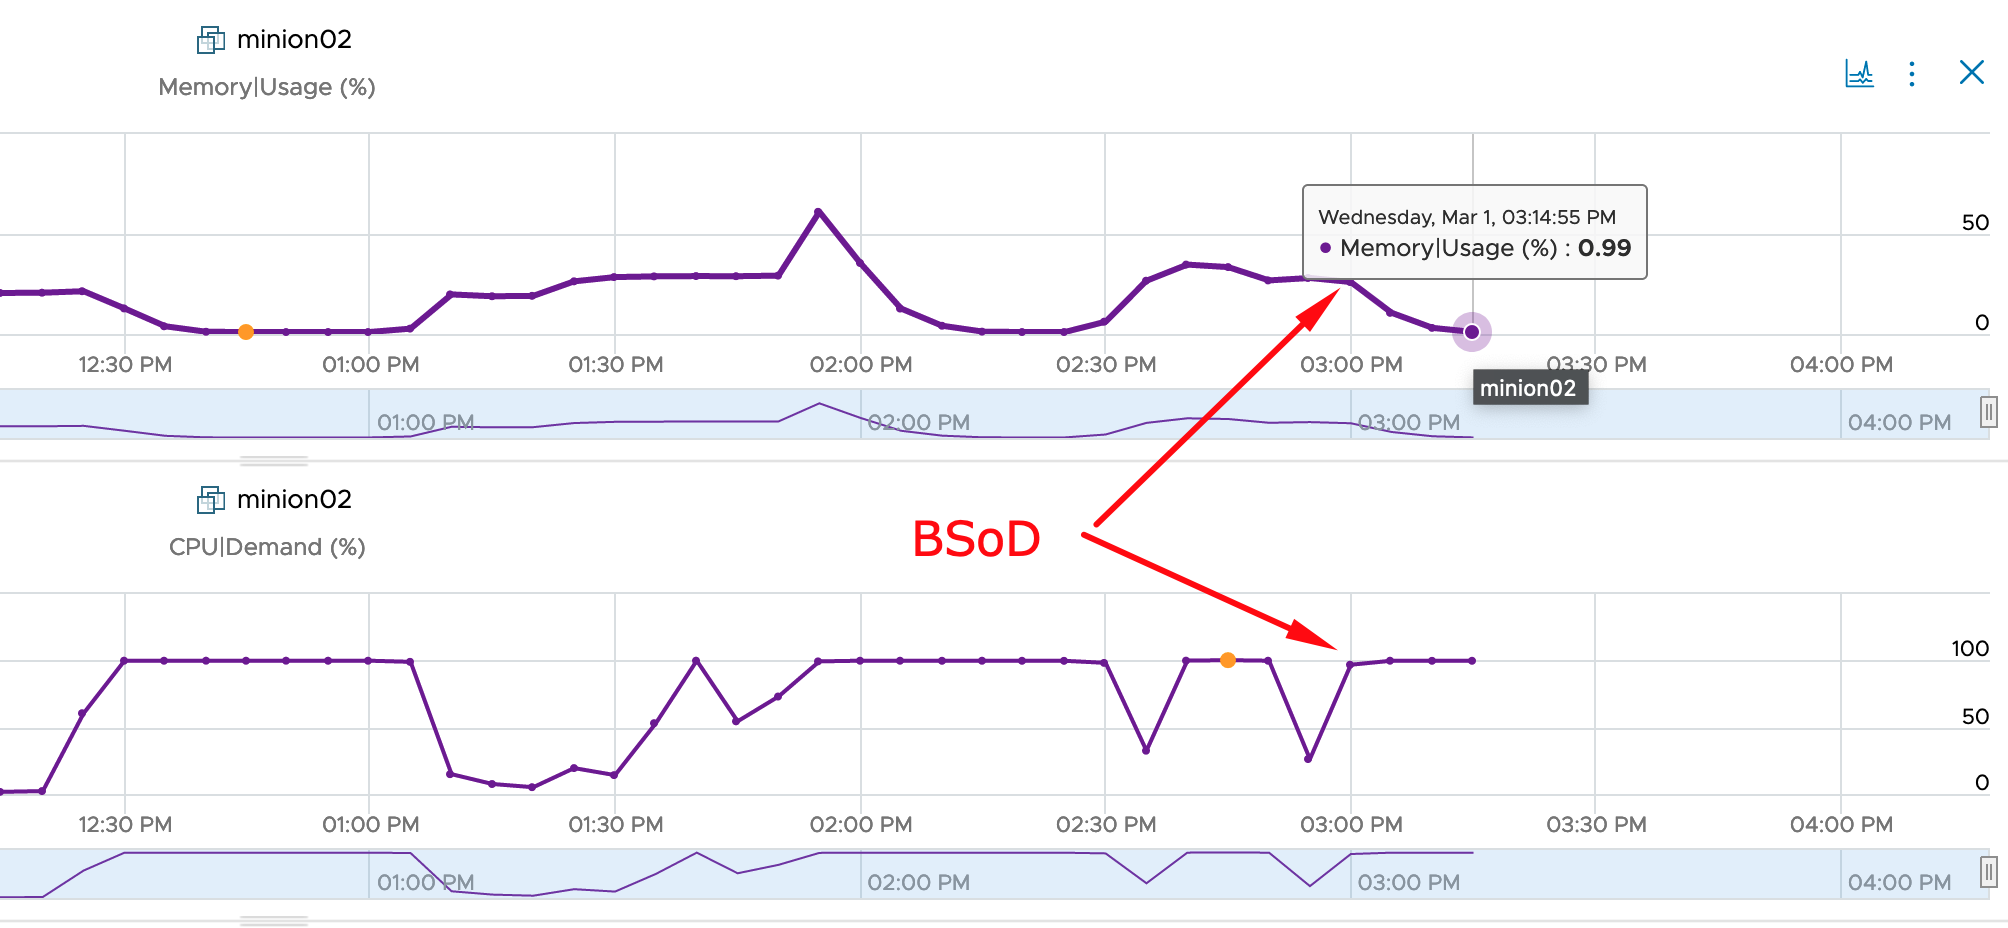
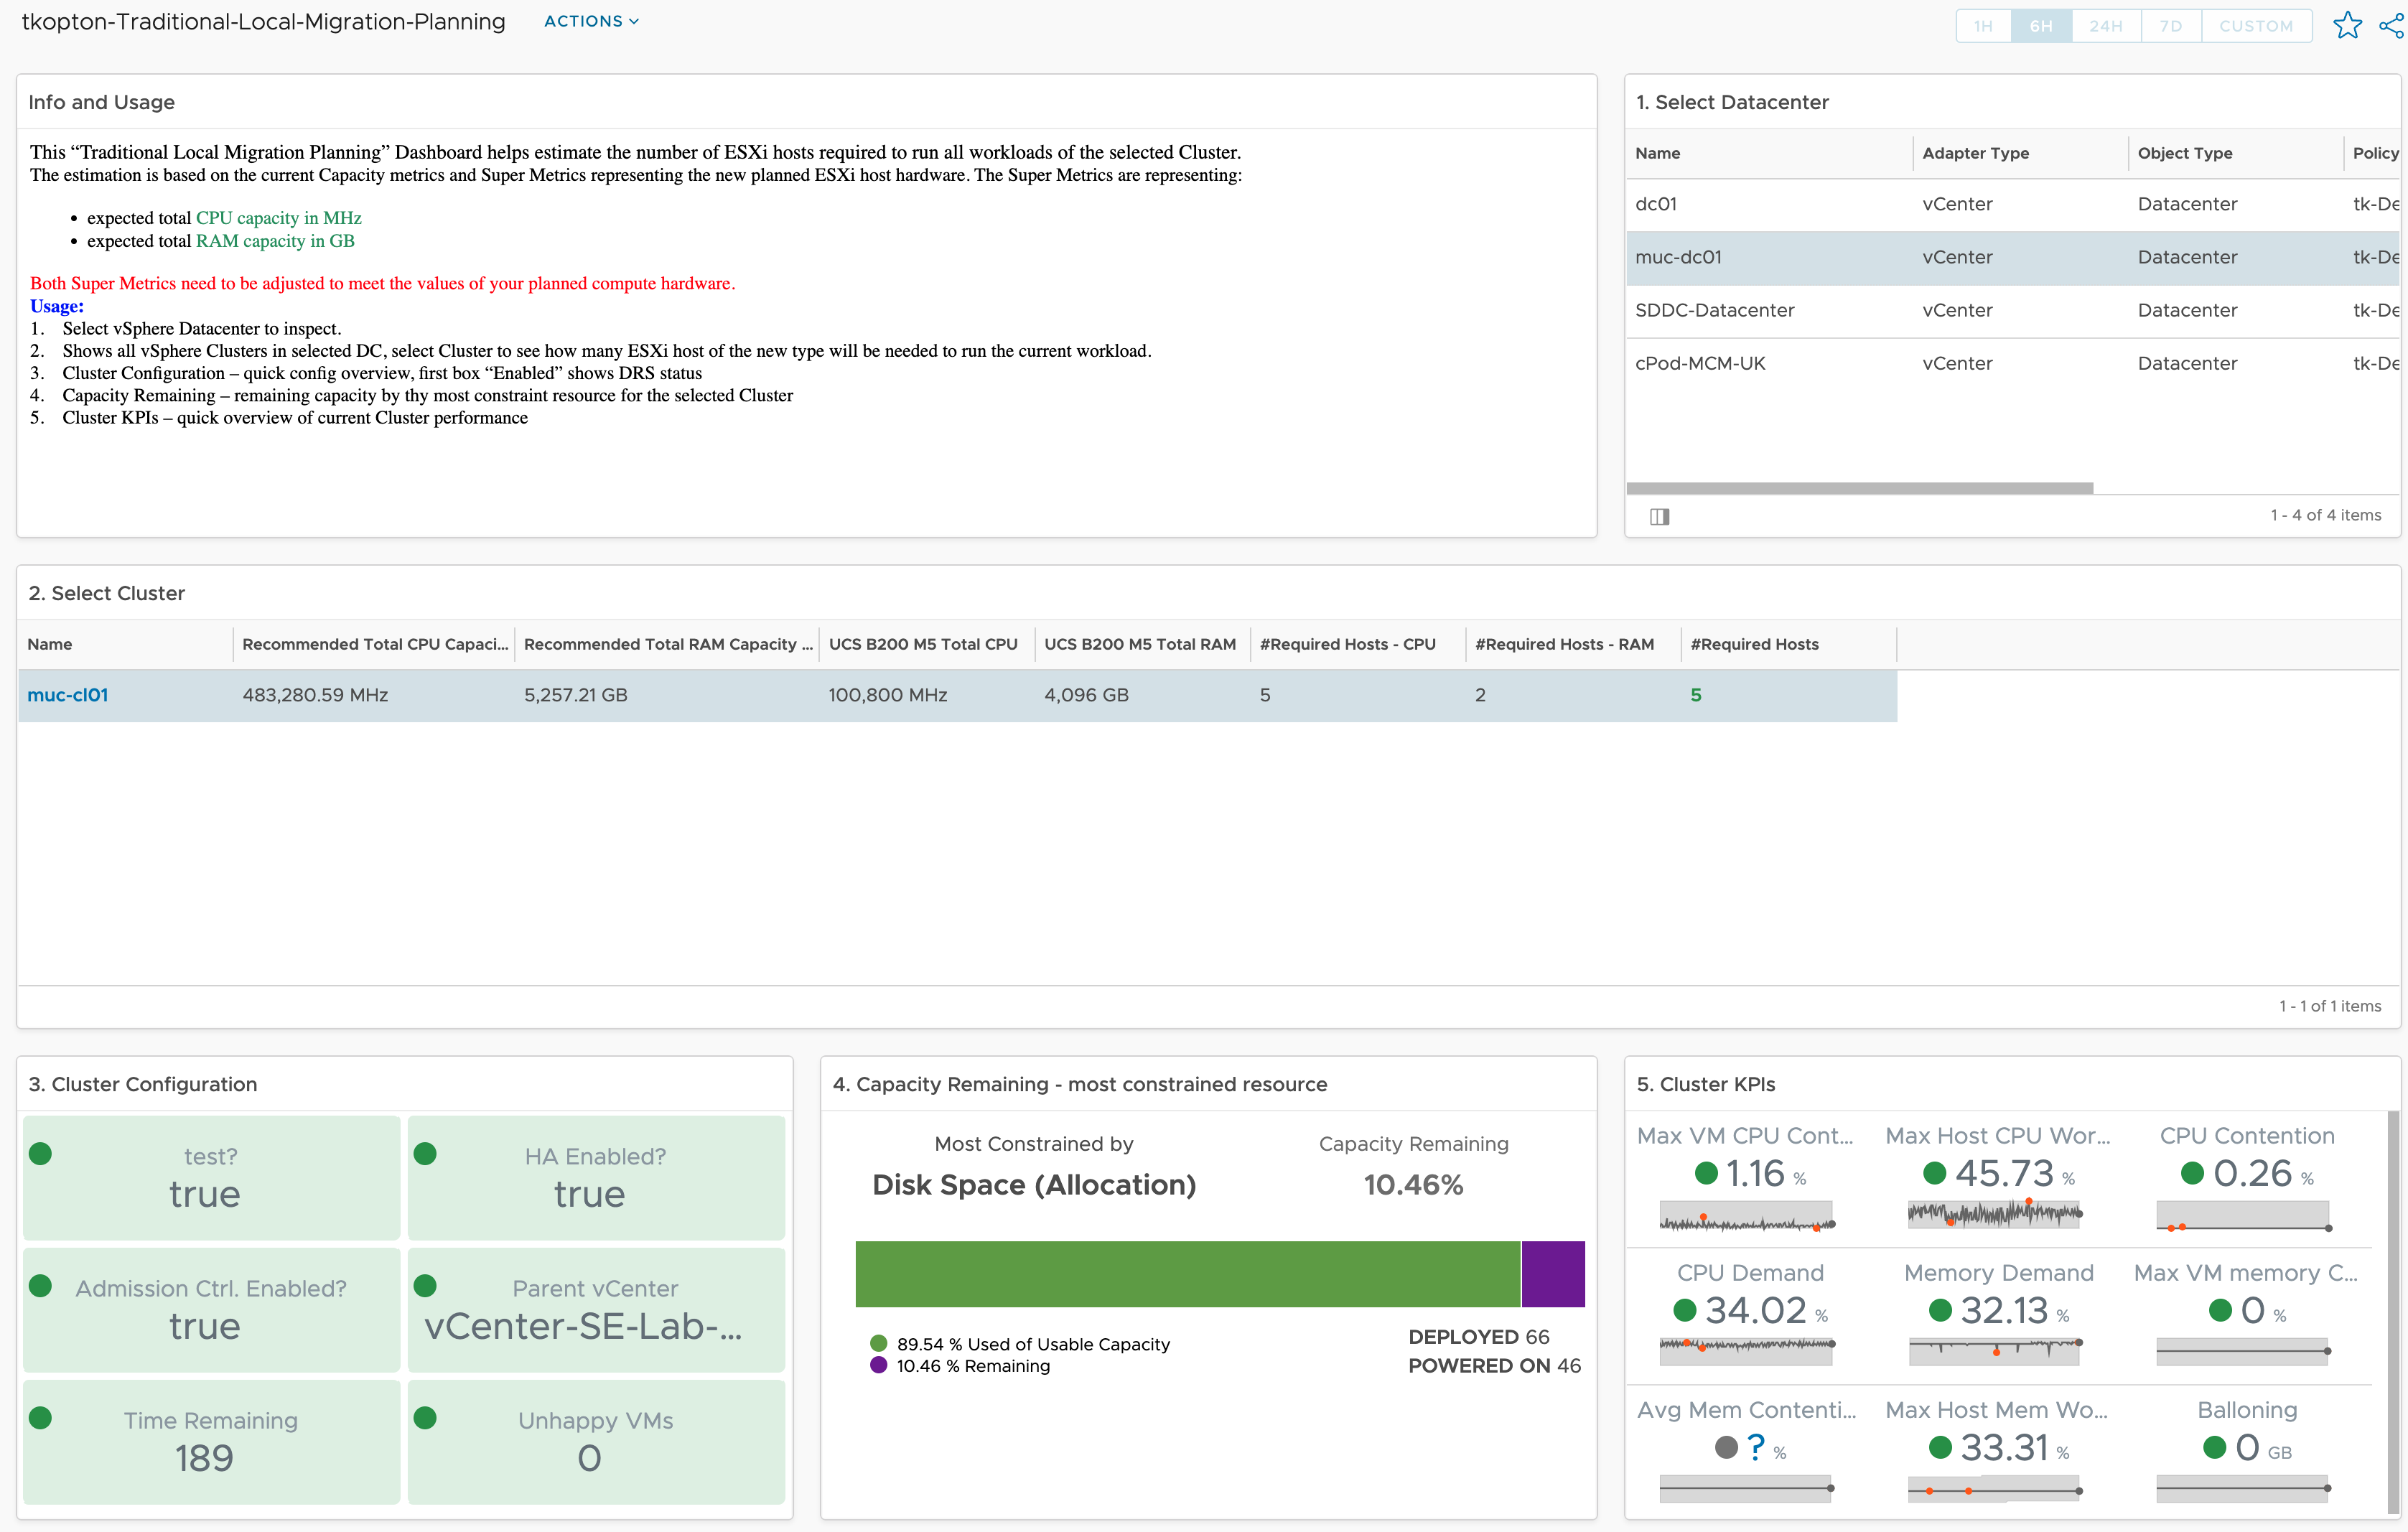
The dashboard showing is very simple but with the color coding if the widget it is easy to spot endpoints with expiring SSL/TLS certificates and take appropriate actions.
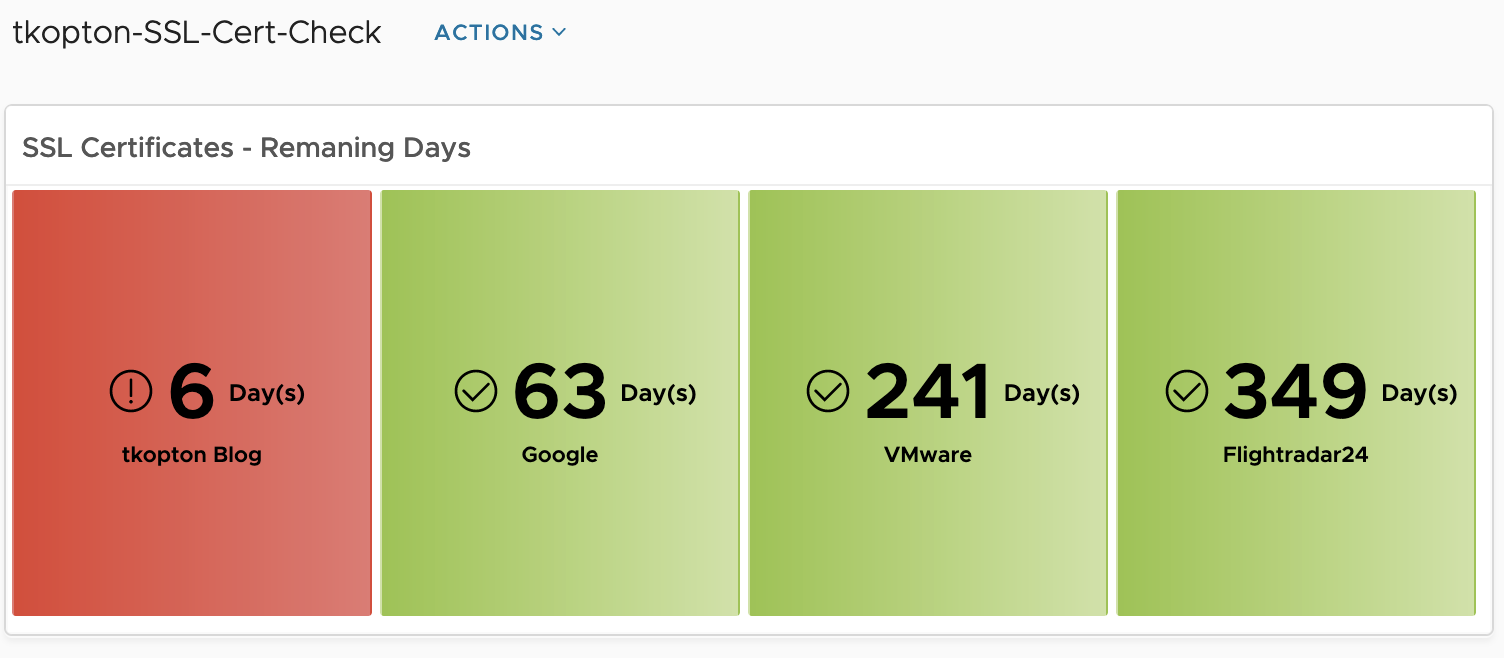
Of course you can adjust the widget settings to reflect your color coding.
Stay safe.
Thomas – https://twitter.com/ThomasKopt