Motivation
In my last post, I have described how to ingest power consumption data provided by the vzlogger project into vRealize Log Insight and how to extract the actual metrics from the log message.
That setup is working since days as expected but the primary use case for vRealize Log Insight is intelligent logging and analytics of structured, semi-structured and unstructured messages.
In my electric power consumption use case I am interested in collecting and analyzing time-series data in real-time.
And this is exactly the use case for Wavefront by VMware:
https://tanzu.vmware.com/observability
Logical Design
The logical design id fairly simple, only three components are needed:
- Wavefront SaaS access
- Wavefront Proxy – your on-premises part of the Wavefront solution
- Log data source – in my scenario it is still by Raspbian providing the data via rsyslog
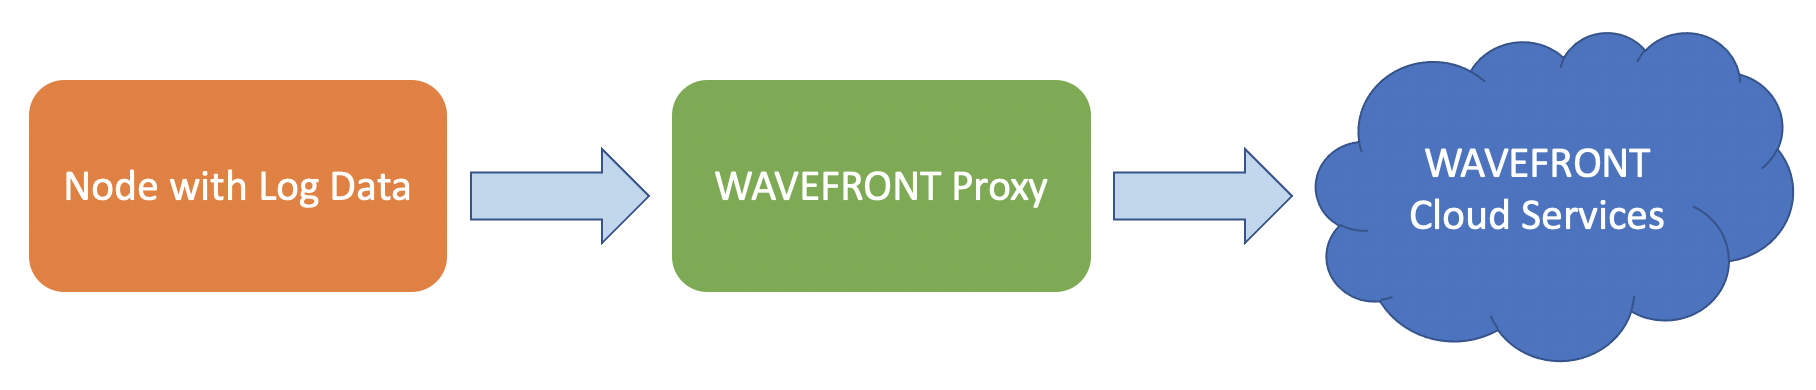
In my setup is rsyslog sending the messages every 5 seconds to the proxy and the proxy is sending the extracted metric(s) to the SaaS Wavefront endpoint.
The actual installation and configuration consists of three steps:
- Wavefront Proxy installation
- Wavefront Proxy configuration
- rsyslog configuration
Wavefront Proxy
The installation of the proxy is basically one simple step. In the Wavefront UI a click on “ADD NEW PROXY” shows details on how to install the proxy as:
- Linux installation
- Windows installation
- Mac installation
- Docker image

I have installed my proxy on a Ubuntu 18.04 server VM using the command provided by Wavefront UI which includes an auto-generated API token.

The proxy automatically connects to the Wavefront service and is ready for forwarding metrics to the cloud.
What is missing now, is the proper configuration to receive log messages and extract the actual time series data I would like to have collected in Wavefront.
Log Ingestion Config
Now it’s time to configure the required integration. Wavefront supports a large number of integrations. One of them is the Log Data Integration.

If you have never worked with e.g. Logstash or any other solution using grok patterns, that might be de most challenging part of the setup.
First part of the proxy config is easy, we enable the proxy to listen for log messages coming in either via Filebeat or raw TCP. This is the corresponding part of my proxy config file
/etc/wavefront/wavefront-proxy/wavefront.conf
#### LOGS TO METRICS SETTINGS #####
## Port on which to listen for FileBeat data (Lumberjack protocol). Default: none
filebeatPort=5044
## Port on which to listen for raw logs data (TCP and HTTP). Default: none
rawLogsPort=5045
## Maximum line length for received raw logs (Default: 4096)
rawLogsMaxReceivedLength=4096
## Maximum allowed request size (in bytes) for incoming HTTP requests with raw logs (Default: 16MB)
rawLogsHttpBufferSize=16777216
## Location of the `logsingestion.yaml` configuration file
logsIngestionConfigFile=/etc/wavefront/wavefront-proxy/logsingestion.yaml
The second part is to have a working log insgestion config file, in my case:
/etc/wavefront/wavefront-proxy/logsingestion.yaml
“Working” means not only accepted by the proxy but also and even more important, extracting the metric(s) we want to forward to Wavefront.
At the moment I am interested in the current electric power consumption. This is the red highlighted value in the set of the vzlogger messages:

Time for the grok patterns. The task is to extract the electric power consumption value. To test grok patterns with my log messages as input I have used:
http://grokdebug.herokuapp.com/
Finally I came up with this pattern and the log ingestion proxy configuration.
Pattern:
[%{MONTH} %{MONTHDAY} %{TIME}][%{WORD}] %{WORD}: id=1-0:1.7.0%{GREEDYDATA} value=%{BASE16FLOAT:currConsumption} ts=%{NUMBER}
Resulting config, /etc/wavefront/wavefront-proxy/logsingestion.yaml
Please not, it is yaml, so you need to preserve the 2 spaces for indentation.
aggregationIntervalSeconds: 5  # Metrics are aggregated and sent at this interval
gauges:
  - pattern: '\[%{MONTH} %{MONTHDAY} %{TIME}\]\[%{WORD}\] %{WORD}: id=1-0:1.7.0%{GREEDYDATA} value\=%{BASE16FLOAT:currConsumption} ts=%{NUMBER}'
    metricName: 'myCurrConsumption'
    valueLabel: 'currConsumption'
rsyslog Config
The last step is to re-configure rsyslog to send the messages to the proxy or as I did to the Wavefront proxy and to vRealize Log Insight. This is my rsyslog config file after adding the second target.
$ModLoad imfile

$InputFileName /var/log/vzlogger/vzlogger.log
$InputFileTag vzlogger
$InputFilePollInterval 10
$InputFileSeverity info
$InputFileFacility local3
$InputRunFileMonitor
# my local Wavefront proxy
local3.* @@192.168.0.137:5045

$InputFileName /var/log/vzlogger/vzlogger.log
$InputFileTag vzlogger
$InputFilePollInterval 10
$InputFileSeverity info
$InputFileFacility local3
$InputRunFileMonitor
# my vRealize Log Insight instance on VMC
local3.* @@xxx.xxx.xxx.xxx:yyyy
Results
Wavefront UI displays the collected real-time data and offers a wide range of functions and transformation for data analytics.
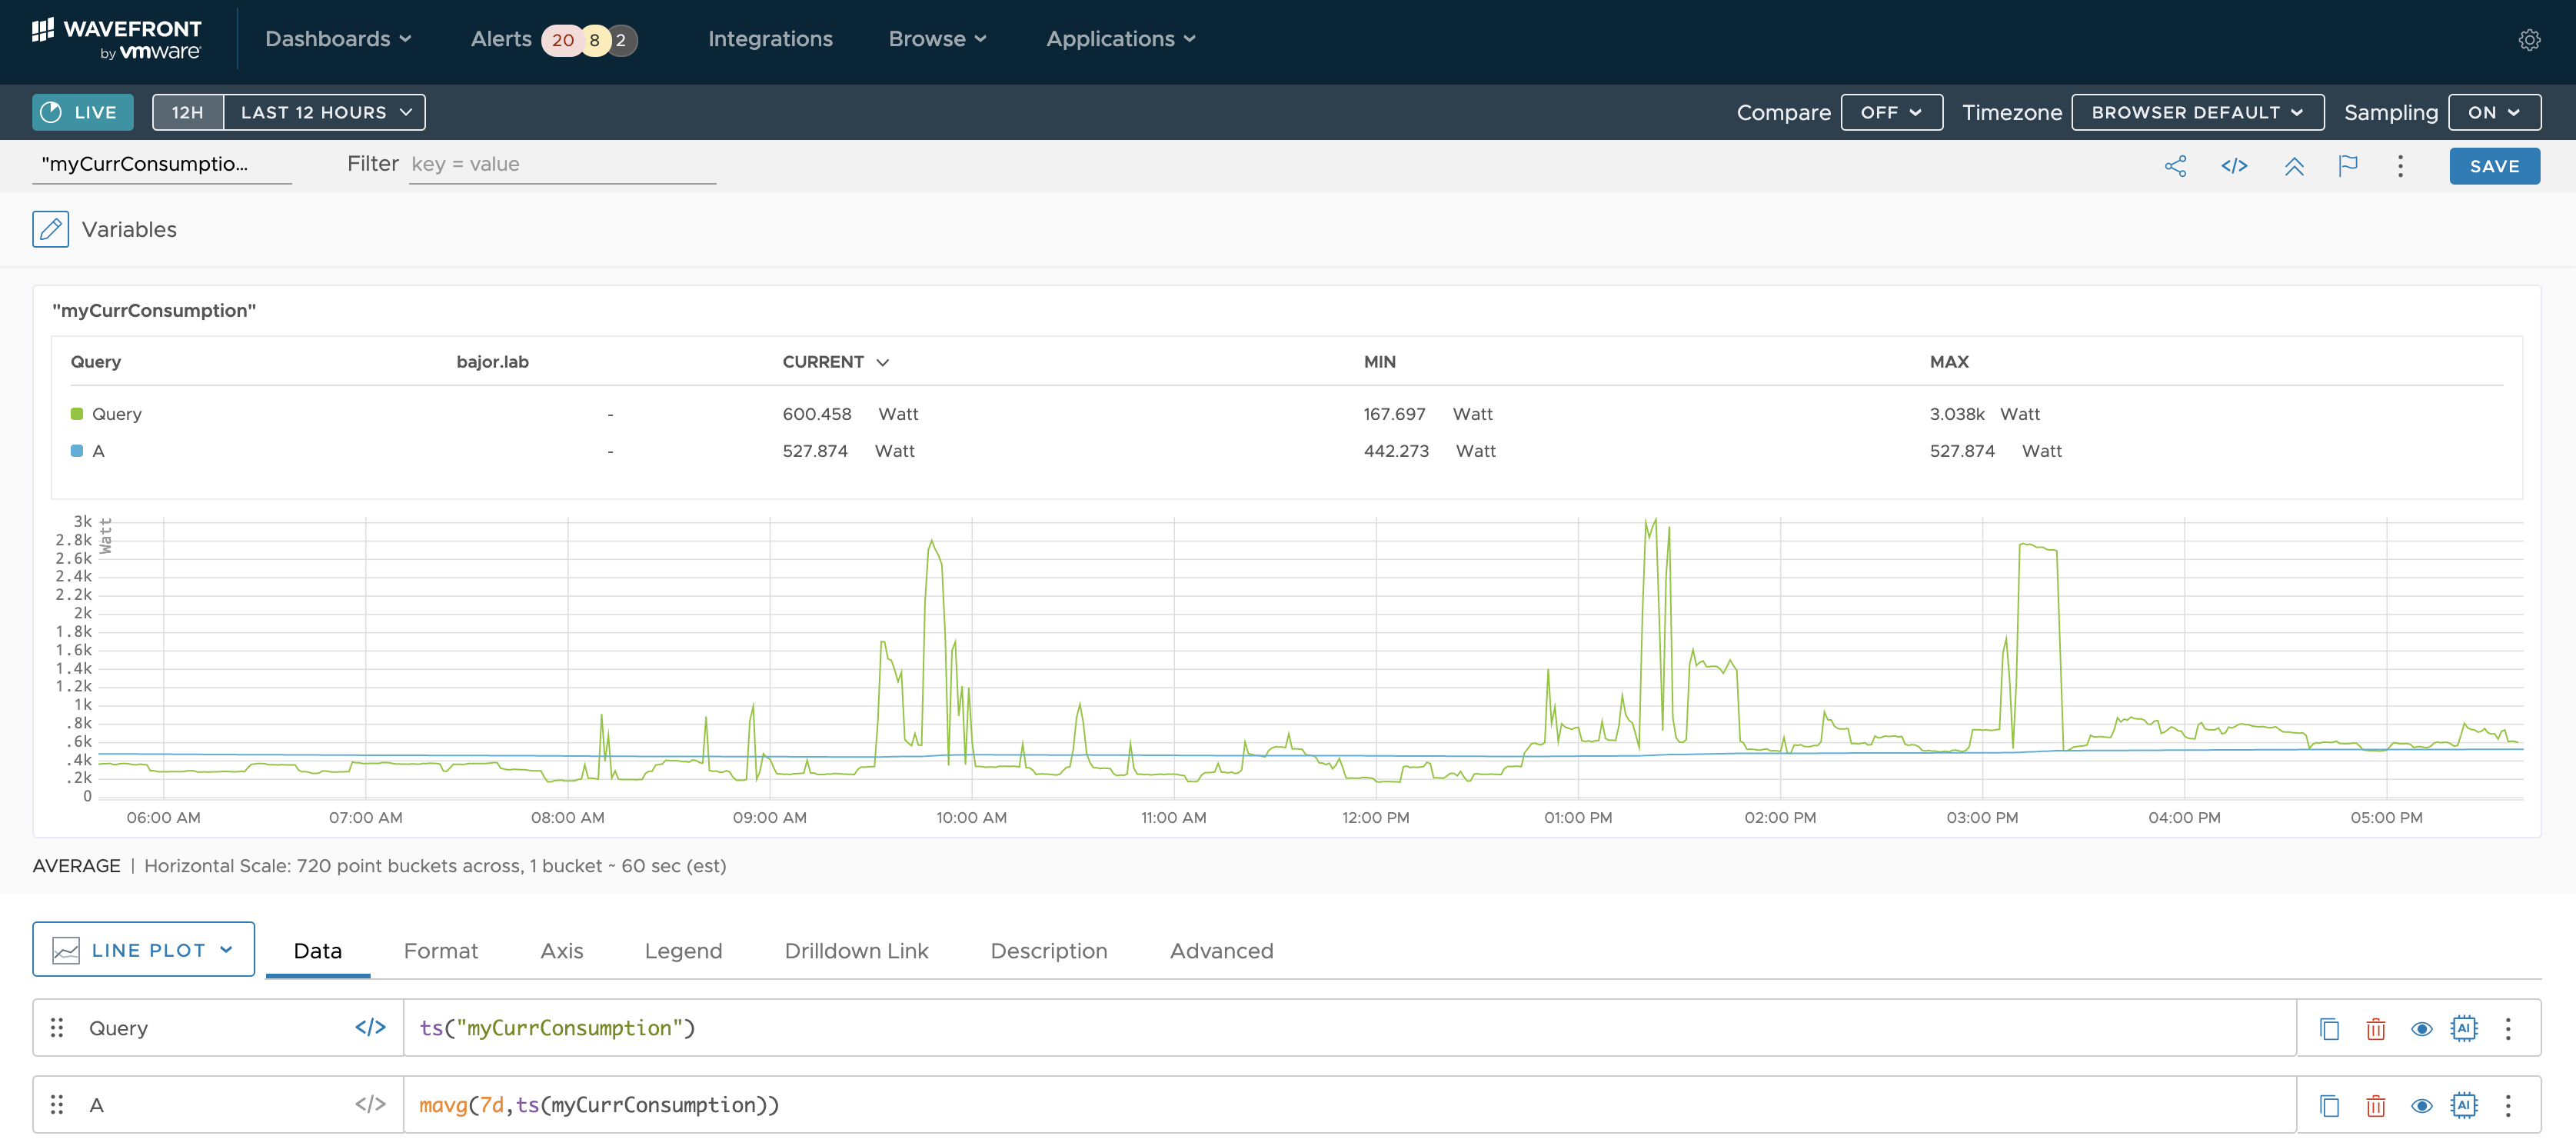
As my proxy is running as a VM on my laptop I will need to move it to something more reliable:-) Once I have collected more data points and added another metrics provided by vzlogger I am going to play around with the WQL – the Wavefront Query Language.
Outlook
Next challange is to collect the data using vRealize Operations.
Stay safe.
Thomas – https://twitter.com/ThomasKopton