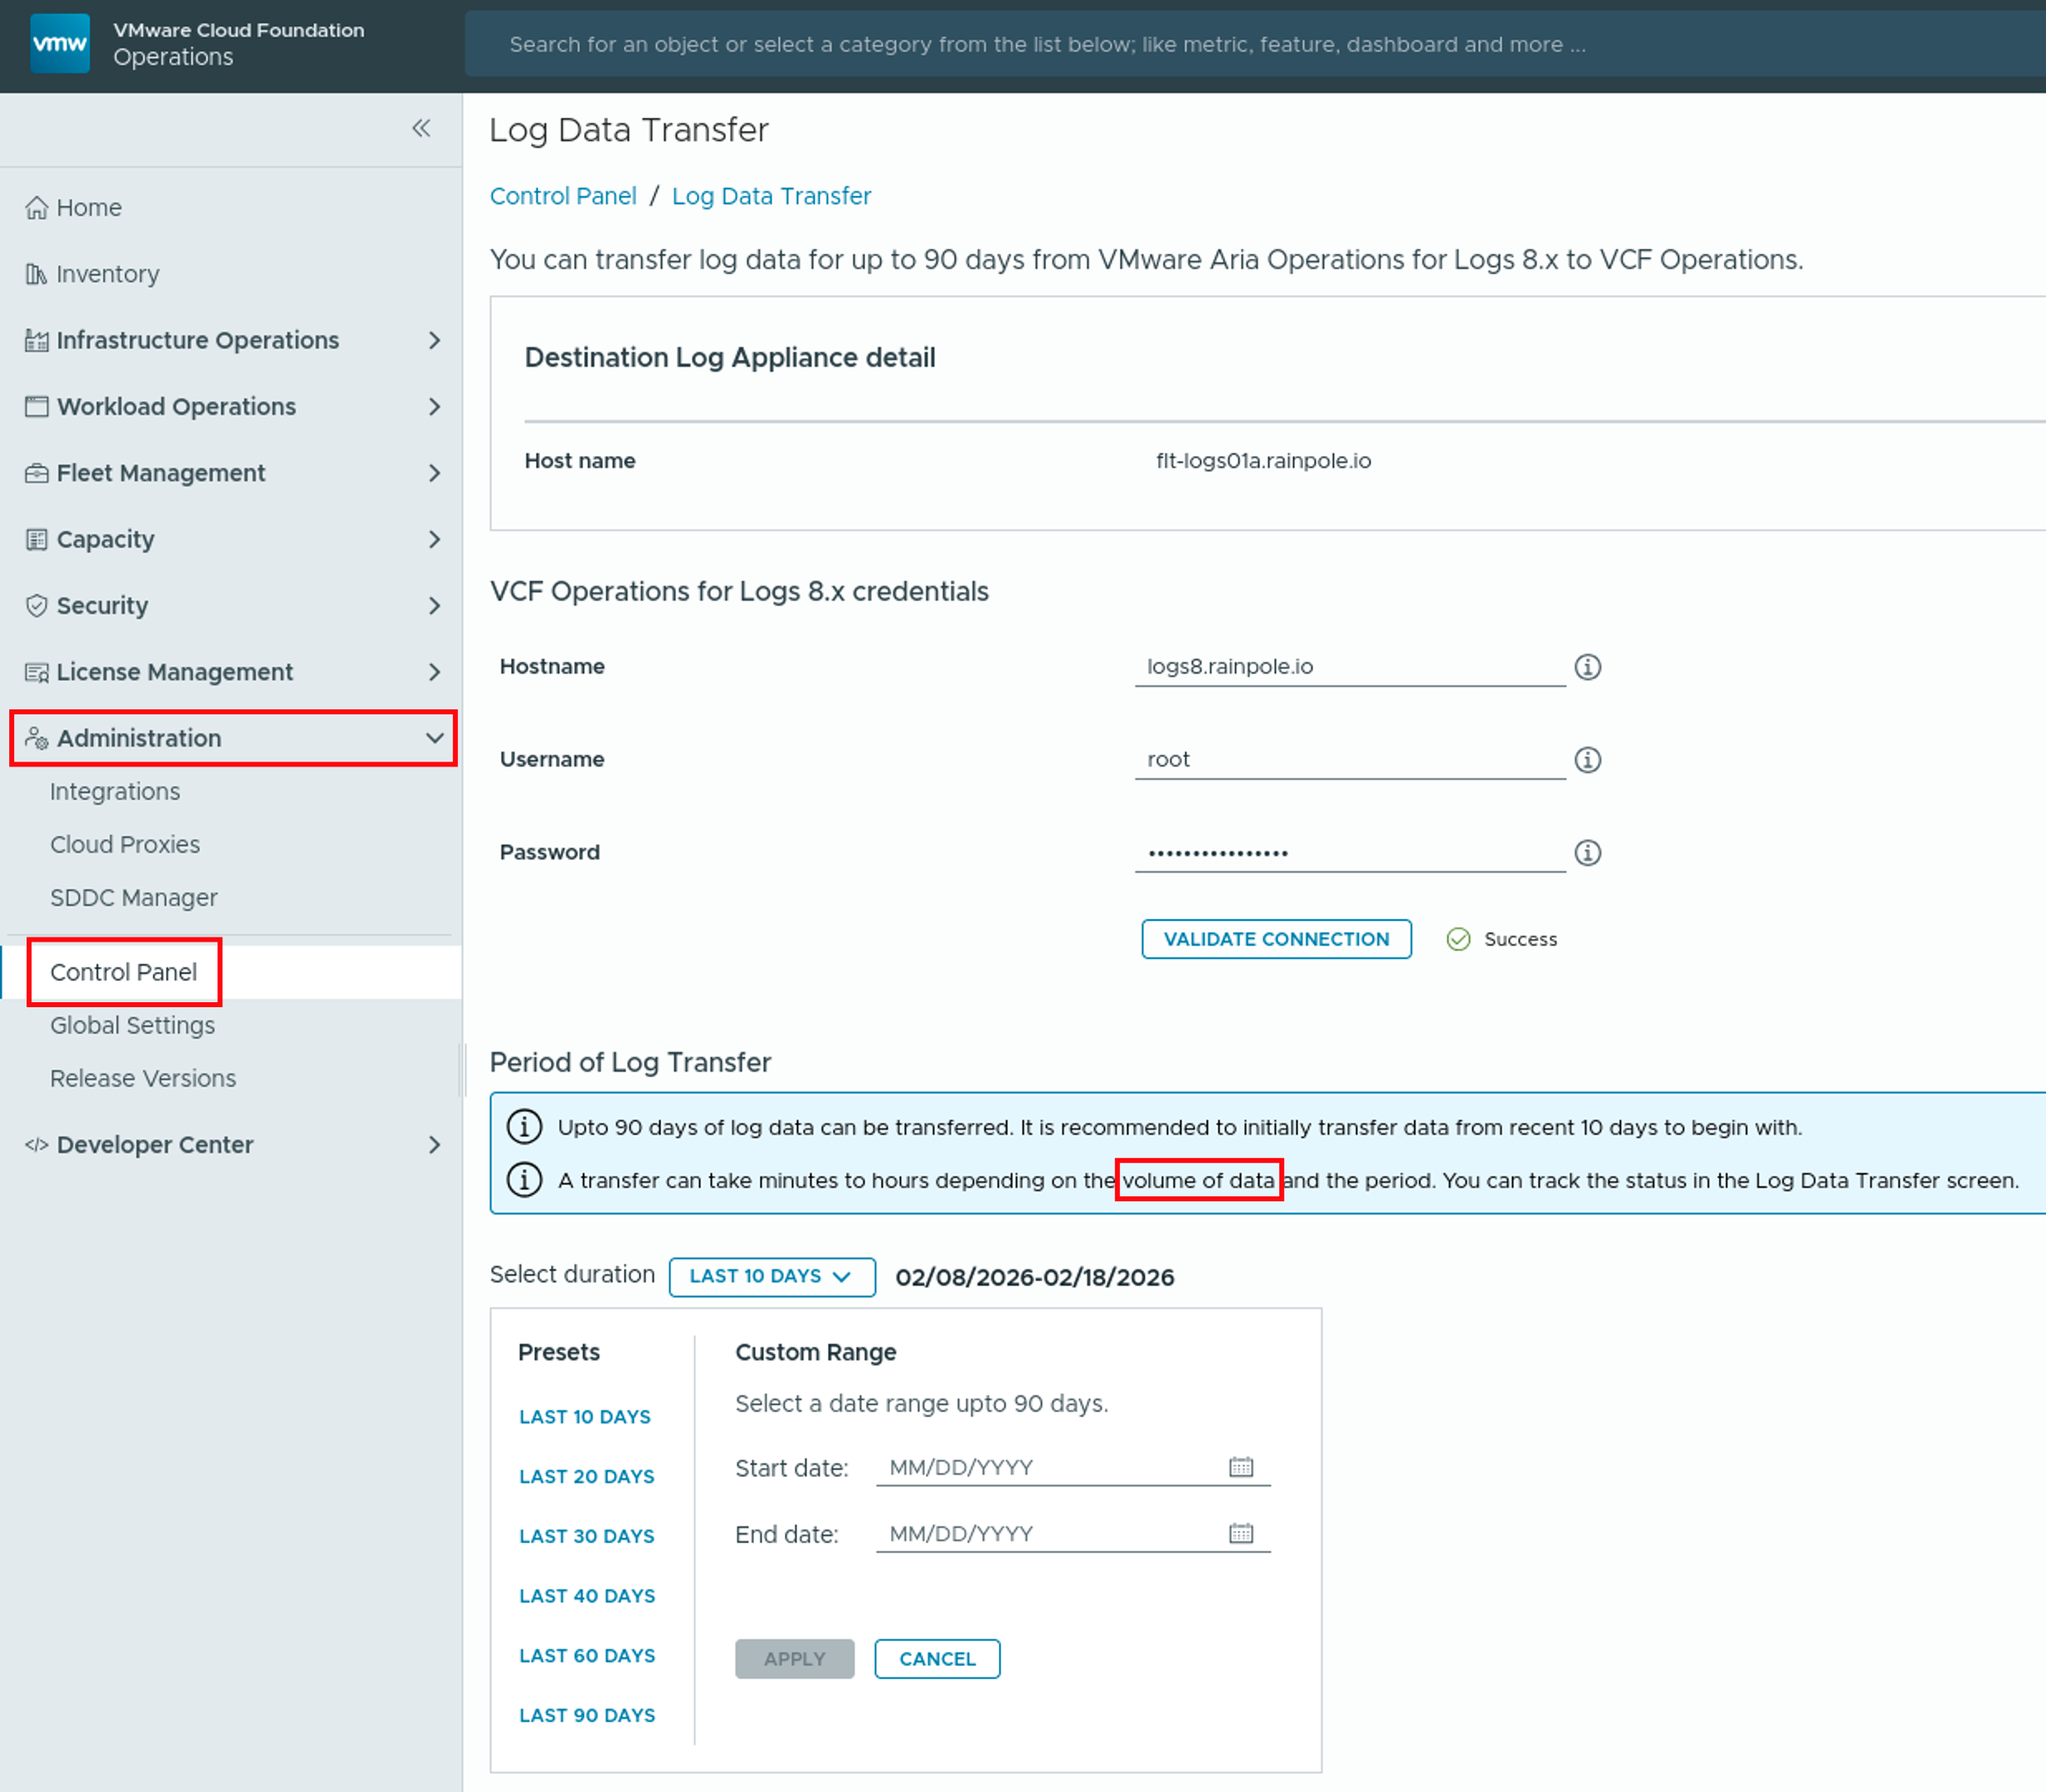
Aria Operations for Logs – Fields as Part of Alert Title – Quick Tip

As described in the official VMware Aria Operations for Logs (formerly know as vRealize Log Insight) documentation, you can customize alert names by including a field in the format ${field name}.

For example in the following alert definition which will be triggered by VM migration operations the title will contain the name of the user who started the migration process.

Figure 01: Sample alert definition containing a field.

The following screenshot shows the email I have received after starting a VM migration in vCenter. The ${vmw_user} field has been replaced by its value.

Figure 02: Alert via email containing the value of the field.

This kind of adding additional information to the alert title works pretty well in most cases but sometimes you might discover unusual behavior and the configured field name will not be replaced by its actual value.

The reason for this, at least at the time of writing this post, is the way how Aria Operations for Logs processes the static fields. For example let us create our own static fields using Postman and push them via API as meta data together with the log message. The next picture shows a log message with some fields defined in the POST body. Please not the upper and lower case characters in names of the fields.

Figure 03: Sending a log message including static fields via REST API.

NOTE: This is the behavior as for the time of writing this post and using Aria Operations for Logs Version 8.14.1-22806512

The first important fact is that the names of the fields I have defined in the JSON body are all written in lower case after the ingestion in Aria Operations for Logs.

Figure 04: Ingested log message and its fields in the log explorer.

Let’s create an alert based on the myoperation Contains "poweroff" query. In the following picture you can see that the field in the query definition is also provided containing all lower case letters.

Figure 05: Alert definition without any fields in the alert name.

This alert definition works as expected, the next time my Aria Operations for Logs has received such a log message, the alert has been triggered and I have received this email:

Figure 06: Alert received – no issues.

As I would like to see the VM name right in the alert name, I will add the corresponding myvmname field to it:

Figure 07: Alert definition with a field in the alert name – all lower case.

This time I have received an email and to my surprise, the field was not replaced by the actual value.

Figure 08: Alert received – field has not been replaced by its value.

After few tests I have figured out that Aria Operations for Logs expects the field names in the same lower and upper case writing as they were specified in the originating log message to correctly replace them by their values in the title and btw. also in the description. The following picture shows my final alert definition including the fields myVMname in the title and myUsername in the description.

Figure 09: Final alert definition including fields in the alert name and alert description.

This time the received email shows the values instead of the field names.

Figure 10: Alert received – no issues – again.

I hope it helps you create alerts that provide useful information at first glance.

Stay safe.

Thomas – https://twitter.com/ThomasKopton

vRealize Log Insight and Direct Forwarding to Log Insight Cloud

Since the release of vRealize Log Insight 8.8, you can configure log forwarding from vRealize Log Insight to vRealize Log Insight Cloud without the need to deploy any additional Cloud Proxy. It is the Cloud Forwarding feature in Log Management, which makes it very easy to forward all or only selected log messages from your de-centralized vRLI instances into a centralized vRealize Log Insight Cloud instance.

Setup procedure

Create an API Key in vRealize Log Insight Cloud

As usual for SaaS, the first thing we need is an API access key. That key is quickly generated in the API Keys section in vRealize Log Insight Cloud.

Figure 01: Generating API Key in vRLI Cloud.

Once we have generated the key, we can copy it as well as the URL which we will need to set up the Cloud Forwarding in vRLI later on.

Figure 02: API Key and the target URL in vRLI Cloud.
Configure Cloud Forwarding in vRLI

With the API Key and the URL, we can set up the Cloud Forwarding in vRealize Log Insight. The Cloud Forwarding option is one of the features of vRLI Log Management. A click on New Channel opens the forwarding configuration dialog.

Figure 03: New Channel – Cloud Forwarding configuration.

Alongside the name, key and URL of the new channel, we can also specify:

  • Tags we want to add to every forwarded log message to easily filter for certain sources in the target vRLI Cloud instance. In my example, I am tagging the messages according to the originating environment.
  • Filter to exactly specify which log messages should be forwarded to vRLI Cloud. In my example, I am forwarding all vRealize Operations messages to vRLI Cloud.
Figure 04: New Channel options.
Read Only Forwarding Option

If you activate the Read Only toggle button, vRealize Log Insight acts as a relay and does not store or index the logs forwarded to vRealize Log Insight Cloud. This option can be used to decrease the load on the on-premises vRealize Log Insight and save disk space.

Figure 05: Read Only forwarding option.
Browsing Logs in vRLI Cloud

Once forwarded to vRealize Log Insight Cloud we can use all Cloud features, like Live Trail to inspect the log messages.

Figure 06: Forwarded log messages in vRLI Cloud.

Stay safe.

Thomas – https://twitter.com/ThomasKopton

vRealize Log Insight Daily Disk Consumption – Quick Tip

Recently I was asked how to quickly estimate the vRealize Log Insight (vRLI) data usage per day and I have checked several, more or less obvious, approaches.

Usually, this question comes up when a customer is either re-designing the vRLI cluster or migrating to the vRealize Log Insight Cloud instance. To answer that question we first need to specify what “data usage” means.

Data usage on disk is certainly the most important metric when you need to size your instance. The first idea was to use the vRLI System Monitor and evaluate the IOPS statistics – Bytes Written metric. In the example shown in the next picture, we have a value of around 13MB/s on average which would mean almost 1TB per day of written data! In my environment that cannot be correct. Firstly it is an average, secondly, it’s IOPS, which means not every byte written means data being stored, update and delete ops are also written data.

Figure 01: vRLI System Monitor – Bytes Written.

The number is still very valuable as you usually need the IOPS information to size your storage backend, but it does not help with the data usage on disk.

Next idea was to leverage vRrealize Operations (vROps) to estimate the daily usage or daily incoming data. In vROps you simply go to the vRLI node(s) and check the Guest File System usage. Unfortunately, that does not work if the disk is already at 97% of the usage as at this point vRLI will start deleting old buckets and you will see frequent drops and not a continuously increasing metric value. That approach also may not work if you have created various index partitions with different retention periods and vRLI is frequently removing data. In the next figure, you see the file system usage in case the file system is already breaching the 97% threshold.

Figure 02: vRLI file system usage monitored by vRealize Operations.

As long as the file system is way below 97% and there is only one index partition configured, this vROps number, or more specifically the difference between the value at day_n and day_n-1, will give you a pretty good estimation.

All that means is we need something more accurate.

And here it comes. Working on System Alerts I have coincidentally discovered that the Repository Retention Time system alert will give you exactly the number you need. To trigger that alert you simply configure the threshold to a number that will be breached and you will get your information.

Figure 03: vRLI Retention Notification settings.

After the next evaluation (once every 24hrs) you will receive an email with the needed numbers. In the next figure, you see, that my vRLI instance consumes around 10GB per day. I have received that message for the next 2 days and the number remains stable at around 9.8 – 9.9 GB/day.

Figure 04: Disk consumption per day information.

I hope that helps you size your vRLI when for example migrating to vRealize Log Insight Cloud.

Stay safe.

Thomas – https://twitter.com/ThomasKopton

Quick Tip – Programmatically Update vRealize Log Insight Webhook Token

The Webhook feature in vRealize Log Insight is a great way to execute automation tasks, push elements in a RabbitMQ message queue or start any other REST operation.

Many endpoints providing such REST methods require a token-based authentication, like the well-known Bearer Token. vRealize Automation is one example of such endpoints.

It is pretty easy to specify that kind of authentication in vRealize Loginsight Webhook, the only thing you need to do is to add the Authorization header and set its value to Bearer xyz... .

Figure 01: Authorization header in vRLI webhook.

The problem with such tokens is their expiration. Usually, such tokens are valid only for a certain time period and need to be refreshed.

How to get a new token from vRealize Automation is not the subject of this post, we assume we have a new token, let’s say it is abcd1234. Now we need to update that value in vRLI.

We use the vRealize Log Insight REST API to update the Webhook configuration which contains the headers.

Before we can do that, we need the Bearer Token for the vRealize Log Insight REST API. This is the curl command to retrieve the token:

curl --location --request POST 'https://$VRLI-FQDN/api/v2/sessions' --header 'Accept-Encoding: application/json' --header 'Content-Type: application/json' --data-raw '{ "username": "admin", "password": "secret", "provider": "Local"}'

The response contains the token we use for any other subsequent REST API call (I have changed the token for better visibility):

{
    "userId": "2338ddb2-xxx-yyy",
    "sessionId": "123456789assdfg",
    "ttl": 1800
}

Now we have everything we need to update the Webhook configuration to include a new vRealize Automation token, abcd1234. This is a two-step process.

First, we need the ID of our Webhook. This is the REST call to retrieve all webhooks:

curl --location --request GET 'https://$VRLI-FQDN/api/v2/notification/webhook' \
--header 'Accept-Encoding: application/json' \
--header 'Content-Type: application/json' \
--header 'Authorization: Bearer 123456789assdfg' \

From the (truncated) response we extract the ID of the Webhook we would like to modify. Please be aware that the output JSON will contain separate sections for every Webhook in your vRealize Log Insight:

{ "id": "96211daa-4391-42bd-b972-52689b7eb540", "URLs": [ "https://$VRLI-FQDN/codestream/api/pipelines/db1259ea-e4ea-4a91-89fc-70a3b5a2004b/executions" ], "destinationApp": "custom", "contentType": "JSON",

Second, we can now use a PUT REST call to update the webhook with the new Bearer Token for vRealize Automation.

curl --location --request PUT 'https://$VRLI-FQDN/api/v2/notification/webhook/432be7da-9876-4c9f-a11a-bb1fe131b2c4'--header 'Accept-Encoding: application/json' --header 'Content-Type: application/json' --header 'Authorization: Bearer 123456789assdfg' --data-raw '{ $BODY_FROM_PREVIOUS_RESPONSE_FOR_THE_CORRESPONDING_WEBHOOK_ID }'

The REST body is basically the content corresponding Webkook ID of the JSON output we retrieved in the Step 1 response. We just need to replace the token here:

{ "id": "432be7da-9876-4c9f-a11a-bb1fe131b2c4", "URLs": [ "https://{ "id": "96211daa-4391-42bd-b972-52689b7eb540", "URLs": [ "https://$VRLI-FQDN/codestream/api/pipelines/db1259ea-e4ea-4a91-89fc-70a3b5a2004b/executions" ], "destinationApp": "custom", "contentType": "JSON",/codestream/api/pipelines/b12c7cbd-6d83-4bef-8b31-7bb653ee01aa/executions" ], "destinationApp": "custom", "contentType": "JSON", "payload": "{\n \"comments\": \"Starting pipeline using REST - from vRLI\",\n \"input\": {\n \"messages\": \"${messages}\",\n \"TriggeredAt\": \"${TriggeredAt}\",\n \"my_systemID\": \"${ vmw_vr_ops_id}\",\n \"SourceInfo\": \"${SourceInfo}\",\n \"HitOperator\": \"${HitOperator}\",\n \"Info\": \"${Info}\"\n}\n}", "name": "tkopton-CS-Pipeline-Test", "headers": "{\"Content-Type\":\"application/json\",\"Action\":\"POST\",\"Authorization-User\":\"undefined\",\"Authorization-Password\":\"undefined\",\"Authorization\":\"Bearer abcd1234\"}", "acceptCert": false, "creatorEmail": "xxxxxxx"}

Replacing the token in the vRealize Log Insight is that simple.

Stay safe.

Thomas – https://twitter.com/ThomasKopton

vCenter Events as vRealize Operations Alerts using vRealize Log Insight

As you probably know vRealize Operations provides several symptom definitions based on message events as part of the vCenter Solution content OOTB. You can see some of them in the next picture.

Figure 1: vCenter adapter message event symptoms.

These events are used in alert definitions to raise vReaalize Operations alarms any time one of those events is triggered in any of the managed vCenter instances.

If you take a look into vCenter events in the Monitoring tab or check the available events as presented by the VMware Event Broker Appliance (VEBA) integration, you will see that there are tons of other events you may want to use to raise alerts.

Figure 2: vCenter events in VEBA plugin.

Unfortunately, this is not always as easy as creating a new message event symptom definition in vROps. Not every event is intercepted by vRealize Operations.

Now, you could of course use VEBA to run functions triggered by such events and let the functions raise alerts, create tickets, etc. This is definitely a great option and how to do that using VEBA functions and vROps is something I am planning to describe in an upcoming blog post. But there are also other ways to achieve that.

If you run vRealize Log Insight integrated with vRealize Operations in your environment, and this is a highly recommended setup, you have another, very easy option, to raise alerts on any available vCenter event, as long as that event is logged by the vCenter instance. That should be the case for all or at least the majority of the events.

In the next picture, you see all the various events I have received in my vRLI coming from vCenter in the last 48 hours. For a better visibility, I have excluded all events generated by vim.event.eventex.

Figure 3: vCenter events in vRealize Log Insight.

To search, filter, and display such events using their type I have created the following extracted field in vRLI:

Figure 4: vRealize Log Insight extracted field for vCenter events.

This extracted field makes it now easy to create alert definitions in vRLI.

Let us assume our use case is: “I need an alert every time any vSphere cluster configuration has been changed.

The corresponding event in vCenter is created by vim.event.ClusterReconfiguredEvent and send to vRLI as a log message

And this is the corresponding log message in vRLI after I have changed the DRS configuration of one of my clusters.

Figure 5: ClusterReconfiguredEvent message in vRLI.

To get such events as an alarm in vRealize Operations in general we need two things:

  • vRealize Operations integration in vRealize Log Insight. With that integration vRLI is capable of mapping vCenter objects that are sources of messages to their objects in vROps. With this feature vRLI alarms can be forwarded to vROps and attached to exactly that object which is the original source of the message received by vRLI.
  • Alarm definition in vRealize Log Inisght that will be triggered every time an event of type vim.event.ClusterReconfiguredEvent has been received and this alarm will be forwarded to vROps. For this alert definitions we will use the extracted field described in figure 4.

But there is still a little more work we need to do to implement a solution that really fulfills our requirement: get an alert every time a cluster configuration change happened.

Let us assume the following situation. Someone is changing the configuration of one or several clusters very frequently. Our vRLI alert definition looks like shown in the next picture.

Figure 6: First alert definition in vRealize Log Insight.

And if we now run a query on this alert definition we will see that vRLI is properly triggering the alarms. In the picture, we see the three alarms raised because of three changes during 10 minutes.

Figure 7: Event messages triggering alarms in vRLI.

The problem with the vROps integration is, that the first alarm will be properly forwarded to vROps and will raise an alarm on the vCenter instance but any subsequent alarm coming in will not be reflected in vROps as long as the first alarm is still in the “open” state. We see the first alarm in vROps in the next figure.

Figure 8: First alarm in vRealize Operations.

This behavior is due to the same notification event text for every alarm. In that case, vROps just assumes that the next occurrence is reporting the same issue thus there is no need to raise another, duplicate alarm. In our case the notification event text is the name of the alarm as defined in the vRLI alert definition: tkopton-ClusterConfigChanged.

To change this behavior we need to include unique information for every alarm in the alarm name.

What we can do is customize the alert name by including a field or an extracted field in the format ${field-name}.

The challenge is to find such unique information in the event log message. Let’s see what we have. This is a sample event message as received in vRLI:

2021-11-14T10:18:06.795866+00:00 vcenter01 vpxd 7888 - -  Event [9150192] [1-1] [2021-11-14T10:18:06.795507Z] [vim.event.ClusterReconfiguredEvent] [info] [VSPHERE.LOCAL\Administrator] [Datacenter-01] [9150191] [Reconfigured cluster CL01 in datacenter Datacenter-01 
 
 Modified: 
 
configurationEx.drsConfig.enableVmBehaviorOverrides: false -> true; 

configurationEx.proactiveDrsConfig.enabled: false -> true; 

 Added: 
 
 Deleted: 
 
]

It looks like every event has a unique event ID – the key property as described in the vSphere API documentation. I have created an extracted field for the event ID:

Figure 9: vRLI extracted field for vCenter EventID.

This extracted field can be now used as part of the name in the alert definition, which will make every occurrence unique in vROps. In the next picture, you can see the modified alert definition in vRLI.

Figure 10: Final alert definition in vRealize Log Insight.

Let’s do some vSphere cluster reconfigurations.

Figure 11: New event messages triggering alarms in vRLI.

And this is how it looks like in vROps after vRLI forwarded these alarms to vRealize Operations. First, we check the symptoms, see the next picture.

Figure 12: Notification event symptoms in vRealize Operations.

And here we see the corresponding alarms in vROps.

Figure 13: New alarms in vRealize Operations.

With these alarms, you could now create vROps notifications, start webhook triggered actions, parse the content and automate the remediation. Yes, especially around the alert name in vRLI using the extracted field we still have some room for improvement but the approach described here is sufficient for many use cases I have worked with.

Have fun implementing your use cases.

Stay safe.

Thomas – https://twitter.com/ThomasKopton

Energy Consumption Monitoring using SML Data and vRealize Log Insight

It all started with my last electricity bill. Shortly after I have recovered from the shock and made sure that I really do not have any aluminum smelter running in my basement, I decided, I need some kind of monitoring of my electric energy consumption.

Insights into data is the first and probably most important step in the process of taking measures to change any given situation.

My plan was to consume the available Smart Messaging Language (SML) data and following that post (sorry, it is in German only) create a real-time dashboard:

http://raspberry.tips/raspberrypi-tutorials/smartmeter-stromzaehler-mit-dem-raspberry-pi-auslesen-und-aufzeichnen

No sooner said than done and only after few steps I have realized that it will be slightly more work to let the included webserver run on the same Raspberry PI which is already running my PI-hole??.

OK, invest time to change the scripts and build the dashboard into the PI-hole web server or use another Raspberry and start over?

As I already have the data available in the vzlogger.log file why shouldn’t I use my vRealize Loginsight to display it? Sure, semantically I am dealing with time-series data here and another vRealize product would be more suitable but I wanted something quick and easy – no worries, vRealize Operations and/or Wavefront integration is already on my to-do list.

The Data

vzlogger (https://github.com/volkszaehler/vzlogger) reads the SML telegrams coming from the smart meter via serial port and stores the readings every two seconds in a log file. I have configured the log file to be: /var/log/vzlogger/vzlogger.log

[Jan 30 19:21:46][mtr0] Got 5 new readings from meter:
[Jan 30 19:21:46][mtr0] Reading: id=1-0:1.8.0255/ObisIdentifier:1-0:1.8.0255 value=38768802.85 ts=1612030906436
[Jan 30 19:21:46][mtr0] Reading: id=1-0:1.8.1255/ObisIdentifier:1-0:1.8.1255 value=15102120.00 ts=1612030906436
[Jan 30 19:21:46][mtr0] Reading: id=1-0:1.8.2255/ObisIdentifier:1-0:1.8.2255 value=23666680.00 ts=1612030906436
[Jan 30 19:21:46][mtr0] Reading: id=1-0:1.7.0255/ObisIdentifier:1-0:1.7.0255 value=386.51 ts=1612030906436
[Jan 30 19:21:46][mtr0] Reading: id=1-0:96.5.5255/ObisIdentifier:1-0:96.5.5255 value=6560.00 ts=1612030906436

Syslog Configuration

As I do not have a vRLI Agent for the ARM platform I decided to use rsyslog to send the log file entries to vRealize Log Insight.

The configuration follows the rsyslog procedures. I have simply created an appropriate file in /etc/rsyslog.d

vzlogger.conf

$ModLoad imfile
$InputFileName /var/log/vzlogger/vzlogger.log
$InputFileTag vzlogger
# $InputFileStateFile
$InputFilePollInterval 10
$InputFileSeverity info
$InputFileFacility local3
$InputRunFileMonitor
local3.* @@xxx.xxx.xxx.xxx

xxx.xxx.xxx.xxx in @@xxx.xxx.xxx.xxx is of course the IP of my vRealize Log Insight instance.

vRealize Log Insight Configuration

After restarting the rsyslog daemon the SML decoded messages start arriving in vRLI every 10 seconds as configured in vzlogger.conf.

Figure 01: vzlogger messages in vRealize Log Insight

vRealize Log Insight Extracted Fields are a good way to extract the actual metrics defined by the Object Identification System (OBIS):

  • ObisIdentifier:1-0:1.7.0 = key 1.7.0 = Current consuption in (WATT)
  • ObisIdentifier:1-0:1.8.1 = key 1.8.1 = Accumulated consumption – rate 1 (meter reading)
  • ObisIdentifier:1-0:1.8.2 = key 1.8.2 = Accumulated consumption – rate 2 (meter reading)

To make the extraction of the value efficient, I am using the hostname of the data source as additional context. Additional context ensures that vRLI does not have to parse every single log message arriving in vRLI. Only messages coming from my Raspberry PI will be parsed.

Figure 02: Extracted Field used to assign the actual metric, consumption, to a searchable field

Additionally I extract the OBIS key to use both, key and value to create my dashboards.

Figure 03: OBIS key as Extracted Field

Now it is easy to show the actual consumption using both extracted fields.

Figure 04: Current consumption as max and average

vRealize Log Insight Dashboard (Sharing)

Information made visible in the vRealize Log Insight Interactive Analytics can be added to a dashboard and shared with other users.

Figure 05: Creating a shared dashboard

The dashboard can have multiple widgets and give you a quick insight into the collected data.

Figure 06: Electric energy consumption dashboard

vRealize Log Insight Partition

Another fairly new (since 8.1) feature of vRealize Log Insight I have used in this example is Data Partitions.

You can retain log data in a partition with a filter and a retention period. Data partitions let you define different retention periods for different types of logs. For example, logs with sensitive information might require a short retention period, such as five days. The log data that matches the filter criteria for a data partition is stored in the partition for the specified retention period. Logs that do not match the filter criteria in any of the defined data partitions are stored in the default partition. This partition is always enabled and stores data for an unlimited amount of time. You can modify the retention period for the default partition.

I have created a partition for the energy data to retain that data for 90 days. My host bajor is sending only the vzlogger messages so I can use the hostname as filter.

Figure 07: Data partition for the energy consumption data

Outlook

As the next project, I am planning to send the metrics to vRealize Operations or Wavefront to treat them as time-series data and allow for more sophisticated analytics.

Stay safe.

Thomas – https://twitter.com/ThomasKopton

vRealize Operations and Logging via CFAPI and Syslog

Without any doubt configuring vRealize Operations to send log messages to a vRealize Log Insight instance is the best way to collect, parse and display structured and structured log information.

In this post I will explain the major differences between CFAPI and Syslog as the protocol used to forward log messages to a log server like vRealize Log Insight.

The configuration of the log forwarding in vRealize Operations is straight forward. Under “Administration” –> “Management” –> “Log Forwarding” you will find all options to quickly configure vRLI as target for the selected log files.

The following figure shows how to configure vRealize Operations to send all log messages to vRealize Log Insight using the CFAPI protocol via HTTP.

Figure 1: Log Forwarding configuration

The CFAPI protocol, over HTTP or HTTPS, used by the vRealize Log Insight agent provides additional information used by the vROps Content Pack. The extracted information flows into the various dashboards and alert definitions delivered through the Content Pack. Following picture shows one of the available dashboards populated with available data when using CFAPI and vRLI.

Figure 02: vROps Content Pack

In case you (for whatever strange reason) cannot use CFAPI, you can configure vROps to use Syslog. It is as simple as selecting Syslog as the protocol option in the configuration page shown in the following picture.

Figure 03: Syslog as configured protocol

The drawback of using Syslog here is that the additional information parsed by the agent and used by the content pack will no longer be available and you will need to create your own extracted fields in vRLI to parse data from the log messages.

In the next both pictures you can see the empty dashboards and log messages without any vROps specific fields in the interactive analytics .

Figure 04: Empty dashboards when using Syslog
Figure 05: Missing vROps specific fields when using Syslog

It is important to know that vROps is using Syslog over TCP when configured via UI as shown in figure 03.

But what if you are forced to use Syslog over UDP?

There is no such option in the UI but since vROps is using the regular vRLI agent, there has to be a way to configure it to use UDP instead of TCP.

The vRLI config file explains how to set the according option:

Figure 06: liagent.ini config file

You can just replace

proto = syslog

with

proto = syslog_udp

restart the agent

service liagentd restart

and your vROps nodes starts to forward log messages to your log server using UDP.

I have setup a fake log server listening on 514 UDP using netcat:

Figure 07: Syslog over UDP in NC

If you configure the vRLI agent in vROps directly via the config file, please keep in mind:

  • that you are using a function which is not officially supported by VMware
  • you will need to make such manual changes on every node
  • you will need to monitor any changes to that file which can be triggered via the UI or vROps updates

Stay safe.

Thomas – https://twitter.com/ThomasKopton

Parsing CSV Files using vRealize Log Insight

Last year I published a blog post focusing on the JSON parser available in vRealize Log Insight (https://thomas-kopton.de/vblog/?p=144) and I believe this could have been a beginning of a series – “vRLI Parsers “.

In this post I will show how to configure and utilize the CSV parser using a very prominent and media-effective use case:

COVID-19 aka Coronavirus!

The needed data is publicly available, e.g. here:

https://github.com/CSSEGISandData/COVID-19 The actual data sources are listed on the GitHub project page and the data itself is already in the format we need to feed it into vRLI – CSV files.

Data Review

The time series data files provided by CSSE are in the following format:

Figure 1: CSSE CSV file format

Or shown as raw data:

Figure 2: CSSE CSV file format – in an editor

vRealize Log Insight processes every single CSV row as one message and if we do not specify our own timestamp as part of the message, vRLI will use the ingestion time as the timestamp for the message. This is clearly nothing we would like to have in order to have some meaningful diagrams showing us e.g. how the virus spreads in various countries. We will change the timestamp accordingly.

We also see that the original data contains “,” signs as part of province or state names, this is not compatible with the vRLI CSV parser as it would change the number and content of the fields. I have used Numbers on my Mac to “clean up” the file and replace the real “,” field separation signs with “;”.

To ingest the data, we will use the vRLI agent and an appropriate configuration of the agent.

vRLI Agent Config

My setup in for this use case is:

  • vRLI 8.0.0-14870409
  • vRLI agent 8.0.0.14743436
  • vRLI agent installed on a Debian OS
  • Agent successfully connected to vRLI

The configuration of the agent to parse CSV files is general pretty simple.

 [filelog|some_csv_logs]
 directory=/tmp/corona-data
 include=*.txt;*.csv
 parser=mycsv
  
 [parser|mycsv]
 base_parser=csv
 delimiter = ";"
 debug=yes
 fields=timestamp,testrun,location,country,confnumber
 field_decoder={"timestamp":"tsp_parser"}
  
 [parser|tsp_parser]
 base_parser=timestamp            
 debug=yes
 ;format=%Y-%m-%d %H:%M:%S
 format=%s 

Let us take the configuration to pieces and analyze what the single parts are doing. The first four lines, 1 – 4, contains the main section telling vRLI where to look for specified files and what parser to use to process the messages stored in those files. The parser is not specified directly as one of the OOB parsers but as a parser section.

Figure 3: Parser configuration – part 1

Lines 6 – 11 contains the actual parser configuration. In this section we specify the base parser, means one of the parsers available in vRLI. In our case csv.

Line 10 describes how to name the fields extracted from every row in a CSV file, separated by “;” in my case. The specification of fields has to match exactly the number of fields in the file we want to parse, and every single line of the file needs to have exactly the same number of fields. The fields itself might be empty. In this case we expect lines in our csv file containing exactly five values separated by “;”.

We assume the first value is a timestamp, the second one will be a number we will use later on to filter for messages in vRLI in case we ingest the same set of data several times, like every day. Location and country are pretty clear and “confnumber” is the actual number of confirmed cases as in the repository by Johns Hopkins CSSE. Line 11 specifies a special decoder for a field extracted in line 10 – here we will use a special decoder to decode or parse the timestamp.

Figure 4: Parser configuration – part 2

Lines 13 – 14 specifies our decoder for the timestamp field. A decoder is just another term for parser. As for every parser we specify the base parser, line 14. Line 17 tells the timestamp parser how to process the value in the “timestamp” field. In this case we expect the value to be an UNIX epoch timestamp.

Figure 5: Parser configuration – part 3

With this configuration we expect the data in a csv file to have the following format (example):

Figure 6: CSV format for the vRLI parser

I am using the timestamp instead of the date as in the original file because:

  1. The format used by Johns Hopkins CSSE is not optimal for the vRLI timestamp parser
  2. I want to see all data in a short time frame in vRLI. The goal is to have a fancy diagram to compare the numbers across different countries.

We will replace the original timestamps, which are day per data point, with 10ms steps per data point.

Format Adjustment

As we can see, the original csv file needs to be “slightly” adjusted to be correctly parsed by the parser we configured.

This is pretty easy to achieve with few lines. PowerShell, Bash or in my case vRO:

Figure 7: vRO Workflow to adjust the csv file

This very simple workflow can be found on VMware Code soon. I will update the link shortly.

Data Import

Now we are ready to let vRealize Log Insight do the job. Just put the new csv file into the specified folder on the box where you have configured the vRLI agent, wait few seconds, every day in the original file is a second in the parsed file, and analyze the numbers.


Figure 7: vRLI analyzing Coronavirus data – 1

Let’s see how we are doing here in Germany compared to Italy and US:

Figure 7: vRLI analyzing Coronavirus data – 8

Stay safe!

Thomas – https://twitter.com/ThomasKopton

vRLI JSON Parser and vRO Log Messages

Problem statement:

In certain cases vRO workflow(s) are producing not very well structured  log messages.

“not well structured” means in this case that various workflow runs  may generate log messages which could include variable information in terms of number of key:value pairs as well as the values themselves.

For example we might have a workflow doing a certain complex automation job and depending on the job details the number and the actual content of information may be totally different.

What we could do is to try to put structure in the unstructured data in the workflow logic and use one of the well known vRLI parsers (KVP, CSV etc.) to parse the values for future use in vRealize Log Insight.

But what if this is not possible because for example the number of key:value pairs is unknown. Or the “keys” might change in every run?

Solution:

This is where the vRealize Log Insight JSON parser helps you.

The only two things you need to do is:

  • write your vRealize Orchestrator log messages in JSON format
  • Include the JSON parser in your vRLI agent config

vRLI will automatically recognize the format and parse the key:value pairs accordingly.

Example:

Here a very simple example of two lines of code doing nothing but writing log:

myLogMessage ="{\"command\":\"adduser\",\"orderId\":\"123456789\",\"orderCustomer\":\"customer01\",\"message01\":\"text01\",\"message02\":\"text02\",\"message03\":\"text03\",\"message04\":\"text04\"}";

System.log (completeMessage);

In this simple example you see several key:value pairs:

"command":"adduser",
"orderId":"123456789",
"orderCustomer":"customer01",
"message01":"text01",
"message02":"text02",
"message03":"text03",
"message04":"text04"

The format of the JSON can be completely unknown for the vRLI parser.

To enable vRLI parse the JSON message, we need to edit the vRLI Agent configuration. This is how the configuration looks like in the template provided by the vRealize Orchestrator Content Pack vor vRLI:

The default configuration uses the clf-parser as the parser for the log message.

Inserting the JSON-parser here let vRLI recognize all key:value pairs in the log message:

And here the parsed message in vRLI (open image in an new tab too see details):

If your message contains new key:value pairs during the next run, you do not need to adjust anything, the parser is automatically parsing any new or changed key:value pairs:

Have fun with the vRLI JSON parser:-)

Thomas