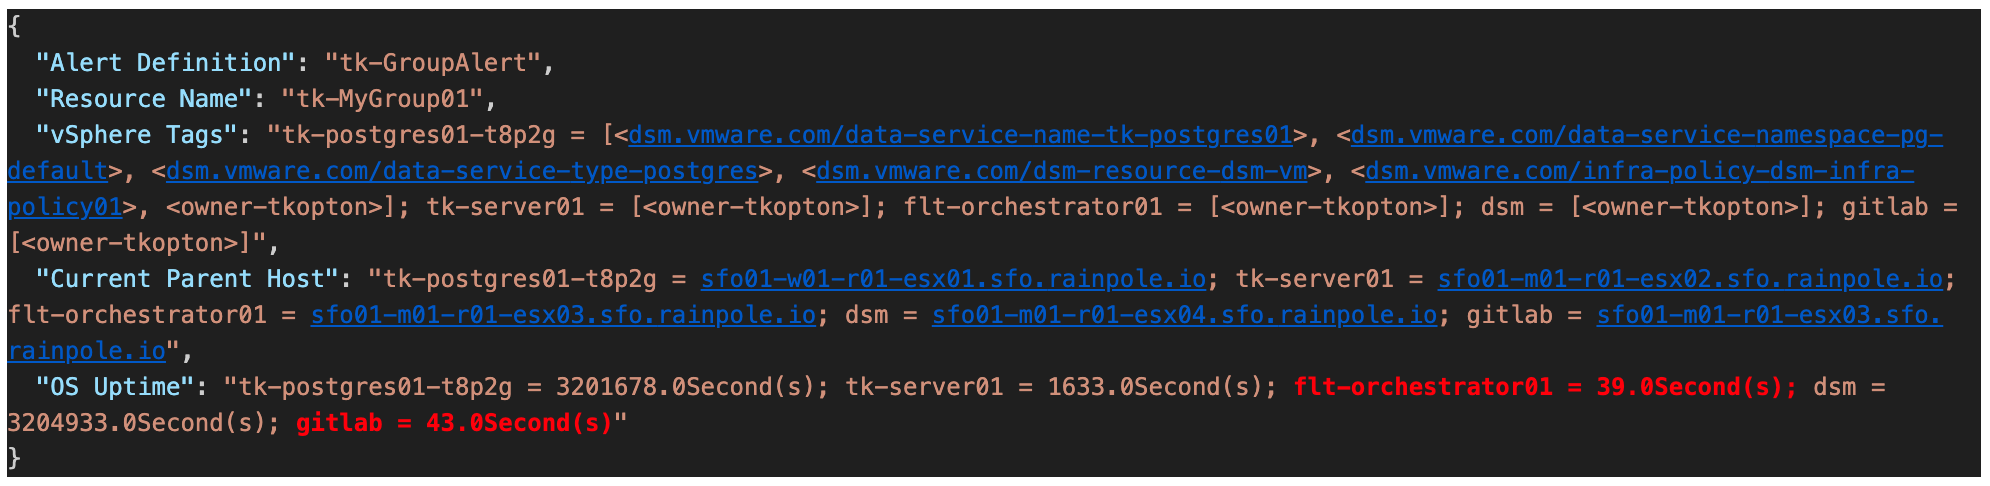
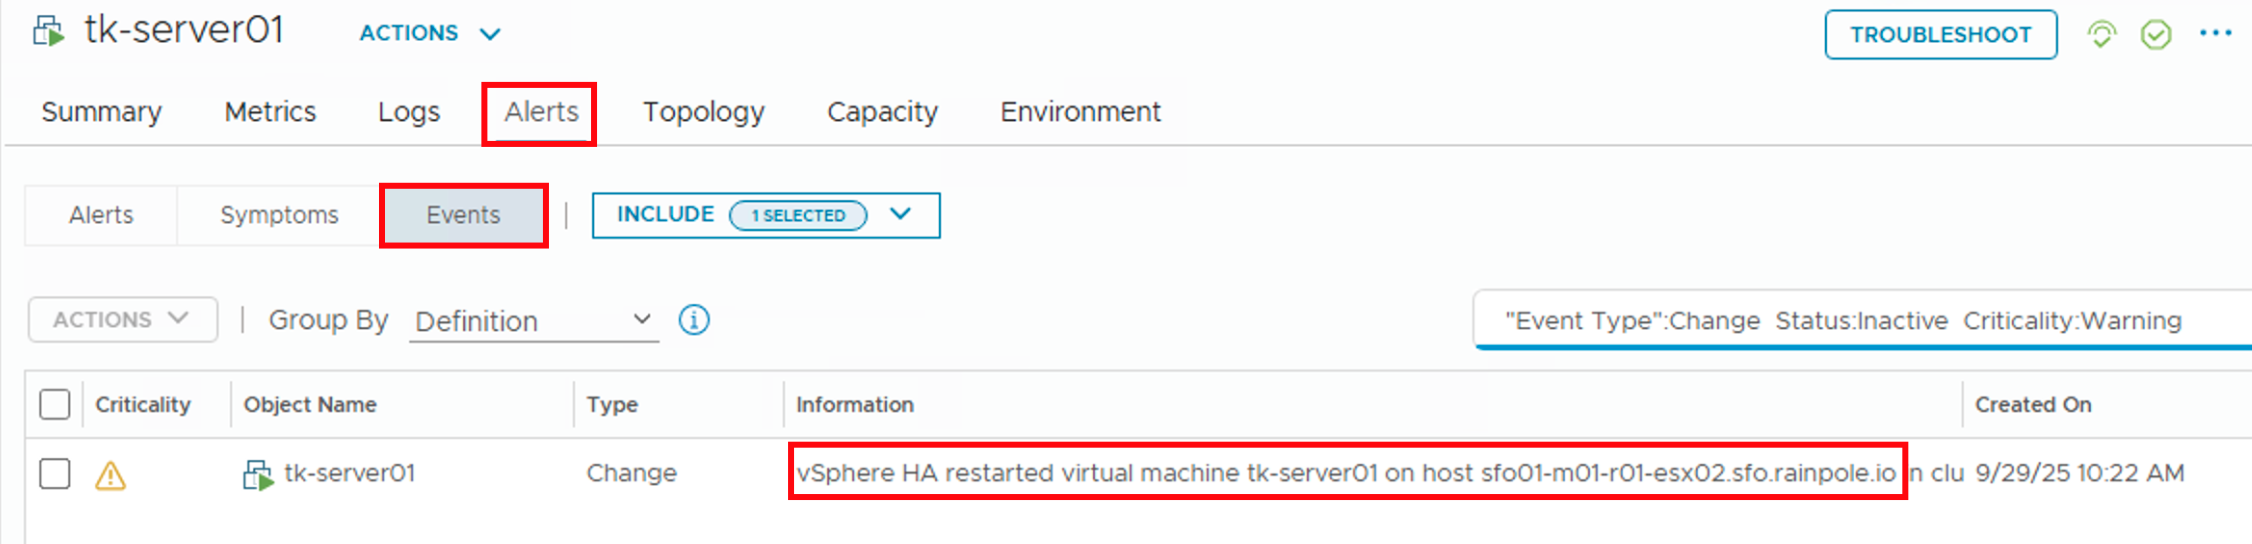
VMware Aria Operations for Logs Alerts as Symptoms in Aria Operations

As is likely known to everyone, the integration between VMware Aria Operations and Aria Operations for Logs involves forwarding alarms generated in Aria Operations for Logs to Aria Operations. If the integration has also established the link between the origin of the log message that triggered the alarm and the object in Aria Operations, the alarm in Aria Operations will be specifically “attached” to the correct object.

As seen in the following two images, the static field vmw_vr_ops_id ensures that the alarm triggered in Aria Operations for Logs appears as a Notification Event on the affected object in Aria Operations. In my case a virtual machine experiencing issues with an application.

Figure 01: Log messages in Aria Operations for Logs triggering a configured alert.
Figure 02: Notification Event in Aria Operations.

This functionality is completely sufficient for many use cases and helps to quickly detect problems and identify their root causes.

However, there are specific use cases that cannot be implemented with it. One such use case, for example, is the requirement to attach an Aria Operations Notification to such alarms, which in turn would trigger actions such as Webhooks. As of today, the configuration of Notifications does not allow Notification Events to be used as Alert Definitions under Category.

So, if we want to use Notifications for alarms coming from Aria Operations for Logs, we need to create an Alert Definition in Aria Operations, and for that, we need a Symptom. The task, therefore, is to build a Symptom from a Notification Event.

In my example, I want to build a Symptom from the Aria Operations for Logs Alarm, which arrives as a Notification Event in Aria Operations, as shown in the following image. As we can see, the name of the alarm in Aria Operations for Logs is tk-FailedESXiLoginAttempt on ${hostname}.

Figure 03: Alert definition in Aria Operations for Logs.

The Symptom in Aria Operations is based on a Message Event and has the Adapter, Object, and Event Types as depicted in the following image.

Figure 04: Message Event based Symptom definition in Aria Operations.

The details of the Symptom are shown in the following image. It is important to use contains as the condition here because Aria Operations for Logs replaces the field ${hostname} with the FQDN corresponding to the affected ESXi system. The string in the Contains condition is VMware Aria Operations for Logs: tk-FailedESXiLoginAttempt.

NOTE: This is the string as it is currently transmitted by Aria Operations for Logs at the time of writing this post.

Figure 05: Condition in the Symptom definition in Aria Operations.

Now, with this Symptom, an Alert Definition can be created in Aria Operations. The next images show the Alert Definition in my example.

Figure 06: Alert definition in Aria Operations.
Figure 07: Details of the Alert definition in Aria Operations.

With that, the Alert Definition can be further customized as usual, for example, by adding a Notification to it.

And this is how it looks in Aria Operations when someone attempts to log in to an ESXi host via SSH with an incorrect password.

Figure 08: Alarm in Aria Operations.

Stay safe.

Thomas – https://twitter.com/ThomasKopton

Energy Data at Datacenter Level using VMware Aria Operations

As you all probably know, VMware Aria Operations is providing several energy consumption and sustainability related data at different levels. From the power usage of a single Virtual Machine up to the aggregated data at the vSphere Cluster (Cluster Compute Resource) level.

What we are missing, at least as of today, are similar aggregated metrics at the Datacenter and Custom Datacenter level.

Fortunately there is an easy way to calculate the missing information. VMware Aria Operations Super Metrics is the recommended way to implement it, as usual in such scenarios where we need to derive data from existing metrics using mathematical formulas.

In this short post I will focus on one specific metric, the general procedure applies to any other metric.

Use Case

As DC manager I want to see the energy consumption of my data centers over the period of last month (or any other configurable time period).

Implementation

To cut the long story short, I will use a Super Metric to calculate the sum of the Sustainability|Power usage (kWh) metric at the Cluster level and make it available at the Datacenter and Custom Datacenter object level. Following picture shows the available metric at the cluster level.

Figure 01: Cluster level power usage metric.

Please note that every data point of this metric shows the power usage over the last 5 minutes. The power usage over the last hour is the sum of 12 data points. For the sfo-w01-cl01 cluster in the previous picture it would be roughly 160W * 12 = 1920Wh = 1,92kWh.

The Super Metric is extremely simple, you see the formatted formula in the following picture alongside with the object types this Super Metric will be assigned to (calculated for), Datacenter and Custom Datacenter, and the Aria Operations Policies where this Super Metric will be activated. As always for Super Metrics, do not forget the last step – activate the new Super Metric in your respective policy.

Figure 02: The new Super Metric for Datacenter and Custom Datacenter object types.

If you prefer to copy and paste the formula, here comes the unformatted formula:

sum(${adaptertype=VMWARE, objecttype=ClusterComputeResource, attribute=sustainability|power_usage, depth=2})

The following picture shows the new Super Metric being calculated every 5 minutes for one of my Datacenter objects.

Figure 03: The new Super Metric calculated for a Datacenter object.

Now we can create a View, as shown in the next picture, with all our Datacenter (and Custom Datacenter) objects and use it in Dashboards or Reports.

Figure 04: Datacenter power usage Aria Operations View .

As always the time range configured in the Aria Operations View can be adjusted to meet the actual requirement.

Stay safe.

Thomas – https://twitter.com/ThomasKopton

Multiple Metrics with Aria Operations Telegraf Custom Scripts

When using VMware Aria Operations, integrating telegraf can significantly enhance your monitoring capabilities, provide more extensive and customizable data collection, and help ensure the performance, availability, and efficiency of your infrastructure and applications.

Utilizing the telegraf agent you can run custom scripts in the end point VM and collect custom data which can then be consumed as a metric.

One very important constraint is that the script has to delivery exactly one int64 value.

Problem Statement

If you need to return multiple values or even multiple decimals or floating point values you will need to have multiple scripts for every single value and encode and decode any decimals or floating point metrics.

Even if configuring and running multiple scripts is a doable approach sometimes you have one script providing multiple metrics and breaking down such single script into multiple ones is not an option.

Challenge now is: how to put the multiple metrics into one value and how to revert this one value back into multiple metrics. Basically an encode – decode problem statement.

Solution

Let’s start with some basics in math and recall how the decimal system works. For this I will refresh your memories deconstructing a large number into small pieces – 420230133702600. The following picture shows how this number looks like in the decimal system. I have truncated the sum expression for visibility but you get the point, the number is the sum of it positional values multiplied with the corresponding power of 10.

The idea now is very simple. I will encode two values (in my working use case I use two but it works for any number as long as inn the end it fits into int64) into a larger number using the positions within this single number as displayed in the next picture for four independent values: 7, 62, 230, 4200 which will give es one number – 7622304200.

Figure 02: Encoding four numbers into one number.
So how to do that encoding mathematically?

Depending on the length of the single numbers we need to determine the power of 10 at the position where this single number should start within the final value. 4200 starts at 10^0, 230 at 10^4, 62 at 10^7 and 7 at 10^9. The sum is our single value:

4200 * 10^0 + 
230  * 10^4 +
62   * 10^7 +
7    * 10^9 = 4.200 + 2.300.000 + 620.000.000 + 7.000.000.000 = 7622304200
And now, how to decode that number back into single values?

What we have now is one large number with encoded four values, n1, n2, n3, n4.

Figure 03: Encoding four numbers into one number and the resulting sum.

The math goes backwards this time, and we need two additional mathematical expressions:

  • floor() always rounds down and returns the largest integer less than or equal to a given number
  • the modulo (mod, or %) operation returns the remainder or signed remainder of a division

We start with the most left number and divide it by its starting power of 10 and apply the floor() function to the result of the division. The subsequent numbers further to the right need a slightly different approach:

  • divide the single large number modulo by the power of 10 corresponding to the beginning of the previous number to the left
  • divide the result of the previous step by the power of 10 corresponding to the beginning of the actual number we want to extract
  • apply the floor() function to the result of the previous step
n1 = floor(7622304200 / 10^9) = 7
n2 = floor((7622304200 mod 10^9) / 10^7) = 62
n3 = floor((7622304200 mod 10^7) / 10^4) = 230
n4 = floor((7622304200 mod 10^4) / 10^0) = 4200
How to do all of it in Aria Operations and telegraf?

In my easy to follow example I need to get two metrics from a Virtual Machine using telegraf custom script. For simplicity it is CPU usage in % with values between 0.0 and 100.0 and memory usage in MB ranging theoretically from 0 to 1816 according to the configuration of my VM. I know, we have these metrics in Aria Operations OOTB but this is just an example.

First of all we need to agree on a format to encode both metrics as shown in the next picture. As the CPU usage might become 100.0% and we need to get rid of the decimal value, we need to multiply every CPU usage value by 10, thus we need four positions for this metric.

Figure 04: Encoding two numbers into one number and their positions.

The steps are as follows:

  1. Convert the decimal value into integer. It is one figure precision so simply multiply by 10
  2. Convert both values into one value. Again my assumptions:
    • first number will be 0 >= n1 <= 1000, thus four digits
    • Second number will be (due to my config) also 0 >= n2 <= 1000, thus four digits

This is the shell script to calculate both values and encode them into one int64 number.

#!/bin/bash
# This script returns current CPU and memory usage values

cpuUsage=$(top -bn1 | awk '/Cpu/ { print $2}')
memUsage=$(free -m | awk '/Mem/{print $3}')

# echo "CPU Usage: $cpuUsage%"
# echo "Memory Usage: $memUsage MB"

n1=$cpuUsage
n2=$memUsage

# Calculate the sum using bc
sum=$(echo "($n1*10*10^0)+($n2*10^4)" | bc)

# Print the result
# echo "Sum: $sum"

output=${sum%.*}
echo $output

Now we can configure the script as telegraf custom script as show in the next picture where I run my telegraf on a Linux VM.

Figure 05: Configuration of the telegraf custom script.

After few minute you will see the new metric coming in.

Figure 06: Telegraf custom script and ist new metric – the single large number.

As last task we need to extract or decode the single values for CPU and memory usage from this number. Aria Operations Super Metrics are the best way to do this.

The next two pictures show both super metrics. Important to know is, that this are not so called THIS Super Metrics as the metric provided by the custom script is not added to the VM object itself but to the Custom Script object related to the VM, thus the depth=0 in the Super Metric formula.

Figure 07: Super Metric to decode the first number – memory usage.
Figure 08: Super Metric to decode the second number – CPU usage.

You can find the script and the Super Metrics here: https://github.com/tkopton/aria-operations-content/tree/main/telegraf-script-multimetric

The final result is shown in the next picture.

Figure 09: Both Super Metrics and the single large number returned by the custom script.

Stay safe.

Thomas – https://twitter.com/ThomasKopton

Checking SSL/TLS Certificates using Aria Operations – Update

In my article “Checking SSL/TLS Certificate Validity Period using vRealize Operations Application Monitoring Agents” published in 2020, I have described how to check the remaining validity of SSL/TLS certificates using Aria Operations, or to be more specific, using vRealize Operations 8.1 and 8.2 back in the days.

I did not expect this post to be utilized by some many customers to check their SSL/TLS certificates used to secure specifically non-VMware endpoints.

As things might have changed in latest versions of Aria Operations including the VMware Aria Operations SaaS offering, In this blog post I will describe how to check and adjust the configuration if required.

Application Monitoring – Agent Configuration

The first change is, that there is no Application Remote Collector (ARC) Aria Operations. Its functionality is now included in the Aria Operations Cloud Proxy.

A Cloud Proxy instance has to be deployed to the Aria Operations instance regardless the option being used, on-premises or SaaS. The following picture shows the Cloud Proxy in an on-premises Aria Operations instance.

Figure 1: Aria Operations Cloud Proxy.

To deploy and configure the Cloud Proxy please follow the official VMware documentation: https://docs.vmware.com/en/VMware-Aria-Operations/8.12/Getting-Started-Operations/GUID-7C52B725-4675-4A58-A0AF-6246AEFA45CD.html

The installation and configuration of the Aria Operations managed telegraf agent did not change significantly, the screenshots from my old post still apply. VMware documentation describes the installation, configuration and uninstallation process: https://docs.vmware.com/en/VMware-Aria-Operations/8.12/Configuring-Operations/GUID-0C121456-370C-467E-874B-38ACC93E3776.html

Figure 2: Installing Application Monitoring agent.

Once the agent has been installed and is running, the actual configuration of the agent becomes available.

The agent basically:

  • discovers supported applications and can be configured to monitor those applications
  • provide the ability to run remote check, like ICMP or TCP tests
  • provide the ability to run custom scripts locally

The ability to run scripts and report the integer output as metric back to Aria Operations is exactly what we need to run certificate checks.

The actual script is fairly easy and available, together with the Aria Operations dashboard, via VMware Code:

https://code.vmware.com/samples?id=7464

To let the agent run the script and provide a metric, we configure the agent with few options, the process has changed slightly in newer versions and you will find it under the Applications section.

Figure 3: Configure Custom Script.

The script itself expects two parameters, the endpoint to check and the port number.

Figure 5: Custom Script options.

One agent, like for example a designated Linux Virtual Machine, can run multiple instances of the same script with different options or completely different scripts.

All scripts need to be placed in /opt/vmware and the arcuser (as per default configuration) needs the execute permissions.

Dashboard

The running custom scripts provide a metric per script. The values can be used to populate dashboards or views or serve as metrics for symptoms and alert definitions.

Figure 5: Custom Scripts as metrics.

After downloading and importing the Dashboard into Aria Operations, please do not forget to reconfigure the Scoreboard widget. You will need to remove my custom script metrics and add yours, as shown here.

Figure 6: Scoreboard widget configuration.

A nice option is, to retain one of the examples as with one click apply the custom settings to all your custom script metrics as shown in the following picture, obviously you will need to change the Box Label. For some reason it does not copy the unit, it has to be specified on every new metric manually.

Figure 7: Scoreboard widget configuration – applying custom settings to all metrics.

The dashboard showing is very simple but with the color coding if the widget it is easy to spot endpoints with expiring SSL/TLS certificates and take appropriate actions.

Figure 8: SSL/TLS Certificate Validity dashboard

Of course you can adjust the widget settings to reflect your color coding.

Stay safe.

Thomas – https://twitter.com/ThomasKopt

Fixing “Virtual Machine Power Metrics Display in mW” using Aria Operations

In the VMware Aria Operations 8.6 (previously known as vRealize Operations), VMware introduced pioneering sustainability dashboards designed to display the amount of carbon emissions conserved through compute virtualization. Additionally, these dashboards offer insights into reducing the carbon footprint by identifying and optimizing idle workloads.

This progress was taken even further with the introduction of Sustainability v2.0 in the Aria Operations Cloud update released in October 2022 as well as in the Aria Operations 8.12 on-premises edition. Sustainability v2.0 is centered around three key themes:

  1. Assessing the Current Carbon Footprint
  2. Monitoring Carbon Emissions with a Green Score
  3. Providing Actionable Recommendations for Enhancing the Green Score.

When working with Virtual Machine power related metrics you need to be careful in case your VMs are running on certain ESXi 7.0 versions.

VMware has released a KB describing the issue: https://kb.vmware.com/s/article/92639

This issue has been resolved in ESXi 7.0 Update 3l.

Quick Solution in Aria Operations

The issue can be very easily fixed in Aria Operations using two simple Super Metrics. The first one is correcting the Power|Power (Watt) metric:

${this, metric=power|power_average} / 1000

And the second Super Metric fixes the Power|Total Energy (Wh) metric:

Figure 01: Super Metric fixing the power usage metric.
${this, metric=power|energy_summation_sum} / 1000
Figure 03: Super Metric fixing the energy consumption metric.
Applying the Super Metric – Automatically

Super Metrics are activated on certain objects in Aria Operations using Policies. The most common construct which is being used to group objects and apply a Policy to them is the Custom Group.

In this case I am using two Custom Groups. The first one contains all ESXi Host System objects with version affected by the issue described in the KB. The second Custom Group contains all Virtual Machine objects running on Host Systems belonging to the first group.

To create the first group and its member criteria I have used this overview of ESXi version numbers: https://kb.vmware.com/s/article/2143832.

The following picture shows how to define the membership criteria. And now you may see the problem. It will be a lot of clicking to include all 23 versions. But there is an easier way to do that. Simply create the Custom Group with two criteria as show below.

Figure 04: Custom Group containing the affected ESXi servers.

In the next step export the Custom Group into a file, open this JSON file with your favorite editor and just copy and paste the membership criteria, it is an array, and adjust the version number.

Figure 05: Custom Group as code – membership criteria array.

Save the file and import it into Aria Operations overwriting the existing Custom Group.

Figure 06: Importing the modified Custom Group.

Now this Custom Group contains all affected ESXi servers and we can proceed with the VM group. The membership criteria is simple as shown in the next picture.

Figure 07: Custom Group containing the affected VMs (running on affected ESXi servers).

You can download the Custom Group definition here and adjust the name, description and the policy to meet your requirements.

With this relatively simply approach Aria Operations provides correct VM level power and energy metrics.

Figure 08: Fixed metrics.

Happy dashboarding!

Stay safe.

Thomas – https://twitter.com/ThomasKopton

Aria Operations Heatmap Widget meets Custom Groups – Grouping by Property

The Aria Operations Heatmap Widget which is very often used in many Dashboards provides the possibility of grouping objects within the Heatmap by other related object types, like in the following screenshot showing Virtual Machines grouped by their respective vSphere Cluster.

Figure 01: Heatmap with VMs grouped by their respective vSphere Cluster.
Problem description

This is a great feature but the grouping works only using object types.

Today I was asked if there is a way to group Virtual Machines by their vCenter Custom Attribute value To my knowledge this is not possible in the widget itself.

Possible solution / workaround

Assuming the possible values of the Custom Attribute are known, the Aria Operations Custom Group object type can be used to implement such requirements.

The use case is:

“I want to group my Kubernetes Virtual Machines by they K8s function (master, worker).”

The steps are:

  • create a custom Group Type
  • create required Custom Groups and associate them with the new Group Type
  • use the Custom Groups for grouping in the Heatmap Widget
Create Custom Group Type

Group Type is an abstract construct to, well, group together Custom Groups belonging together, like the OOTB provided types Environment, Function, etc.

For my use case I created the type tk-kubernetes-functions as shown in the next picture.

Figure 02: New Group Type.

Please note that you have to create the type before you create the groups! Once a group has been assigned to a type you cannot change the assignment, at least not using the UI.

Create Custom Groups

To group K8s masters and workers I created two groups. The configuration of the groups is based on the property value reflecting the vCenter Custom Attributes:

Summary|Custom Tag:kubernetes-role|Value.

Figure 03: Custom Group configuration.

That way I group my three TKGi Virtual Machines in two groups.

Figure 04: New Custom Groups.
Configure Heatmap Widget using Custom Groups for grouping

In the last step I configured the Heatmap widget to use the new Group Type for grouping. Next picture shows the according configuration. You will find the new Group Type in the Container section of available object types.

Figure 05: Heatmap configuration.

Now my Heatmap shows Kubernetes Virtual Machines grouped by their role.

Figure 05: Dashboard containing a Heatmap Widget with “property grouping”.

This approach will not work for all use cases, especially when the attribute values are not know upfront. In such scenarios Aria Automation could automate the creation of the Custom Groups in Aria Operations, but this is stuff for another blog post;-)

Stay safe.

Thomas – https://twitter.com/ThomasKopto

How to detect Windows Blue Screen of Death using VMware Aria Operations

Problem statement

Recently I was asked by a customer what would be the best way to get alerted by VMware Aria Operations when a Windows VM stopped because of a Blue Screen of Death (BSoD) or a Linux machine suddenly quit working due to a Kernel Panic.

Even if it looks like a piece of cake (we have tons of the metrics and properties collected by Aria Operations), it turns out that it is not that simple to recognize such crashes without looking at the console.

So, challenge accepted:-)

In this blog post I am focusing on Windows BSoD and the overall idea was to figure out the metrics which combined are indicating a BSoD occurrence.

NOTE: Windows as well as Linux will restart a crashed OS with default settings and the restart usually is quick enough to remain “undetected” by Symptom Definitions unless you are using Near-Real Time Monitoring in VMware Aria Operations SaaS. A restart can also be initiated by vCenter HA settings in case of missing heartbeats from the OS.

My “Windows BSoD” Approach

I quickly created a Windows Server 2019 VM with this configuration:

Figure 01: Windows VM configuration.

And with the help of tools like Testlimit and DiskSpd plus some usual activities on the VM I created a “quick and dirty” baseline using metrics shown in the next picture (please ignore the color coding in the following picture for a moment). You will notice that in the Scoreboard the VMTools status is missing. I was not sure if I should include it or not as “tools not running” does not necessarily mean that the OS crashed, it could be also a crashed service.

Figure 02: Windows 2019 Server VM baseline.
Blue Screen of Death Examples

NotMyFault is a perfect tool to crash Windows in various ways. As I wanted to check if different BSoD types have different symptoms I used that tool to force few crashes and collected a set of metrics for comparison.

First crash type.

I started with probably the most known Blue Screen:

Figure 03: IRQL not less or equal – BSoD.

The first surprise was that the CPU Demand of the VM immediately increased to almost 100%. To ensure that this is not related to the fact that Windows is collecting data after the crash for some time, I checked this metric after two collections cycles (10 minutes) and it did not go down. Second finding is that the RAM Usage is only slowly decreasing, I assume this is simply due the the fact that memory is a really virtualized resource whereas CPU cycles inside the VM are actual cycles on the ESXi CPU. I also added the Guest Tools Status to the Scoreboard but I would not use it as symptom in an Alert Definition.

Figure 04: IRQL not less or equal – metrics.
Second crash type.
Figure 05: IRQL gt zero at system service – BSoD.

As you can see in the next picture, the metrics are behaving similarly to the first crash. Of course no disk and network usage at all was expected but to see that the CPU Demand and RAM Usage are following the same pattern is interesting and very promising symptom.

Figure 06: IRQL gt zero at system service – metrics.

This time I waited few more collection cycles to see how far the RAM usage will decrease and apparently it will go down to approx. 0.99% after >4 cycles.

Figure 07: RAM and CPU usage pattern.
Third crash type.
Figure 08: Unexpected kernel mode trap – BSoD.

This BSoD type again resulted in the same metrics values.

Figure 09: Unexpected kernel mode trap – metrics.

RAM on ESXi as metric seems to be dependent on the memory usage of the VM before the crash. I did not fully test it but Aria Operations Metric Correlation feature shows the same pattern for the respective metrics.

Figure 10: Memory metrics correlation.

Just to be sure that the RAM Usage metric values do not change with different memory configurations of the VM, I did two more tests, the first one with 4GB RAM configured and the second with 17GB to check the metric with an odd RAM config.

Figure 11: 4GB VM metrics after crash.

And here the 17GB RAM config.

Figure 12: 17GB VM metrics after crash.
Constraints, assumptions and conclusions

Please be aware that I did not test every possible scenario, this is what I used:

  • Windows 2019 Server Datacenter as OS
  • VM Version 19
  • VMware ESXi, 7.0.3, 20328353
  • 3 different BSoD types tested
  • VMTools not used as symptom
  • OS Uptime not used as symptom as the metric is not available after OS crashed
  • No Guest metrics used as such metrics will not be available after OS crashed

With the observations made during the crash tests I created 6 new Symptom Definitions and an Alert Definition using these new symptoms and one Condition for the power state of the VM. In the following two pictures you see the symptom and alert definitions.

Figure 13: New Symptom Definitions.
Figure 14: Alert Definition.

DO NOT forget to activate your new symptoms and alert definition in the Aria Operations Policy assigned to your VMs!

This is how the symptoms looks like on a crashed Windows Server 2019 VM.

Please be aware that the highlighted low memory usage symptom requires several collection cycles to become active. If you need fast response, remove it from the Alert Definition.

Figure 15: Active symptoms.
Figure 16: Active alert.

The small dashboard I created is shown in the next picture.

Figure 17: BSoD Dashboard.

You can download the content from VMware Code.

Update 03.03.2023

One of my fellow colleagues (thank you Brandon) suggested to test the behavior with VMTools not running at all as it will have impact on memory usage metrics. Brandon also suggested to add or replace CPU Demand with CPU Usage as demand will be affected by high CPU usage on the ESXi host. I have added this metric to the Metric Configuration file and uploaded it to VMware Code.

NOTE: CPU, Disk and Network metrics are basically instantly affected by the crash, whereas memory slowly converges toward 0.

As you can see in the following screenshot, you can use CPU Usage instead of CPU Demand as it will also increase to 98-100% after the BSoD.

Figure 18: BSoD Dashboard with new metrics.

I would like to mention once again that the CPU metrics are available basically right after the crash and if you use Aria Operations SaaS, which is definitely the recommended way of using Aria Operations, you will get the symptoms triggered roughly after 40-60 seconds.

The memory metrics, as you can see in the next picture, will need several minutes to decrease to a level near 0.

Figure 19: Slowly converging memory metrics.

Stay safe.

Thomas – https://twitter.com/ThomasKopto

VMware Explore Follow-up 2 – Aria Operations Dashboard Permissions Management

Another question I was asked during my “Meet the Expert – Creating Custom Dashboards” session which I could not answer due to the limited time was:

How to manage access permissions to Aria Operations Dashboards in a way that will allow only specific group of content admins to edit only specific group of dashboards?

Even if there is no explicit feature providing such functionality, there is a way to implement it using Access Control and Dashboard Sharing capabilities of Aria Operations.

My solution

Assumption is that for example following AD users and groups are available, content admins are responsible for creating dashboards and content users will be consuming their dedicated content.

Figure 01: AD Users and Groups

I have imported the AD groups in Aria Operations Access Control and for the sake of simplicity I have assigned them the predefined roles Content Admin and Read Only respectively and granted access to all objects in Aria Operations.

Figure 02: AD Groups in Operations Access Control

I have also created two sample dashboards and two dashboard folders for these two dashboards. This is not really required but it makes it easier to find the dashboards if you have a larger number of them with a more complex categorization.

Figure 03: Aria Operations dashboard folders

And the last thing to do is to configure dashboard sharing accordingly using in the dashboard management shown in the next picture.

Figure 04: Aria Operations dashboard management

A dashboard can be shared with multiple user groups. In may example I have shared one sample dashboard with one editor and user group and the other sample dashboard with another editor and another user group. This way only dedicated editors (the members of the AD group) have access only to dashboards shared with them, and of course to any other dashboard shared with the built-in group Everyone. The very same way as regular users get access to their respective content.

Figure 05: Aria Operations dashboard sharing

Of course this approach requires a proper user group and dashboard sharing concept but such a concept is recommended anyway.

Stay safe.

Thomas – https://twitter.com/ThomasKopton

vRealize Operations and Telegram – Alerts on your Phone

As you all know vRealize Operations is a perfect tool to manage and monitor your SDDC and in case of issues vROps creates alerts and informs you as quickly as possible providing many details related to an alert.

Without any additional customization, vRealize Operations displays the alerts in the Alerts tab. Sending alerts via email is the most common way to quickly attract your attention and increase the chances of reacting to the alert quickly.

With the Webhook Notification Plugin, it is possible to integrate vROps with almost any REST API endpoint. Telegram provides an easy-to-use API and allows for sending vROps alerts as messages into a Telegram chat.

Telegram Chat, Bot, and Token

The first step is to prepare Telegram to allow vROps to send messages to a chat. Basically, you will need a chat, a bot, and a token. The process is very well described here.

The actual REST API POST call uses the chat ID and the Token to ingest messages into the chat.

https://api.telegram.org/bot$token/sendMessage?chat_id=$chat&text=Hello+World

The POST content is pretty simple.

{
  "text": "my message"
}

vROps Outbound Instance

The next step is the vROps Outbound Webhook Plugin instance that will point to our telegram chat. For simplicity, the Outbound URL contains the entire URL we need to send messages to Telegram.

In my environment, the instance looks like depicted in the following figure, bot ID and token are truncated for visibility and my data privacy.

Figure 01: Outbound Webhook Plugin instance.

You do not have to specify any user or password as the ingestion uses the token in the URL. When you run the test you will see an error but this is in our case OK.

vROps Payload Template

Following the Outbound Plugin instance, we need to specify the details of the REST call and the payload. In my example, I would like to receive datastore space-related alarms in my chat. Details of the alert definition are not described in this post.

The Payload Template is where we define these settings, subdivided into:

  • Details: Specifies the name of the instance and the Outbound Method to use, in this case, the Webhook Notification Plugin.
  • Object Content: Here we can add additional information, like metrics and properties to be used in the actual payload. I have added a few additional metrics to help qualify the alarm.
  • Payload Details: Specifies the actual REST call, like method or content type, and describes the body of the call as required by the receiving instance. In the body itself, we can use the predefined parameters (uppercase) and our additional metrics or properties or related objects (lowercase).

The following two pictures show my Payload Template.

Figure 02: Payload Template – Details.
Figure 03: Payload Template – Object Content.
Figure 04: Payload Template – Payload Details.

vROps Notification

The last step of the process is to bring everything together, the alert definition, the outbound instance, and the payload template to work together and send the message towards Telegram.

This is where the good old vROps Notifications come into play. It wires everything and does exactly what the name implies – notifies you in an alarm event.

The process of notification creation has four steps:

  1. Notification: Here you give the notification a name and enable or disable it.
  2. Define Criteria: This step gives you a large number of options to exactly specify when the notification should be triggered. In my use case, I want this notification to be triggered only on one specific object type (Datastore) and only for one specific alert definition (tk-vSAN Remaining Space Low).
  3. Set Outbound Method: Here we define the Outbound Method (Webhook Notification Plugin) and the Outbound Instance we created for Telegram.
  4. Select Payload Template: In the last step we define the Payload Template to use, in our use case the template we created for Telegram.

The following pictures show my Notification settings.

Figure 05: vROps Notification – Notification.
Figure 06: vROps Notification – Define Criteria.
Figure 07: vROps Notification – Set Outbound Method.
Figure 08: vROps Notification – Select Payload Template.

The Result

When all steps are finished successfully, any time the specified alarm has been triggered you will receive a message in your Telegram chat, as depicted in the following figure.

Figure 09: vROps Alarm in Telegram chat.

Stay safe.

Thomas – https://twitter.com/ThomasKopton

Exclude “Aggregate” Instanced Metric using vRealize Operations Super Metric

As you know vRealize Operations is collecting tons of various metrics. Some of these metrics are so-called “Instanced Metrics” and disabled in the default configuration in newer vROps versions. A list of disabled instanced metrics for e.g. Virtual Machine object type is available here:

https://docs.vmware.com/en/vRealize-Operations/8.6/com.vmware.vcom.metrics.doc/GUID-1322F5A4-DA1D-481F-BBEA-99B228E96AF2.html#disabled-instanced-metrics-18

If you need any of those metrics, you can enable them in your vRealize Operations Policy.

Figure 01: Enabling disabled instanced metric in vROps policy.

As you can see in the previous picture, there is an option to specify instances you would like to include or exclude. In my example, I am excluding the CPU (or CPUs) containing “1” in the instanced metric name. Yes, it does not make any sense, it is just an example:-)

Problem statement

In addition or as a replacement for some of the disabled instanced metrics vRealize Operations provides the “Aggregate of all instances” metric, like in this example for Virtual Disk metrics.

Figure 02: “Aggregate of all instances” metric.

The problem now is that in certain situations where you would like to evaluate the instanced metrics to find the maximum, minimum, etc. the aggregated metric may also be taken into the equation, like in views or super metrics.

Use case

One of my customers described a very interesting and important use case.

“I want to determine the highest average write request size”.

One logical way would be to use vRealize Operations Super Metric and create a formula like this one:

max({This Resource: Virtual Disk|Average Write request size (bytes)}) 

Unfortunately, that approach does not work.

As described in the “Problem statement” this calculation includes the aggregated metric, “VirtualDisk|Aggregate of all Instances”, which leads to a wrong result.

Possible solution

Please be aware that this is ONE possible solution with one drawback that I will explain at the end.

The approach is to exclude the aggregated metric from the formula.

What we cannot do, or at least I do not know how is to exclude a metric based on the instance name.

What we can do is to leverage the assumption that the aggregate will be usually greater than any single instance as it is the sum of all instances. And this is the mentioned drawback. The approach works only when the following assumption is true:

  • count of instances is > 1
  • at least 2 instances have a value > 0 at the occurrence of super metric evaluation

I am working on an improved version of the formula to get rid of the assumption. For the time being this is what is working taking the mentioned assumption into account:

max(${this, attribute=virtualDisk|writeIOSize_latest, where=($value < ${metric=virtualDisk:Aggregate of all instances|writeIOSize_latest})})

This formula is evaluating only the metrics with values < the value of the aggregated metric.

Figure 03: Highest average write request size.

Outlook

The improved formula will include some if-then-else statements.

Stay safe

Thomas – https://twitter.com/ThomasKopton