Multiple Metrics with Aria Operations Telegraf Custom Scripts

When using VMware Aria Operations, integrating telegraf can significantly enhance your monitoring capabilities, provide more extensive and customizable data collection, and help ensure the performance, availability, and efficiency of your infrastructure and applications.

Utilizing the telegraf agent you can run custom scripts in the end point VM and collect custom data which can then be consumed as a metric.

One very important constraint is that the script has to delivery exactly one int64 value.

Problem Statement

If you need to return multiple values or even multiple decimals or floating point values you will need to have multiple scripts for every single value and encode and decode any decimals or floating point metrics.

Even if configuring and running multiple scripts is a doable approach sometimes you have one script providing multiple metrics and breaking down such single script into multiple ones is not an option.

Challenge now is: how to put the multiple metrics into one value and how to revert this one value back into multiple metrics. Basically an encode – decode problem statement.

Solution

Let’s start with some basics in math and recall how the decimal system works. For this I will refresh your memories deconstructing a large number into small pieces – 420230133702600. The following picture shows how this number looks like in the decimal system. I have truncated the sum expression for visibility but you get the point, the number is the sum of it positional values multiplied with the corresponding power of 10.

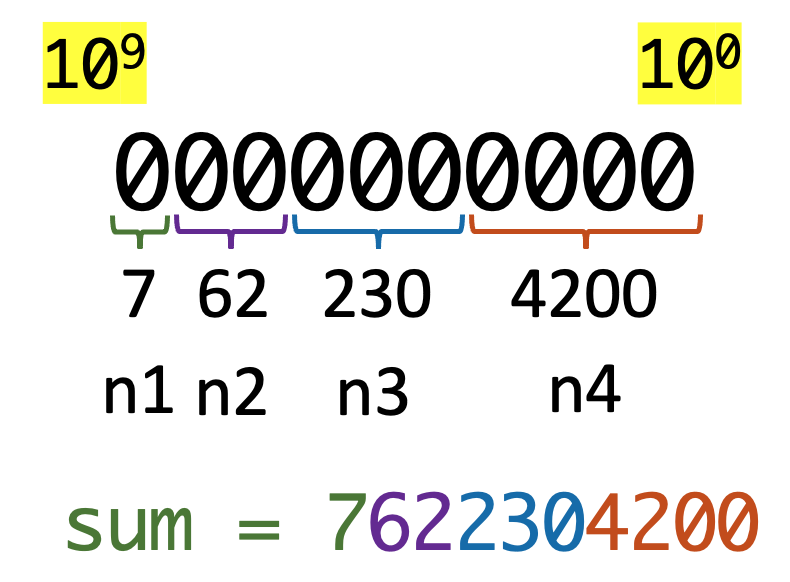
The idea now is very simple. I will encode two values (in my working use case I use two but it works for any number as long as inn the end it fits into int64) into a larger number using the positions within this single number as displayed in the next picture for four independent values: 7, 62, 230, 4200 which will give es one number – 7622304200.

Figure 02: Encoding four numbers into one number.
So how to do that encoding mathematically?

Depending on the length of the single numbers we need to determine the power of 10 at the position where this single number should start within the final value. 4200 starts at 10^0, 230 at 10^4, 62 at 10^7 and 7 at 10^9. The sum is our single value:

4200 * 10^0 + 
230  * 10^4 +
62   * 10^7 +
7    * 10^9 = 4.200 + 2.300.000 + 620.000.000 + 7.000.000.000 = 7622304200
And now, how to decode that number back into single values?

What we have now is one large number with encoded four values, n1, n2, n3, n4.

Figure 03: Encoding four numbers into one number and the resulting sum.

The math goes backwards this time, and we need two additional mathematical expressions:

  • floor() always rounds down and returns the largest integer less than or equal to a given number
  • the modulo (mod, or %) operation returns the remainder or signed remainder of a division

We start with the most left number and divide it by its starting power of 10 and apply the floor() function to the result of the division. The subsequent numbers further to the right need a slightly different approach:

  • divide the single large number modulo by the power of 10 corresponding to the beginning of the previous number to the left
  • divide the result of the previous step by the power of 10 corresponding to the beginning of the actual number we want to extract
  • apply the floor() function to the result of the previous step
n1 = floor(7622304200 / 10^9) = 7
n2 = floor((7622304200 mod 10^9) / 10^7) = 62
n3 = floor((7622304200 mod 10^7) / 10^4) = 230
n4 = floor((7622304200 mod 10^4) / 10^0) = 4200
How to do all of it in Aria Operations and telegraf?

In my easy to follow example I need to get two metrics from a Virtual Machine using telegraf custom script. For simplicity it is CPU usage in % with values between 0.0 and 100.0 and memory usage in MB ranging theoretically from 0 to 1816 according to the configuration of my VM. I know, we have these metrics in Aria Operations OOTB but this is just an example.

First of all we need to agree on a format to encode both metrics as shown in the next picture. As the CPU usage might become 100.0% and we need to get rid of the decimal value, we need to multiply every CPU usage value by 10, thus we need four positions for this metric.

Figure 04: Encoding two numbers into one number and their positions.

The steps are as follows:

  1. Convert the decimal value into integer. It is one figure precision so simply multiply by 10
  2. Convert both values into one value. Again my assumptions:
    • first number will be 0 >= n1 <= 1000, thus four digits
    • Second number will be (due to my config) also 0 >= n2 <= 1000, thus four digits

This is the shell script to calculate both values and encode them into one int64 number.

#!/bin/bash
# This script returns current CPU and memory usage values

cpuUsage=$(top -bn1 | awk '/Cpu/ { print $2}')
memUsage=$(free -m | awk '/Mem/{print $3}')

# echo "CPU Usage: $cpuUsage%"
# echo "Memory Usage: $memUsage MB"

n1=$cpuUsage
n2=$memUsage

# Calculate the sum using bc
sum=$(echo "($n1*10*10^0)+($n2*10^4)" | bc)

# Print the result
# echo "Sum: $sum"

output=${sum%.*}
echo $output

Now we can configure the script as telegraf custom script as show in the next picture where I run my telegraf on a Linux VM.

Figure 05: Configuration of the telegraf custom script.

After few minute you will see the new metric coming in.

Figure 06: Telegraf custom script and ist new metric – the single large number.

As last task we need to extract or decode the single values for CPU and memory usage from this number. Aria Operations Super Metrics are the best way to do this.

The next two pictures show both super metrics. Important to know is, that this are not so called THIS Super Metrics as the metric provided by the custom script is not added to the VM object itself but to the Custom Script object related to the VM, thus the depth=0 in the Super Metric formula.

Figure 07: Super Metric to decode the first number – memory usage.
Figure 08: Super Metric to decode the second number – CPU usage.

You can find the script and the Super Metrics here: https://github.com/tkopton/aria-operations-content/tree/main/telegraf-script-multimetric

The final result is shown in the next picture.

Figure 09: Both Super Metrics and the single large number returned by the custom script.

Stay safe.

Thomas – https://twitter.com/ThomasKopton

Fixing “Virtual Machine Power Metrics Display in mW” using Aria Operations

In the VMware Aria Operations 8.6 (previously known as vRealize Operations), VMware introduced pioneering sustainability dashboards designed to display the amount of carbon emissions conserved through compute virtualization. Additionally, these dashboards offer insights into reducing the carbon footprint by identifying and optimizing idle workloads.

This progress was taken even further with the introduction of Sustainability v2.0 in the Aria Operations Cloud update released in October 2022 as well as in the Aria Operations 8.12 on-premises edition. Sustainability v2.0 is centered around three key themes:

  1. Assessing the Current Carbon Footprint
  2. Monitoring Carbon Emissions with a Green Score
  3. Providing Actionable Recommendations for Enhancing the Green Score.

When working with Virtual Machine power related metrics you need to be careful in case your VMs are running on certain ESXi 7.0 versions.

VMware has released a KB describing the issue: https://kb.vmware.com/s/article/92639

This issue has been resolved in ESXi 7.0 Update 3l.

Quick Solution in Aria Operations

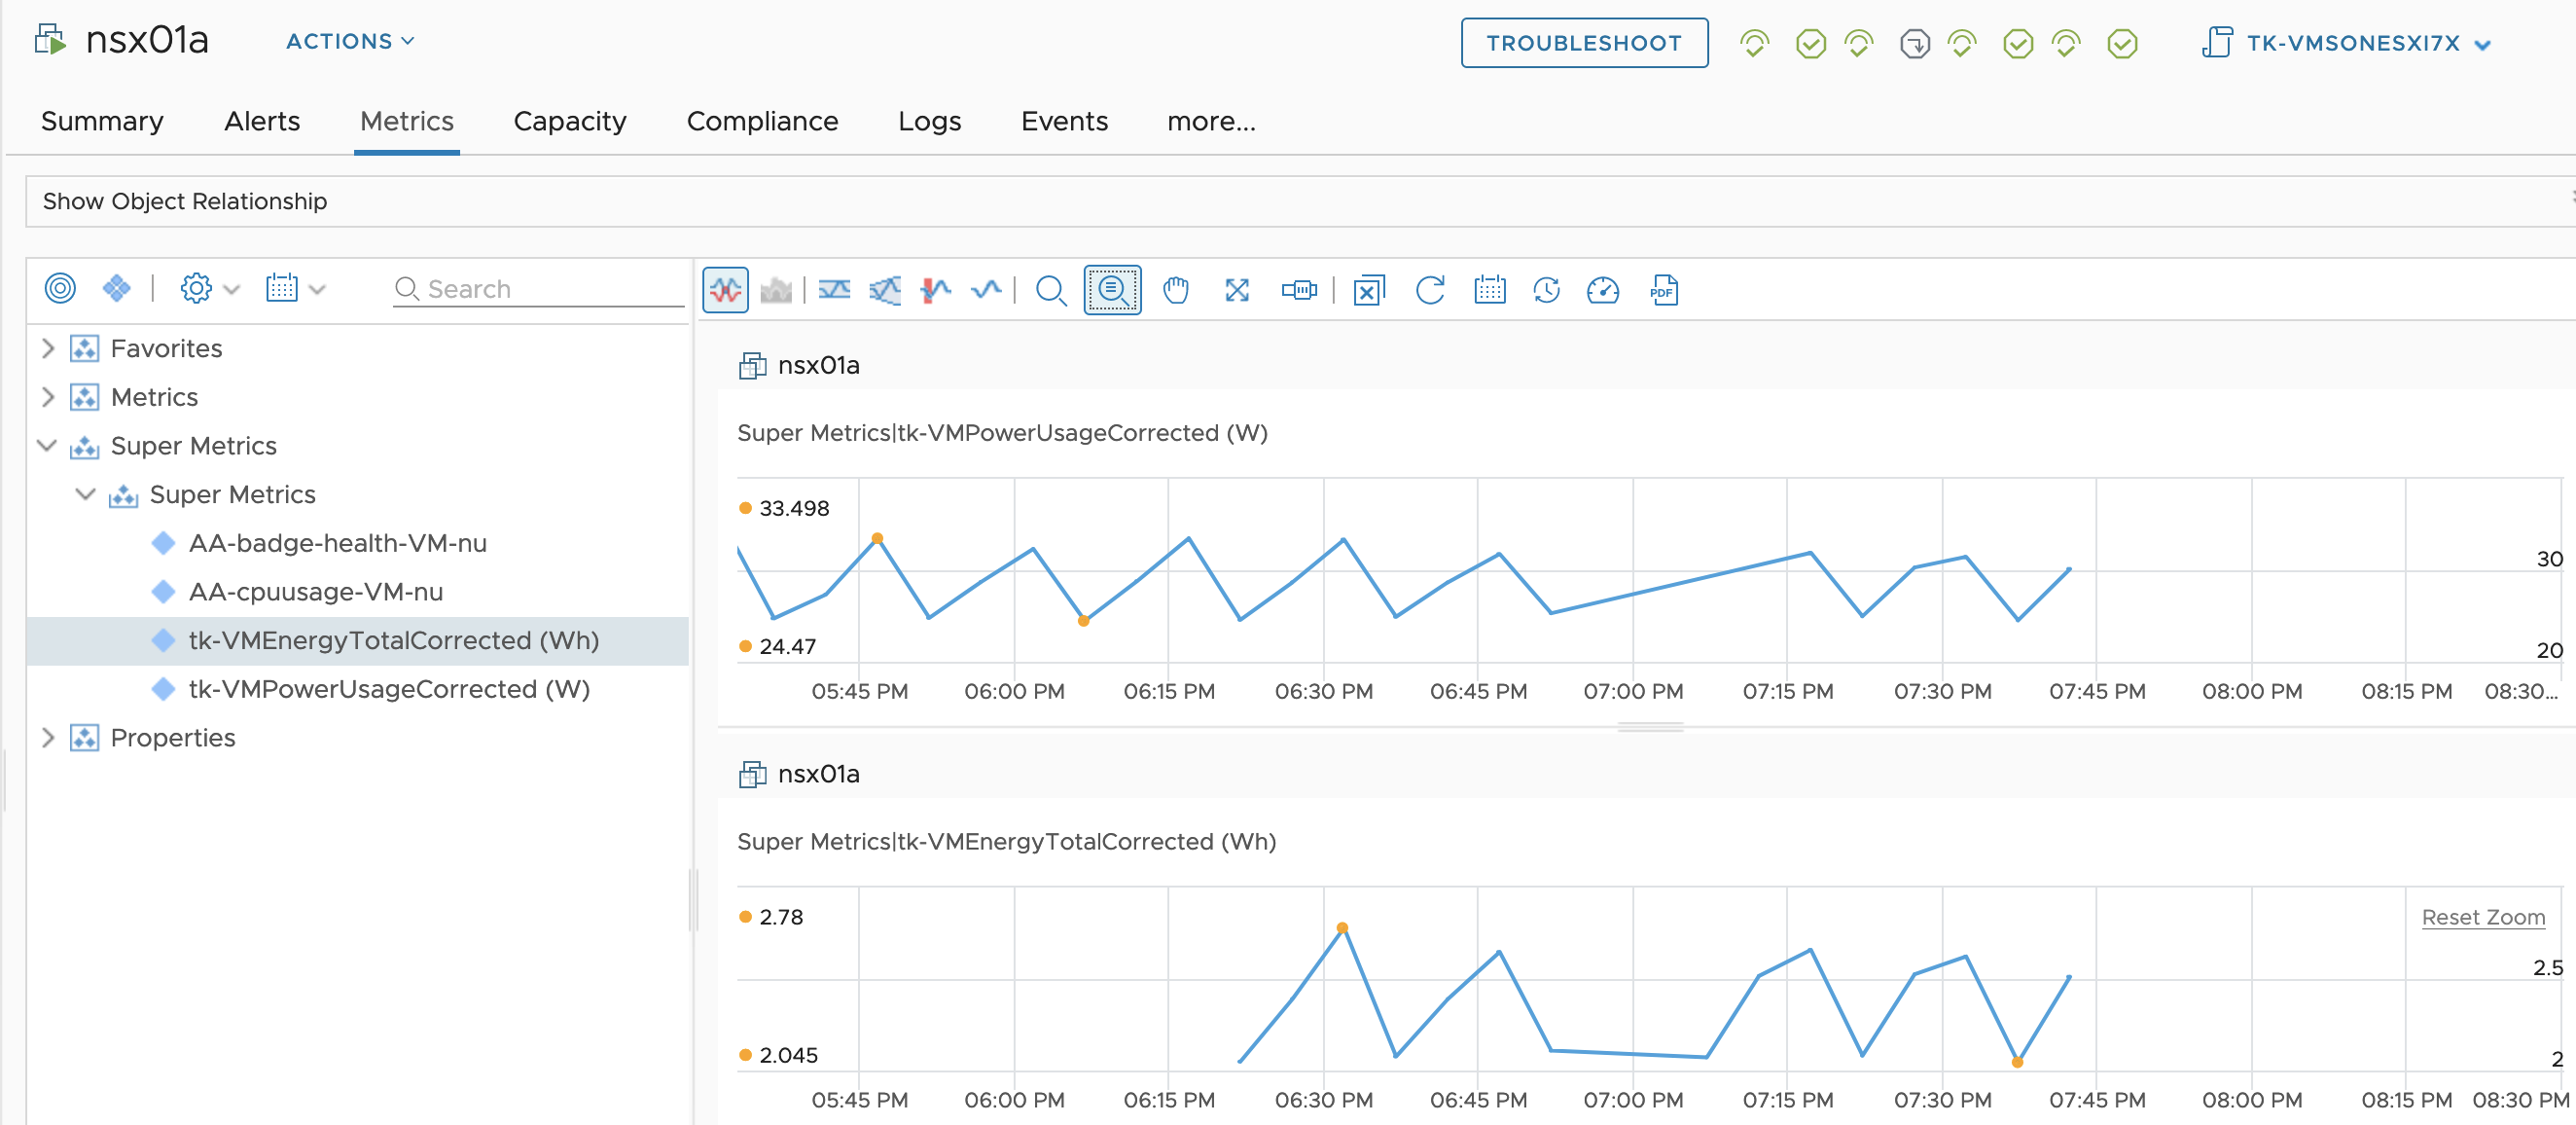
The issue can be very easily fixed in Aria Operations using two simple Super Metrics. The first one is correcting the Power|Power (Watt) metric:

${this, metric=power|power_average} / 1000

And the second Super Metric fixes the Power|Total Energy (Wh) metric:

Figure 01: Super Metric fixing the power usage metric.
${this, metric=power|energy_summation_sum} / 1000
Figure 03: Super Metric fixing the energy consumption metric.
Applying the Super Metric – Automatically

Super Metrics are activated on certain objects in Aria Operations using Policies. The most common construct which is being used to group objects and apply a Policy to them is the Custom Group.

In this case I am using two Custom Groups. The first one contains all ESXi Host System objects with version affected by the issue described in the KB. The second Custom Group contains all Virtual Machine objects running on Host Systems belonging to the first group.

To create the first group and its member criteria I have used this overview of ESXi version numbers: https://kb.vmware.com/s/article/2143832.

The following picture shows how to define the membership criteria. And now you may see the problem. It will be a lot of clicking to include all 23 versions. But there is an easier way to do that. Simply create the Custom Group with two criteria as show below.

Figure 04: Custom Group containing the affected ESXi servers.

In the next step export the Custom Group into a file, open this JSON file with your favorite editor and just copy and paste the membership criteria, it is an array, and adjust the version number.

Figure 05: Custom Group as code – membership criteria array.

Save the file and import it into Aria Operations overwriting the existing Custom Group.

Figure 06: Importing the modified Custom Group.

Now this Custom Group contains all affected ESXi servers and we can proceed with the VM group. The membership criteria is simple as shown in the next picture.

Figure 07: Custom Group containing the affected VMs (running on affected ESXi servers).

You can download the Custom Group definition here and adjust the name, description and the policy to meet your requirements.

With this relatively simply approach Aria Operations provides correct VM level power and energy metrics.

Figure 08: Fixed metrics.

Happy dashboarding!

Stay safe.

Thomas – https://twitter.com/ThomasKopton

VMware Explore Follow-up 2 – Aria Operations Dashboard Permissions Management

Another question I was asked during my “Meet the Expert – Creating Custom Dashboards” session which I could not answer due to the limited time was:

How to manage access permissions to Aria Operations Dashboards in a way that will allow only specific group of content admins to edit only specific group of dashboards?

Even if there is no explicit feature providing such functionality, there is a way to implement it using Access Control and Dashboard Sharing capabilities of Aria Operations.

My solution

Assumption is that for example following AD users and groups are available, content admins are responsible for creating dashboards and content users will be consuming their dedicated content.

Figure 01: AD Users and Groups

I have imported the AD groups in Aria Operations Access Control and for the sake of simplicity I have assigned them the predefined roles Content Admin and Read Only respectively and granted access to all objects in Aria Operations.

Figure 02: AD Groups in Operations Access Control

I have also created two sample dashboards and two dashboard folders for these two dashboards. This is not really required but it makes it easier to find the dashboards if you have a larger number of them with a more complex categorization.

Figure 03: Aria Operations dashboard folders

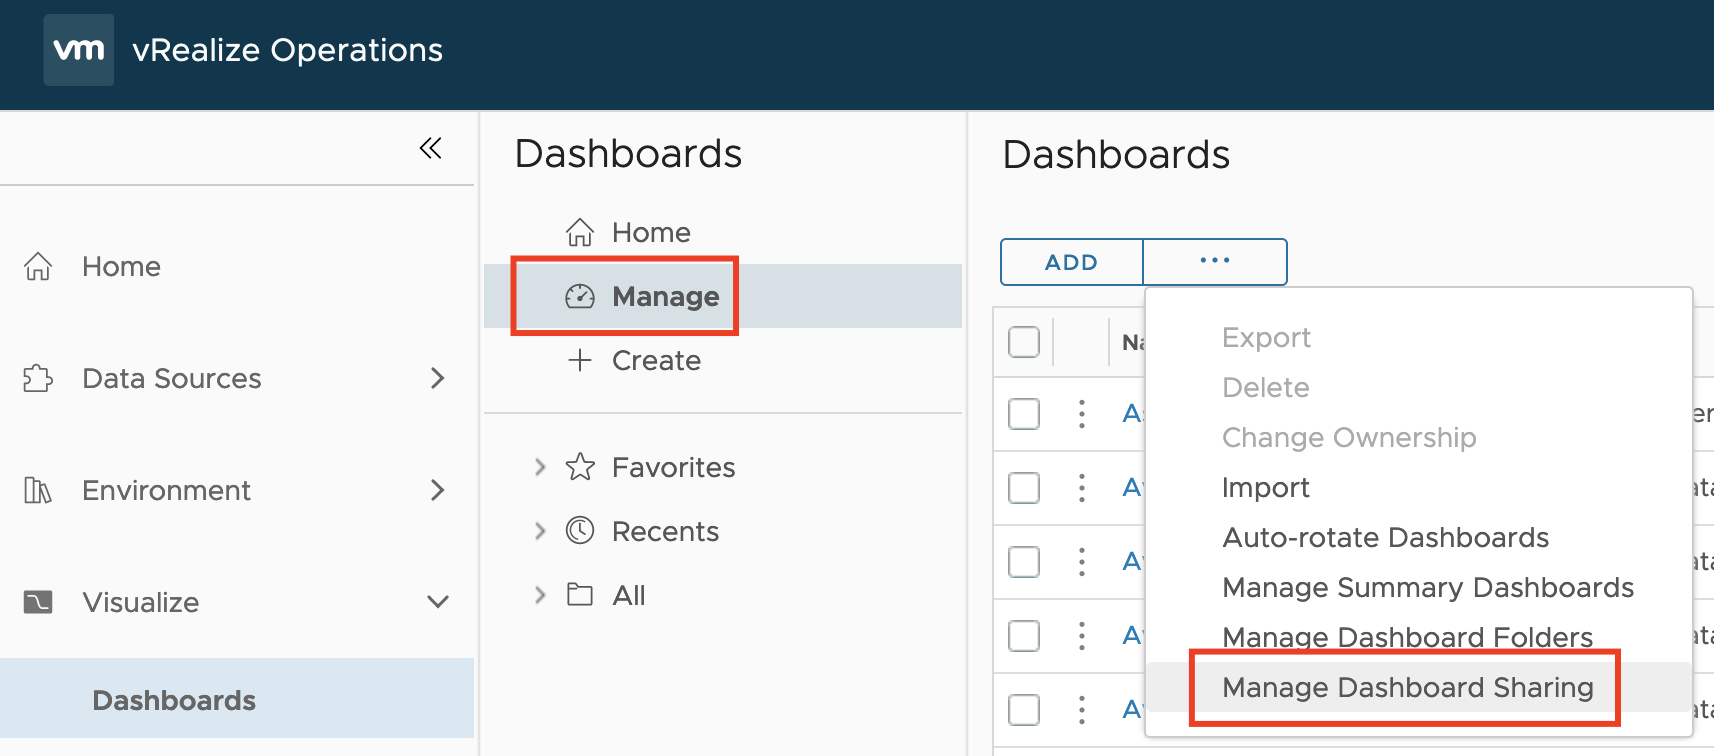
And the last thing to do is to configure dashboard sharing accordingly using in the dashboard management shown in the next picture.

Figure 04: Aria Operations dashboard management

A dashboard can be shared with multiple user groups. In may example I have shared one sample dashboard with one editor and user group and the other sample dashboard with another editor and another user group. This way only dedicated editors (the members of the AD group) have access only to dashboards shared with them, and of course to any other dashboard shared with the built-in group Everyone. The very same way as regular users get access to their respective content.

Figure 05: Aria Operations dashboard sharing

Of course this approach requires a proper user group and dashboard sharing concept but such a concept is recommended anyway.

Stay safe.

Thomas – https://twitter.com/ThomasKopton

vRealize Operations Content Management – CD Pipeline – Part 1

vRealize Operations provide a wide range of content OOB. It gives the Ops teams a variety of dashboards, view, alerts etc. to run and manage their environments.

Sooner or later, in most cases rather sooner than later, vROps users will create their own content. It might be completely new dashboards or maybe just adjusted alert definitions.

Whatever content you create in vRealize Operations, you should treat it like every other software development project.

Ideally you have a development, test and production vROps instances. If this footprint is just too big for your environment, you should at least have a single node test/dev for content development and testing before you import that content into your production instance.

Managing content in vROps, exporting dashboards, views, alert definitions etc. and importing the corresponding files into another vROps instance may be very cumbersome and error prone.

This is where vRealize Suite Lifecycle Manager comes into play.

vRSLCM offers all features to make the management of vRealize Operations (and vRA/vRO/vCenter) content an easy task.

In this post I will describe the basics of vROps content management using vRealize Suite Lifecycle Manager and GitLab.

Logical Design

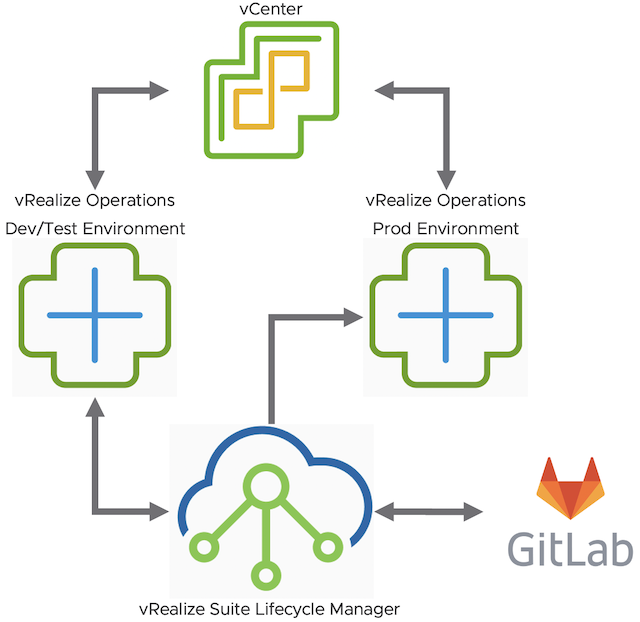
The procedure described in this post is based on the following logical design of the vROps environment including vRSLCM and GitLab.

Figure 1: Logical design

vRSLCM Configuration Overview

In this post I am not going to describe how to configure vRealize Suite Lifecycle Manager, how to add content endpoints is described in detail here:

https://docs.vmware.com/en/VMware-vRealize-Suite-Lifecycle-Manager/8.0.1/com.vmware.vrsuite.lcm.8.0.1.doc/GUID-44C44ECA-6893-4F0D-BE00-54B0817DF5EE.html

For the walkthrough presented in this post I have configured following content endpoints in my vRSLCM.

Figure 2: vRSLCM content endpoints

I have a vRSLCM-deployed vROps instance, serving as my Dev/Test and a vROps-P1 which is the production instance.

Important configuration detail here is, that the production vROps, vROps-P1, is set to accept source controlled content only. If you have only one vROps checking in content into vRSLCM repository you probably won’t set that option. If you do, you will need a source control endpoint, like GitLab. I have set that option to showcase the usage of GitLab and how changes to the content source in GitLab itself can be handled.

Walkthrough – Overview

The steps in my walkthrough are:

  1. Have a content in Dev/Test vROps you would like to deploy to Prod vROps.
  2. Capture content from Dev/Test into vRSLCM repo and GitLab (including Git merge).
  3. Try to deploy content to Prod vROps from vRSLCM repo directly.
  4. Capture and deploy content from GitLab to Prod vROps.
  5. Modify content in GitLab.
  6. Re-capture from GitLab and deploy to all vROps endpoints.

Step 1 – vROps Content

For the demo I am using a simple dashboard as shown in the following picture.

Figure 3: vROps dashboard – first version

The goal is to deploy this dashboard into the production vROps environment.

Step 2 – Capture Content

We start the capture process using the “Add Content” feature.

Figure 4: “Add Content” vRSLCM feature

Obviously we select vRealize Operations as the content endpoint type.

Figure 5: Content capture – endpoint type

As we want to capture the content into the internal vRSLCM repository and into the source controlled repo – GitLab in one step, we are selecting both respective options.

Figure 6: Capture and check in

We select the source endpoint and the dashboard itself. I have also set the option to import all dependencies. In this case there are no dependencies like for e.g. views used as widgets, in other scenarios, vRSLCM will resolve the dependencies and import all needed content parts. I have also selected the “mark content as production ready” option to allow that content to be deployed to my production vROps.

Figure 7: Content capture settings

As we are checking in the content into GitLab, we need to specify the endpoint, repo and branch.

Figure 8: Checking in content into GitLab

After few seconds the content pipelines complete.

Figure 9: Content pipelines

Now we see the merge request in GitLab and after merging the request, the dashboard is available in GitLab repo and treated as any other code.

Figure 10: GitLab merge request
Figure 11: Dashboard as code in GitLab

Step 3 – Deploy Content – First Attempt

At this point we have our dashboard as content in vRSLCM repo and in GitLab.

Figure 12: Content in vRSLCM repo

If we now open the tkopton-Dashjboard-01 we will see the details of the first version and the option to deploy the content to another vROps endpoints.

Figure 13: Content details and deployment – first attempt

In the next picture we can see that our vROps-P1 is not listed as an available endpoint. This is because I have configured that endpoint to accept source controlled content only. This version is not source controlled, it has been captured from Dev/Test vROps into vRSLCM repo, not from the GitLab.

That means, we need to capture the content from GitLab first to be able to deploy it into the production vROps.

Step 4 – Capture from GitLab and Deploy Content – Second Attempt

We start another capture and deploy (in one step) process and this time we select our GitLab as the source.

Figure 14: Capture and deploy content from GitLab
Figure 15: Capture and deploy in one step

We use the same settings as during the first attempt, the capture endpoint is different.

Figure 16: GitLab as capture endpoint

As we are doing capture and deploy in one step, we need to specify the deployment target and options.

Figure 17: Deployment target settings

And now we can see in the Figure 17 that our production vROps-P1 is available in the list of destination endpoints.

Now the same dashboard is available in the production vROps and in vRSLCM repo we see the second version of the dashboard wich is source controlled.

Figure 18: Source controlled content

Step 5 – Edit Content in GitLab

Let us change the name of one of our widgets. And let us do it in GitLab instead of editing the dashboard in vROps. The dashboard is just another source code from the content repository perspective.

Figure 19: Editing the content source in GitLab

Step 6 – Re-Capture and Re-Deploy Content

After re-capturing the content from GitLab following the same procedure as in step 4 but this time without deploying the content, we see another version in the vRSLCM repo.

Figure 20: GitLab updated version of the dashboard in vRSLCM

After deploying the updated content to our vROps endpoints, we see the dashboard having a new caption for the first widget.

Figure 21: Updated dashboard in vROps

Conclusion

With vRealize Suite Lifecycle Manager and GitLab you have a perfect foundation to create your own CD pipeline for vRealize Operations content.

In the next part I will describe how to extend the pipelines with custom workflows provided by e.g. vRealize Orchestrator.

Stay safe.

Thomas – https://twitter.com/ThomasKopton