vSphere High Availability (vSphere HA) and Admission Control ensure that sufficient resources are reserved for virtual machine recovery when a host fails. Usually, my customers are running their vSphere clusters in either N+1 or N*2 configurations reflected corresponding Admission Control settings
In one of my previous blog posts, I have described how vRealize Operations helps with capacity management for N+1 and N*2 configured clusters.
In this post, I will describe how vRealize Operations helps to monitor the vSphere infrastructure to find any deviations from the desired HA and Admission Control state.
The dashboard and all needed components can be, as always, found on code.vmware.com:
https://code.vmware.com/samples?id=7508
Motivation
Even if you are responsible for a very small environment, just few ESXi clusters, do you have a complete, reliable and current overview of the HA and Admission Control settings on every cluster? Do you know any possible deviations from your desired state?
A few simple vROps Super Metrics, Views, and one Dashboard can help you maintain exactly the state of your vSphere Environment that will ensure sufficient resources for virtual machine recovery when a host or multiple hosts fail(s).
How the Dashboard works
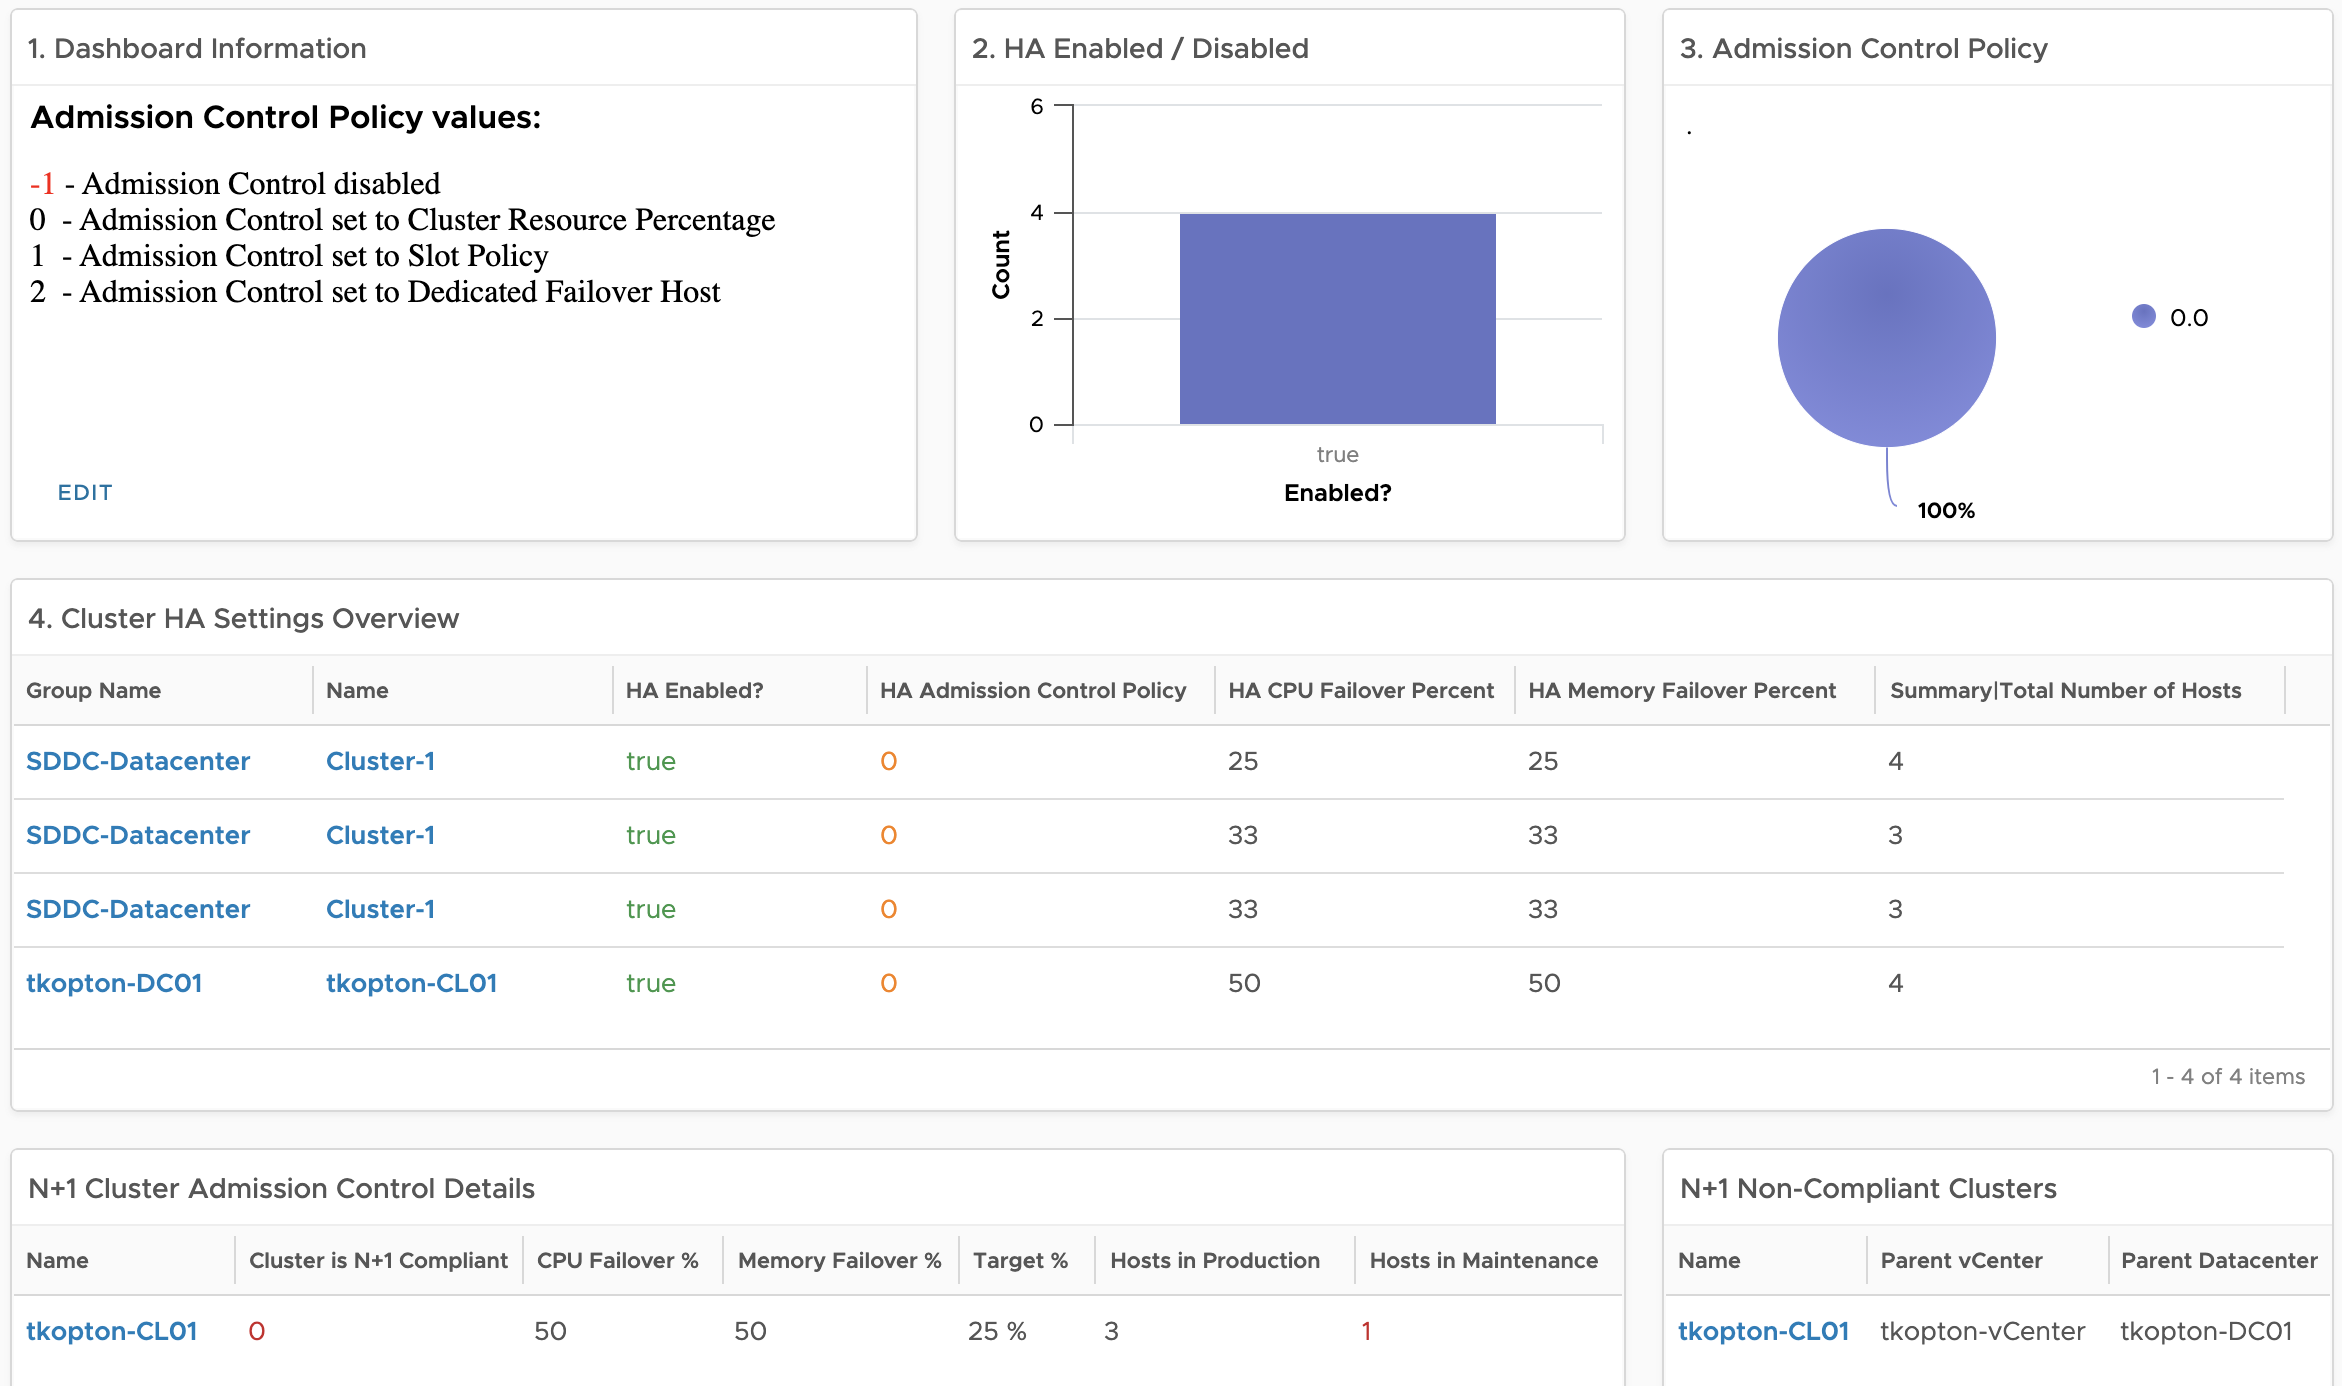
The dashboard will help you answer a few simple questions:
- Is HA enabled on my ESXi clusters?
- What Admission Control Policy is configured?
- What is the current amount (in %) of reserved CPU and memory resources on every single cluster?
- Does the current amount (in %) of reserved CPU and memory resources configured through Admission Controlequal the desired amount as intended by the selected capacity model for the cluster, N+1 or N*2?
The base indicator to differentiate between different models is a vSphere tag. To make the vROps views work right after importing them, correct tags need to be assigned to the clusters.

These tags are used as filters in the N+1 and N*2 centric views.
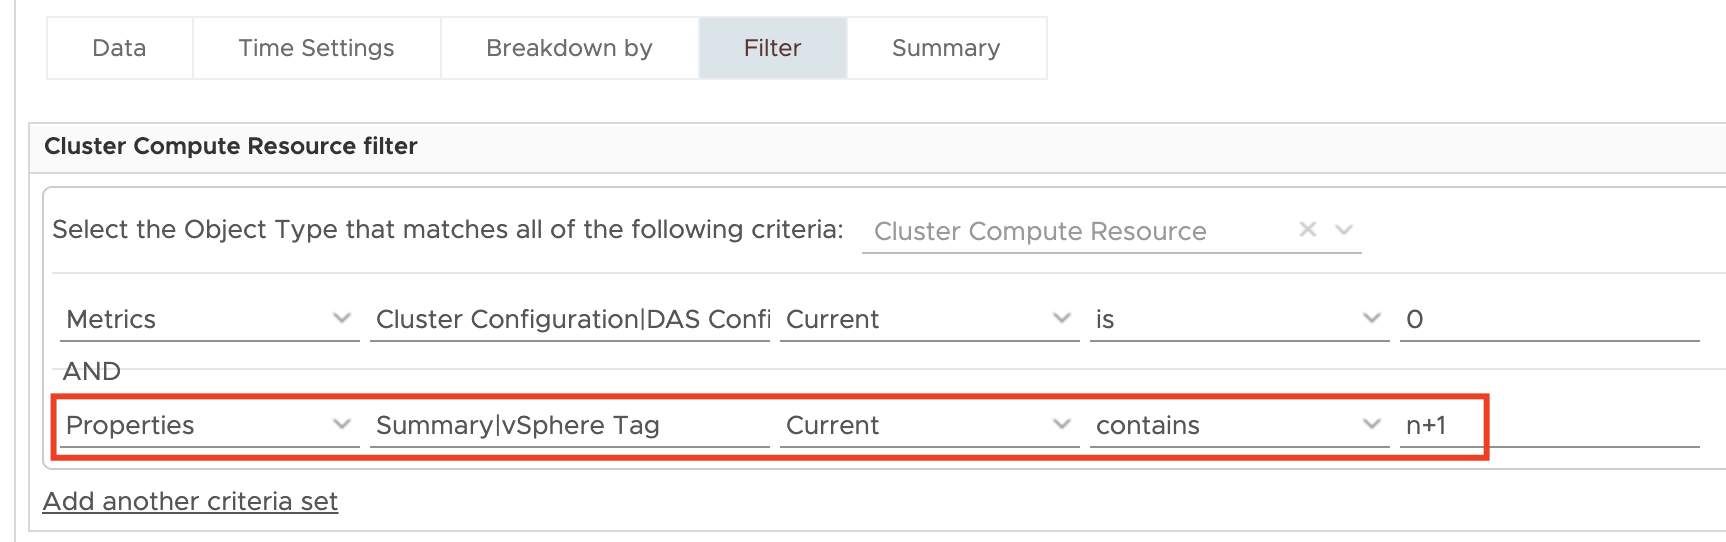
For N+1 clusters we need to calculate the desired value for reserved CPU and memory resources and compare that value with the current value calculated by vSphere. To take any ESXi hosts in maintenance I have also added additional information regarding the count of ESXi hosts in maintenance and the count of hosts contributing to the current pool of compute resources.

To make this dashboard work in your environment you need to set the vSphere tags appropriately. Of course, you can use your own tags and adjust the filters in the views accordingly.
Do not forget to enable the imported Super Metrics in your policies.
Stay safe.
Thomas – https://twitter.com/ThomasKopton
1 Comment