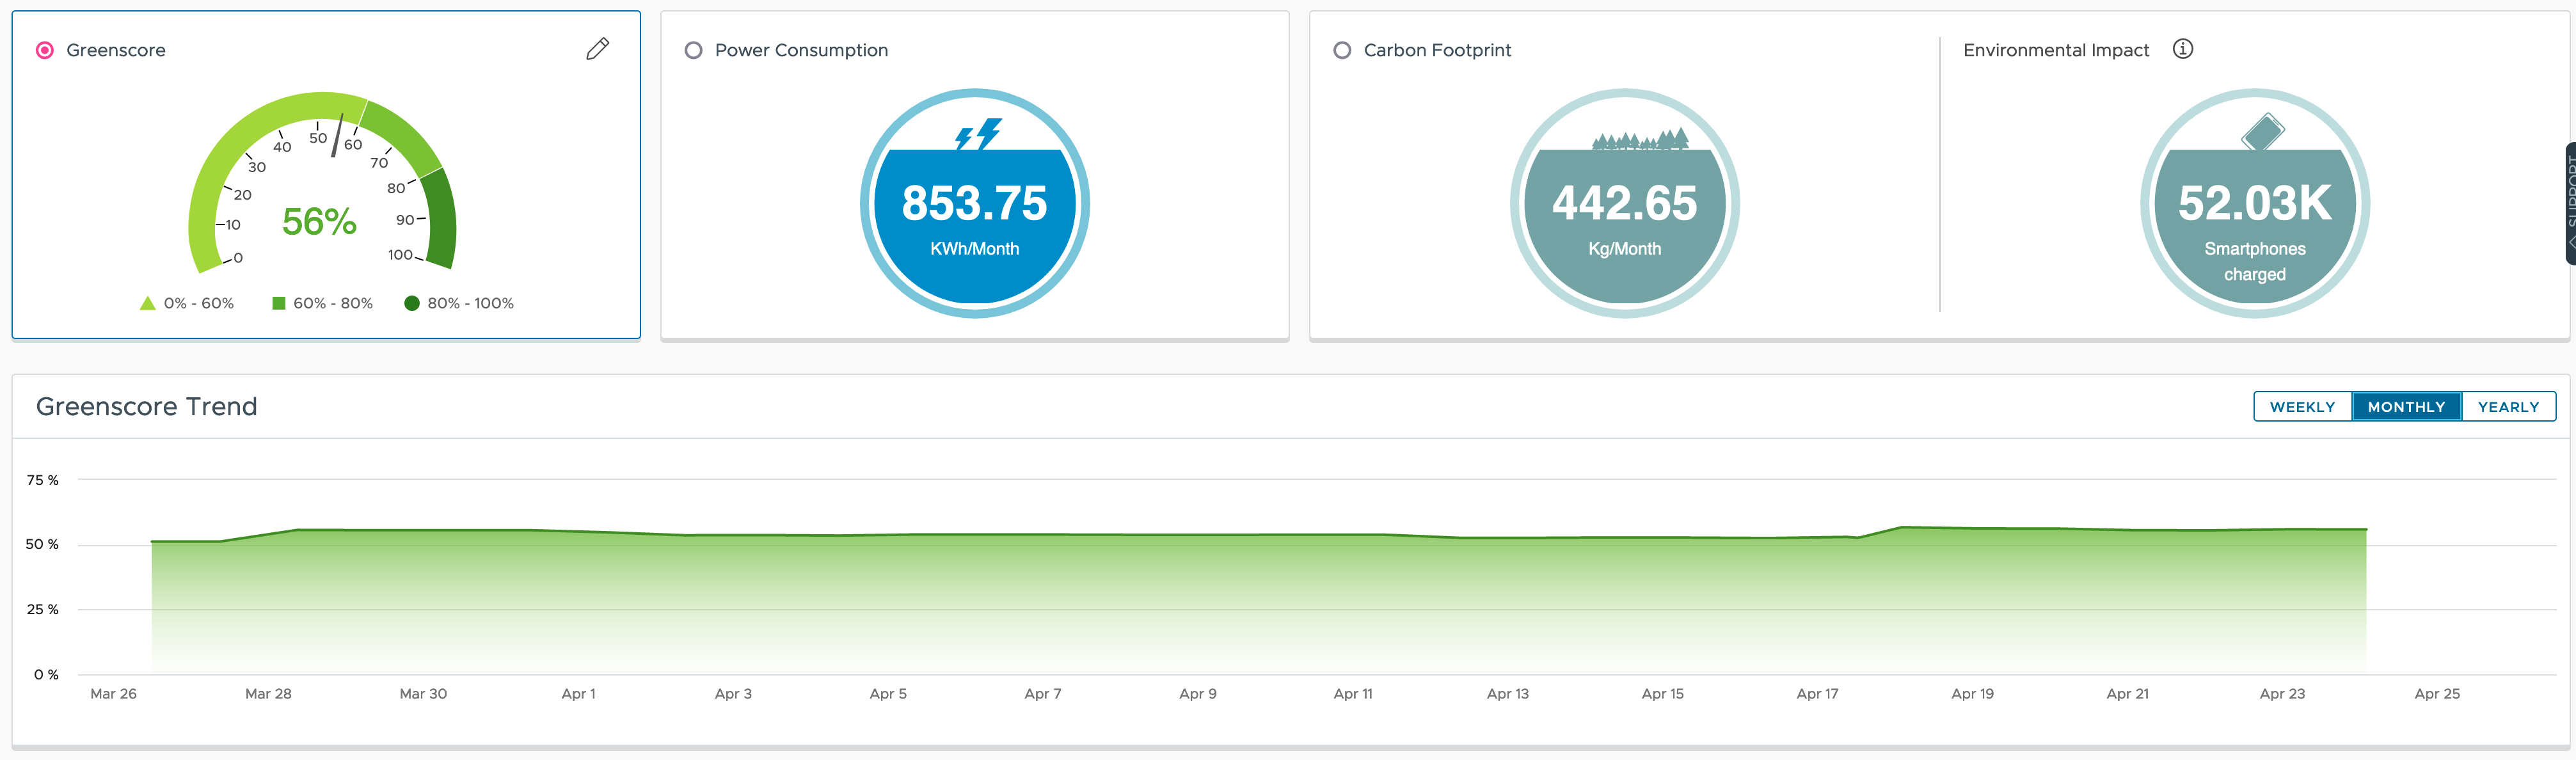
One of the advantaged of VMware Aria Operations Cloud over the on-premises option is the availability of Near Real-Time Monitoring for the most important vSphere metrics. This is especially very helpful when troubleshooting short-lived issues.
However, this option brings with it a small challenge, especially if some of such near real-time metrics are later used as the basis for Super Metrics or in automation workflows.
So what is the challenge?
How 5-minutes collection cycle works in VMware Aria Operations
VMware Aria Operations is configured to collect data every 5 minutes form its source as per default. Basically the collector process wakes up every 5 minutes and gets last 15 samples, each of 20 seconds interval, from the source like for example from vCenter server. The next picture shows the 15 samples, and 15 x 20 seconds are 5 minutes – the default collection cycle

These fifteen 20 seconds samples are average and ONE value is saved in the FSDB (File System Database) of Aria Operations. Since few versions of Aria Operations you can also configure the policy to save also the (one and only one) max (Peak) value out of the 20 samples in addition to the averaged value. The next two pictures show the policy setting for one of such metrics (not all have this capability) and how it looks like in the metrics view.

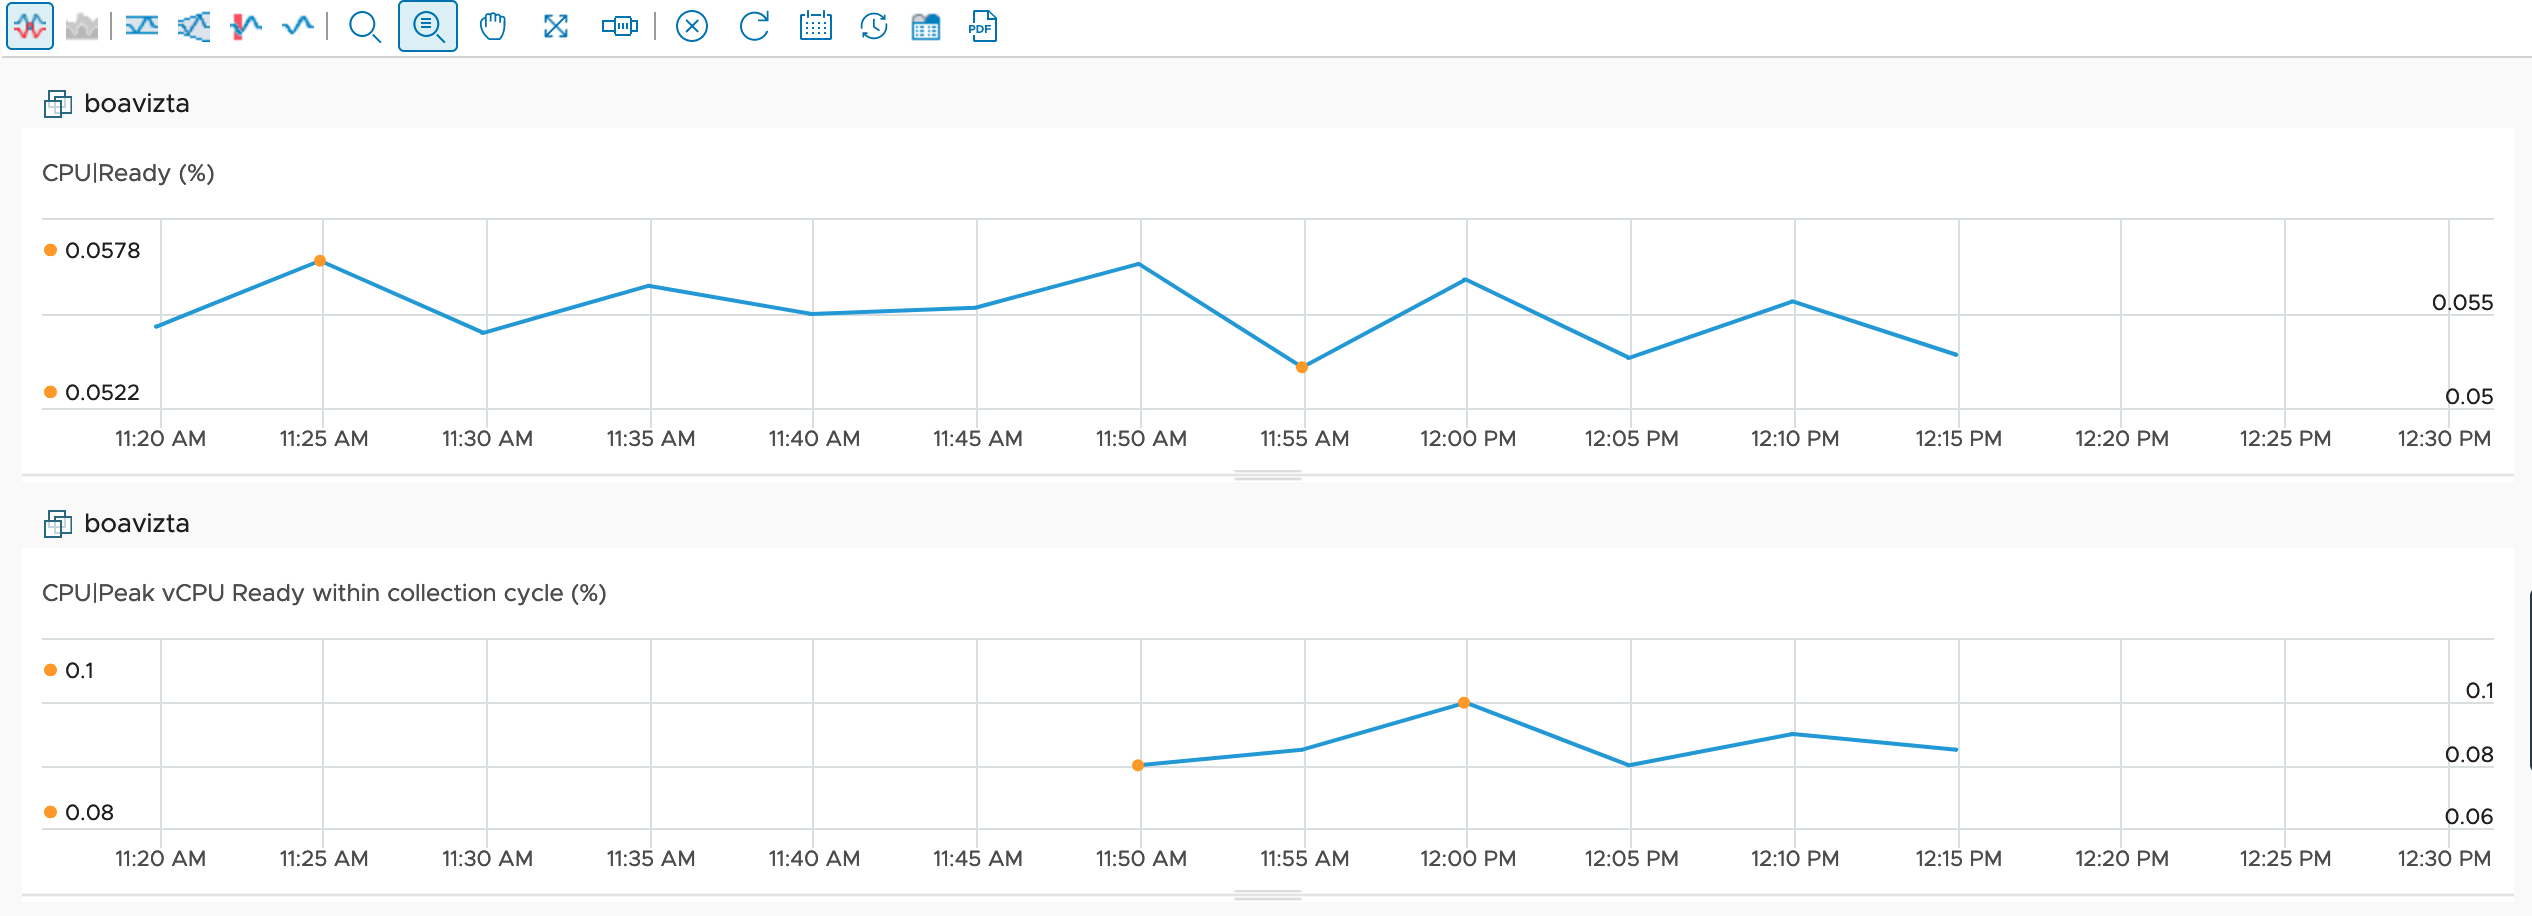
Near Real-Time Option in VMware Aria Operations Cloud
One of the options available only in the Cloud version is Near Real-Time Monitoring for (selected) vCenter Adapter metrics. With this option activated, Aria Operations stores not only the averaged value but also all fifteen 20 seconds samples (with a three day history for this near real-time time series data).
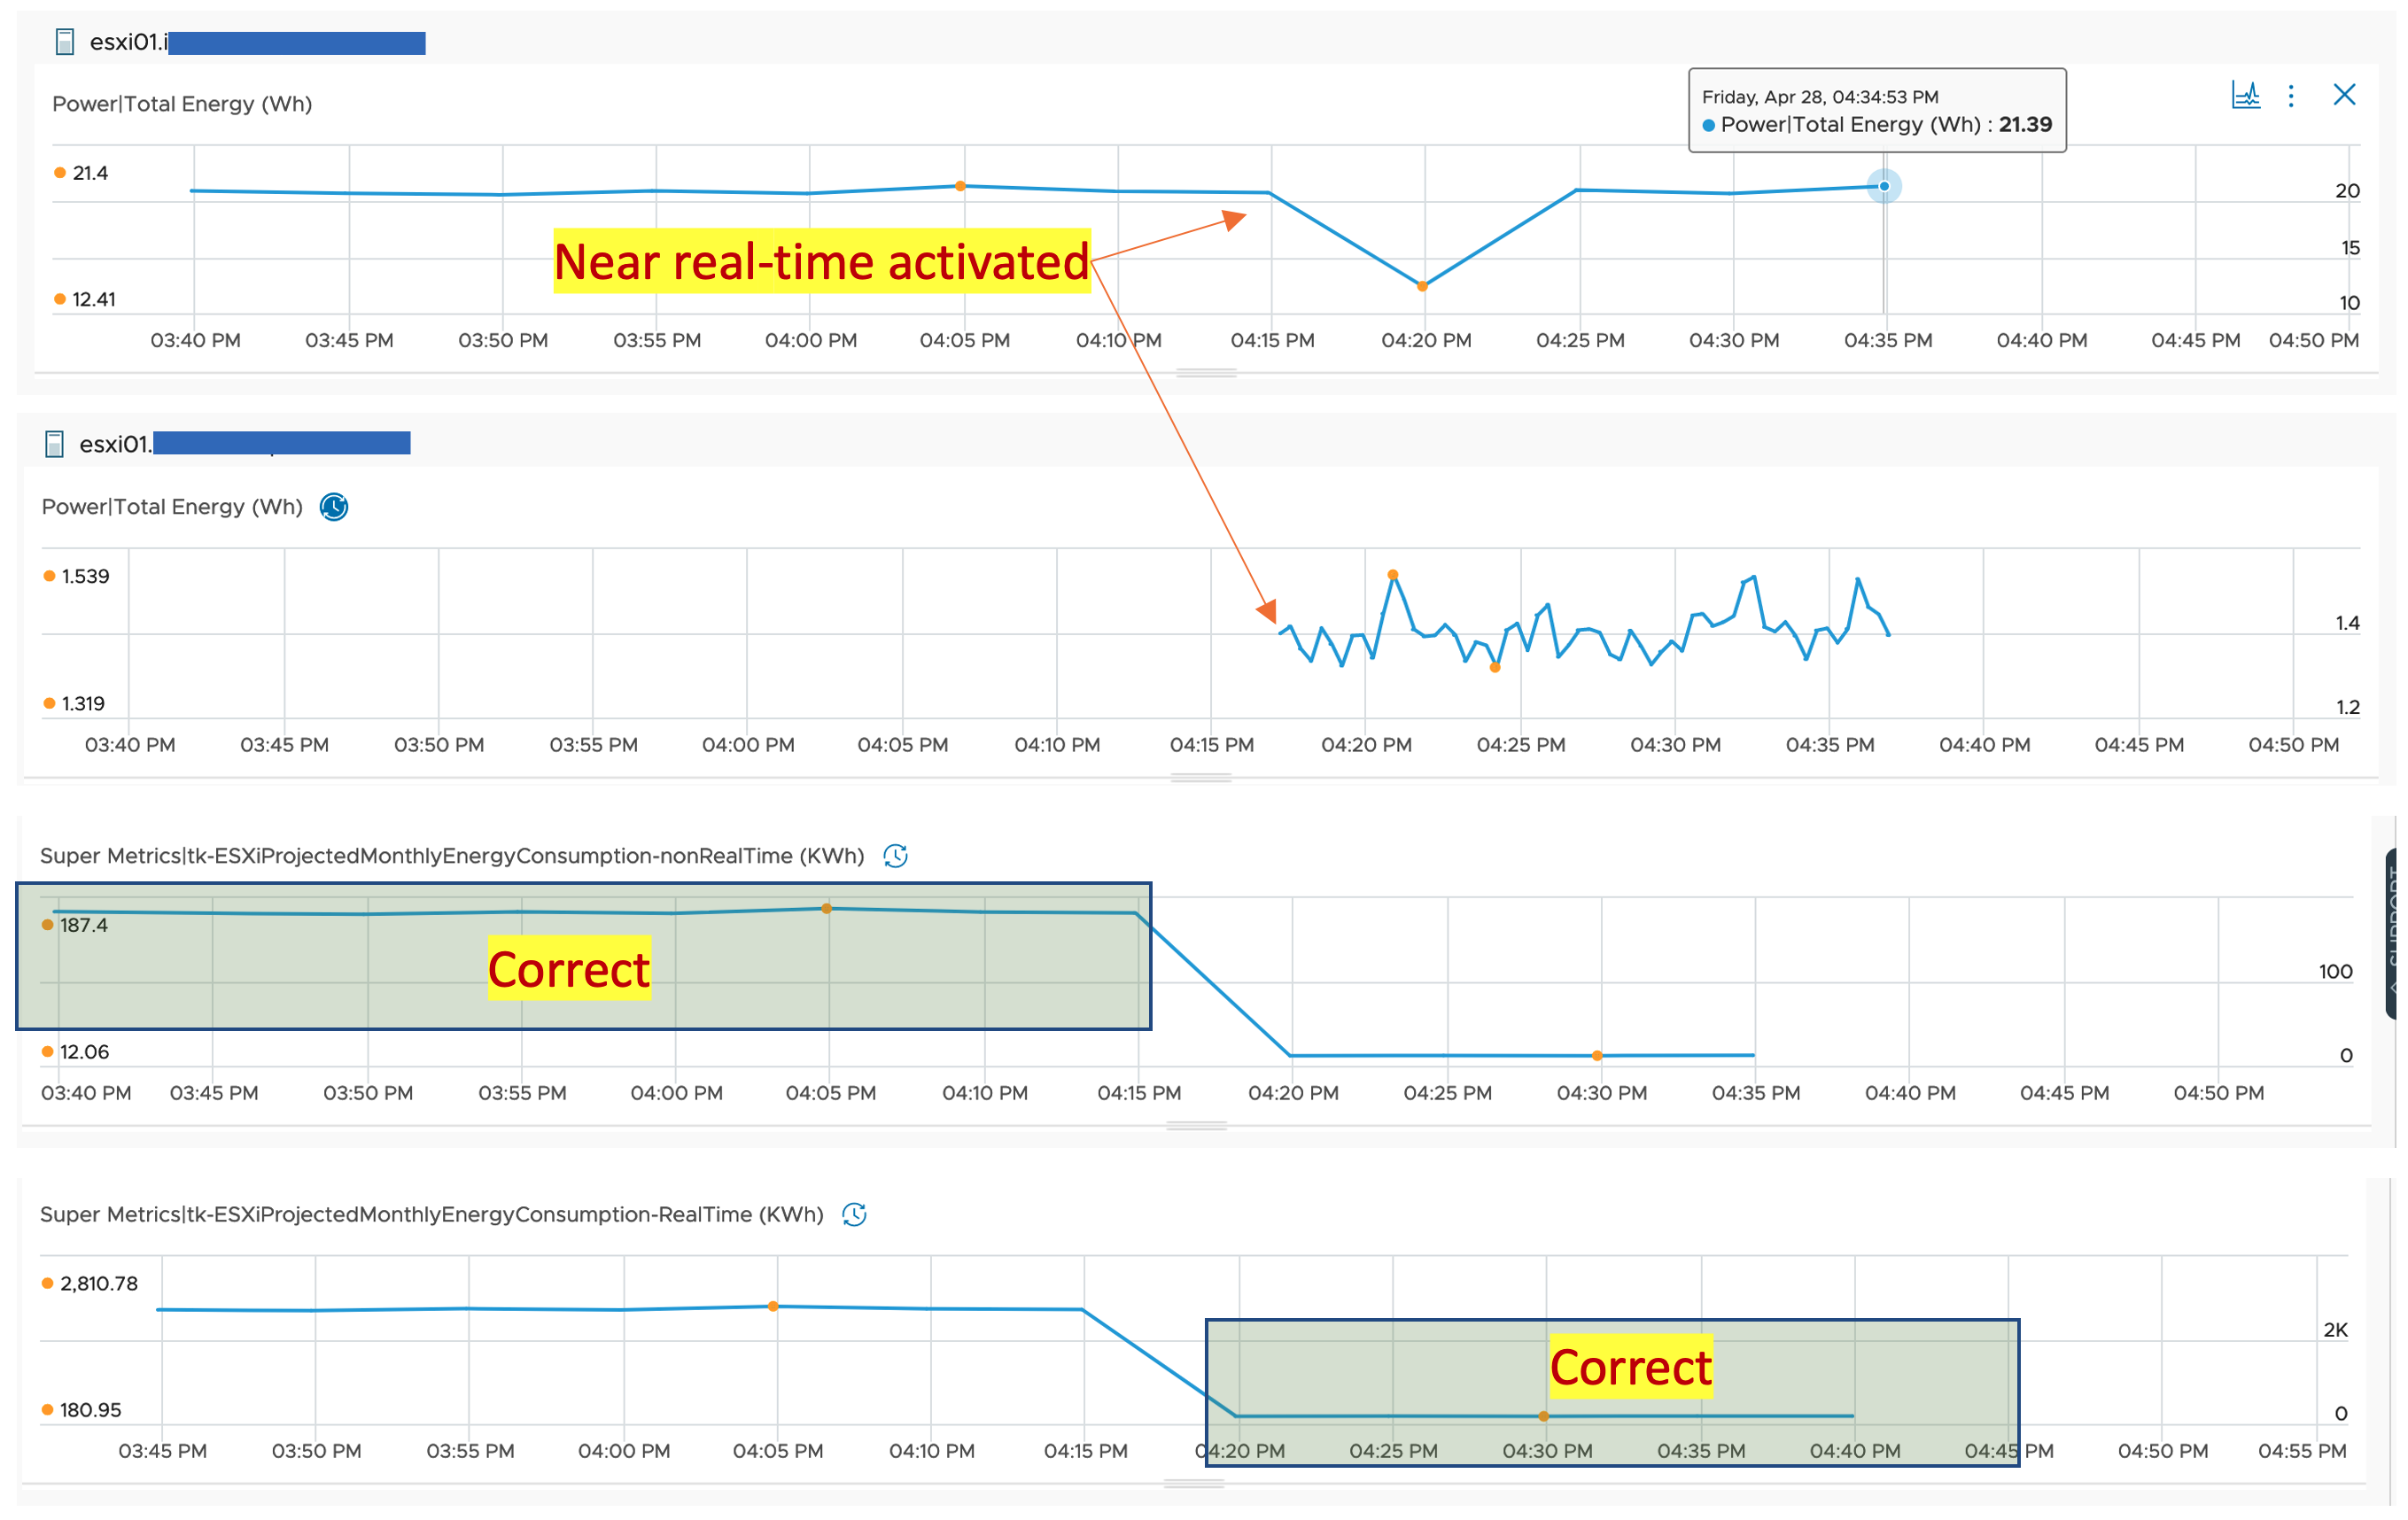
The next two pictures show the difference between the 5-minutes default collection and the near real-time activated (the small blue clock icon).
The Challenge
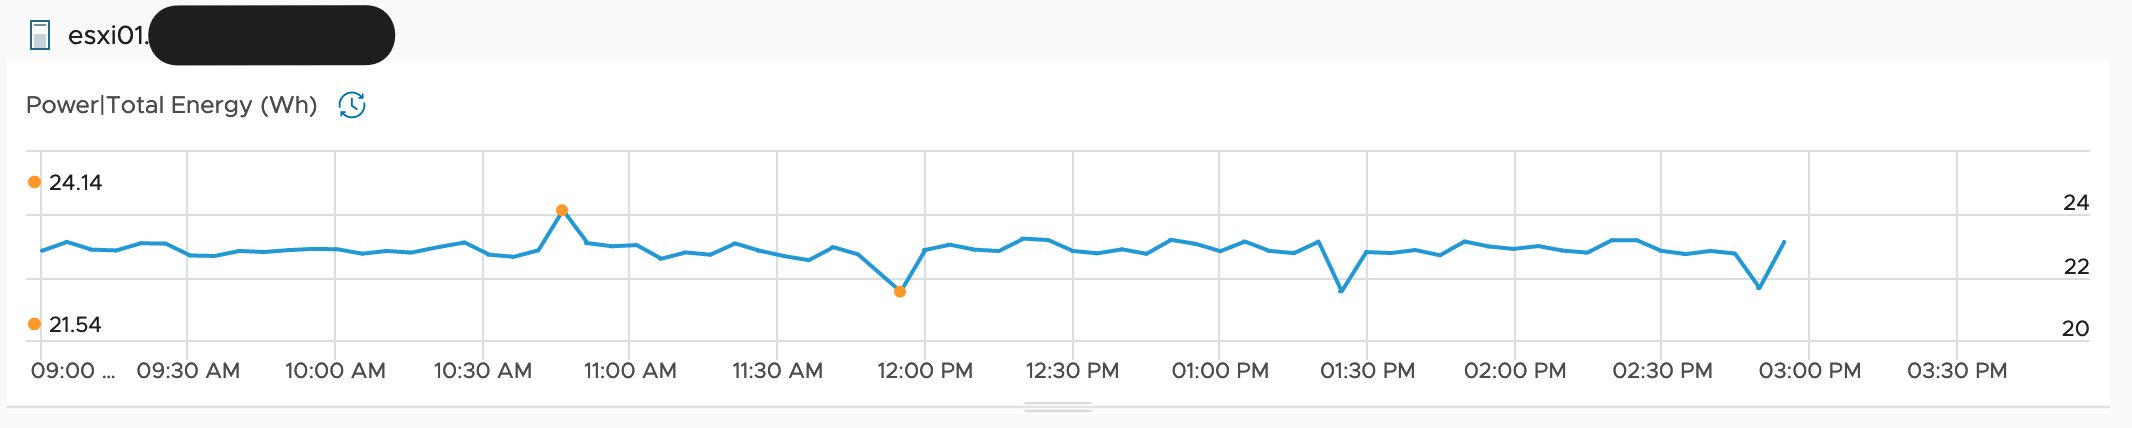
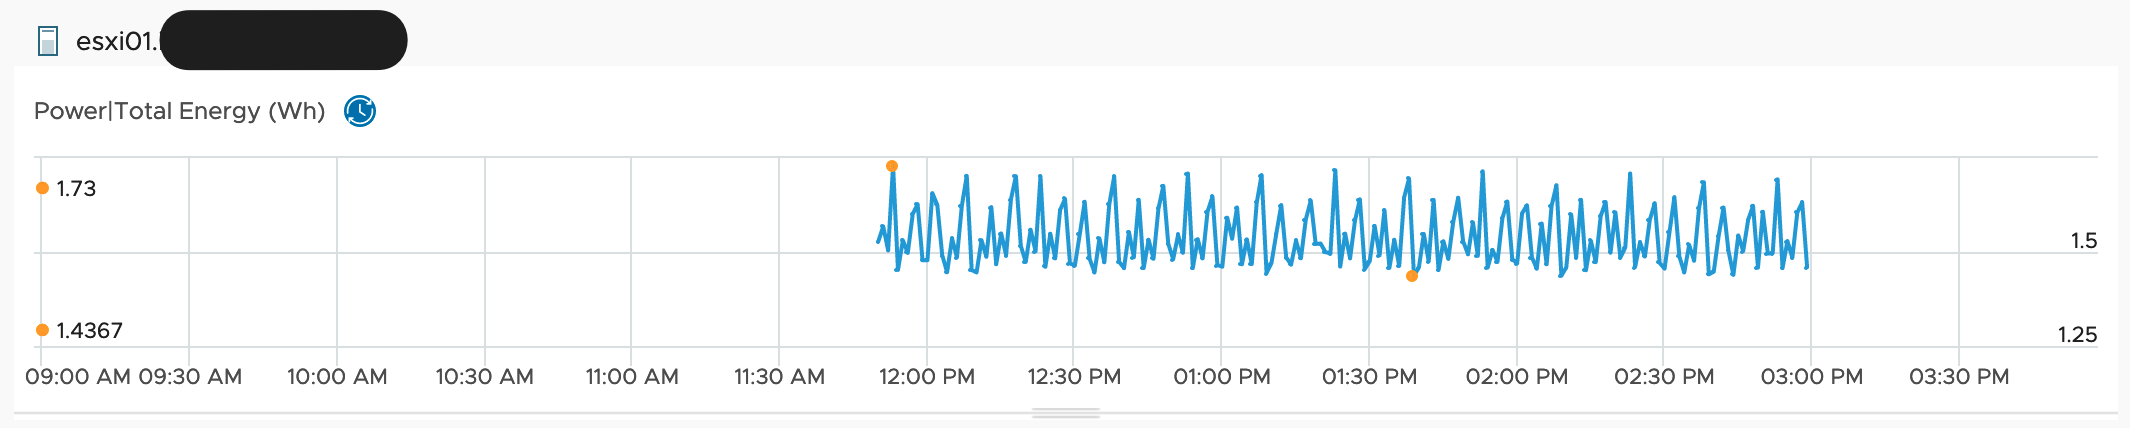
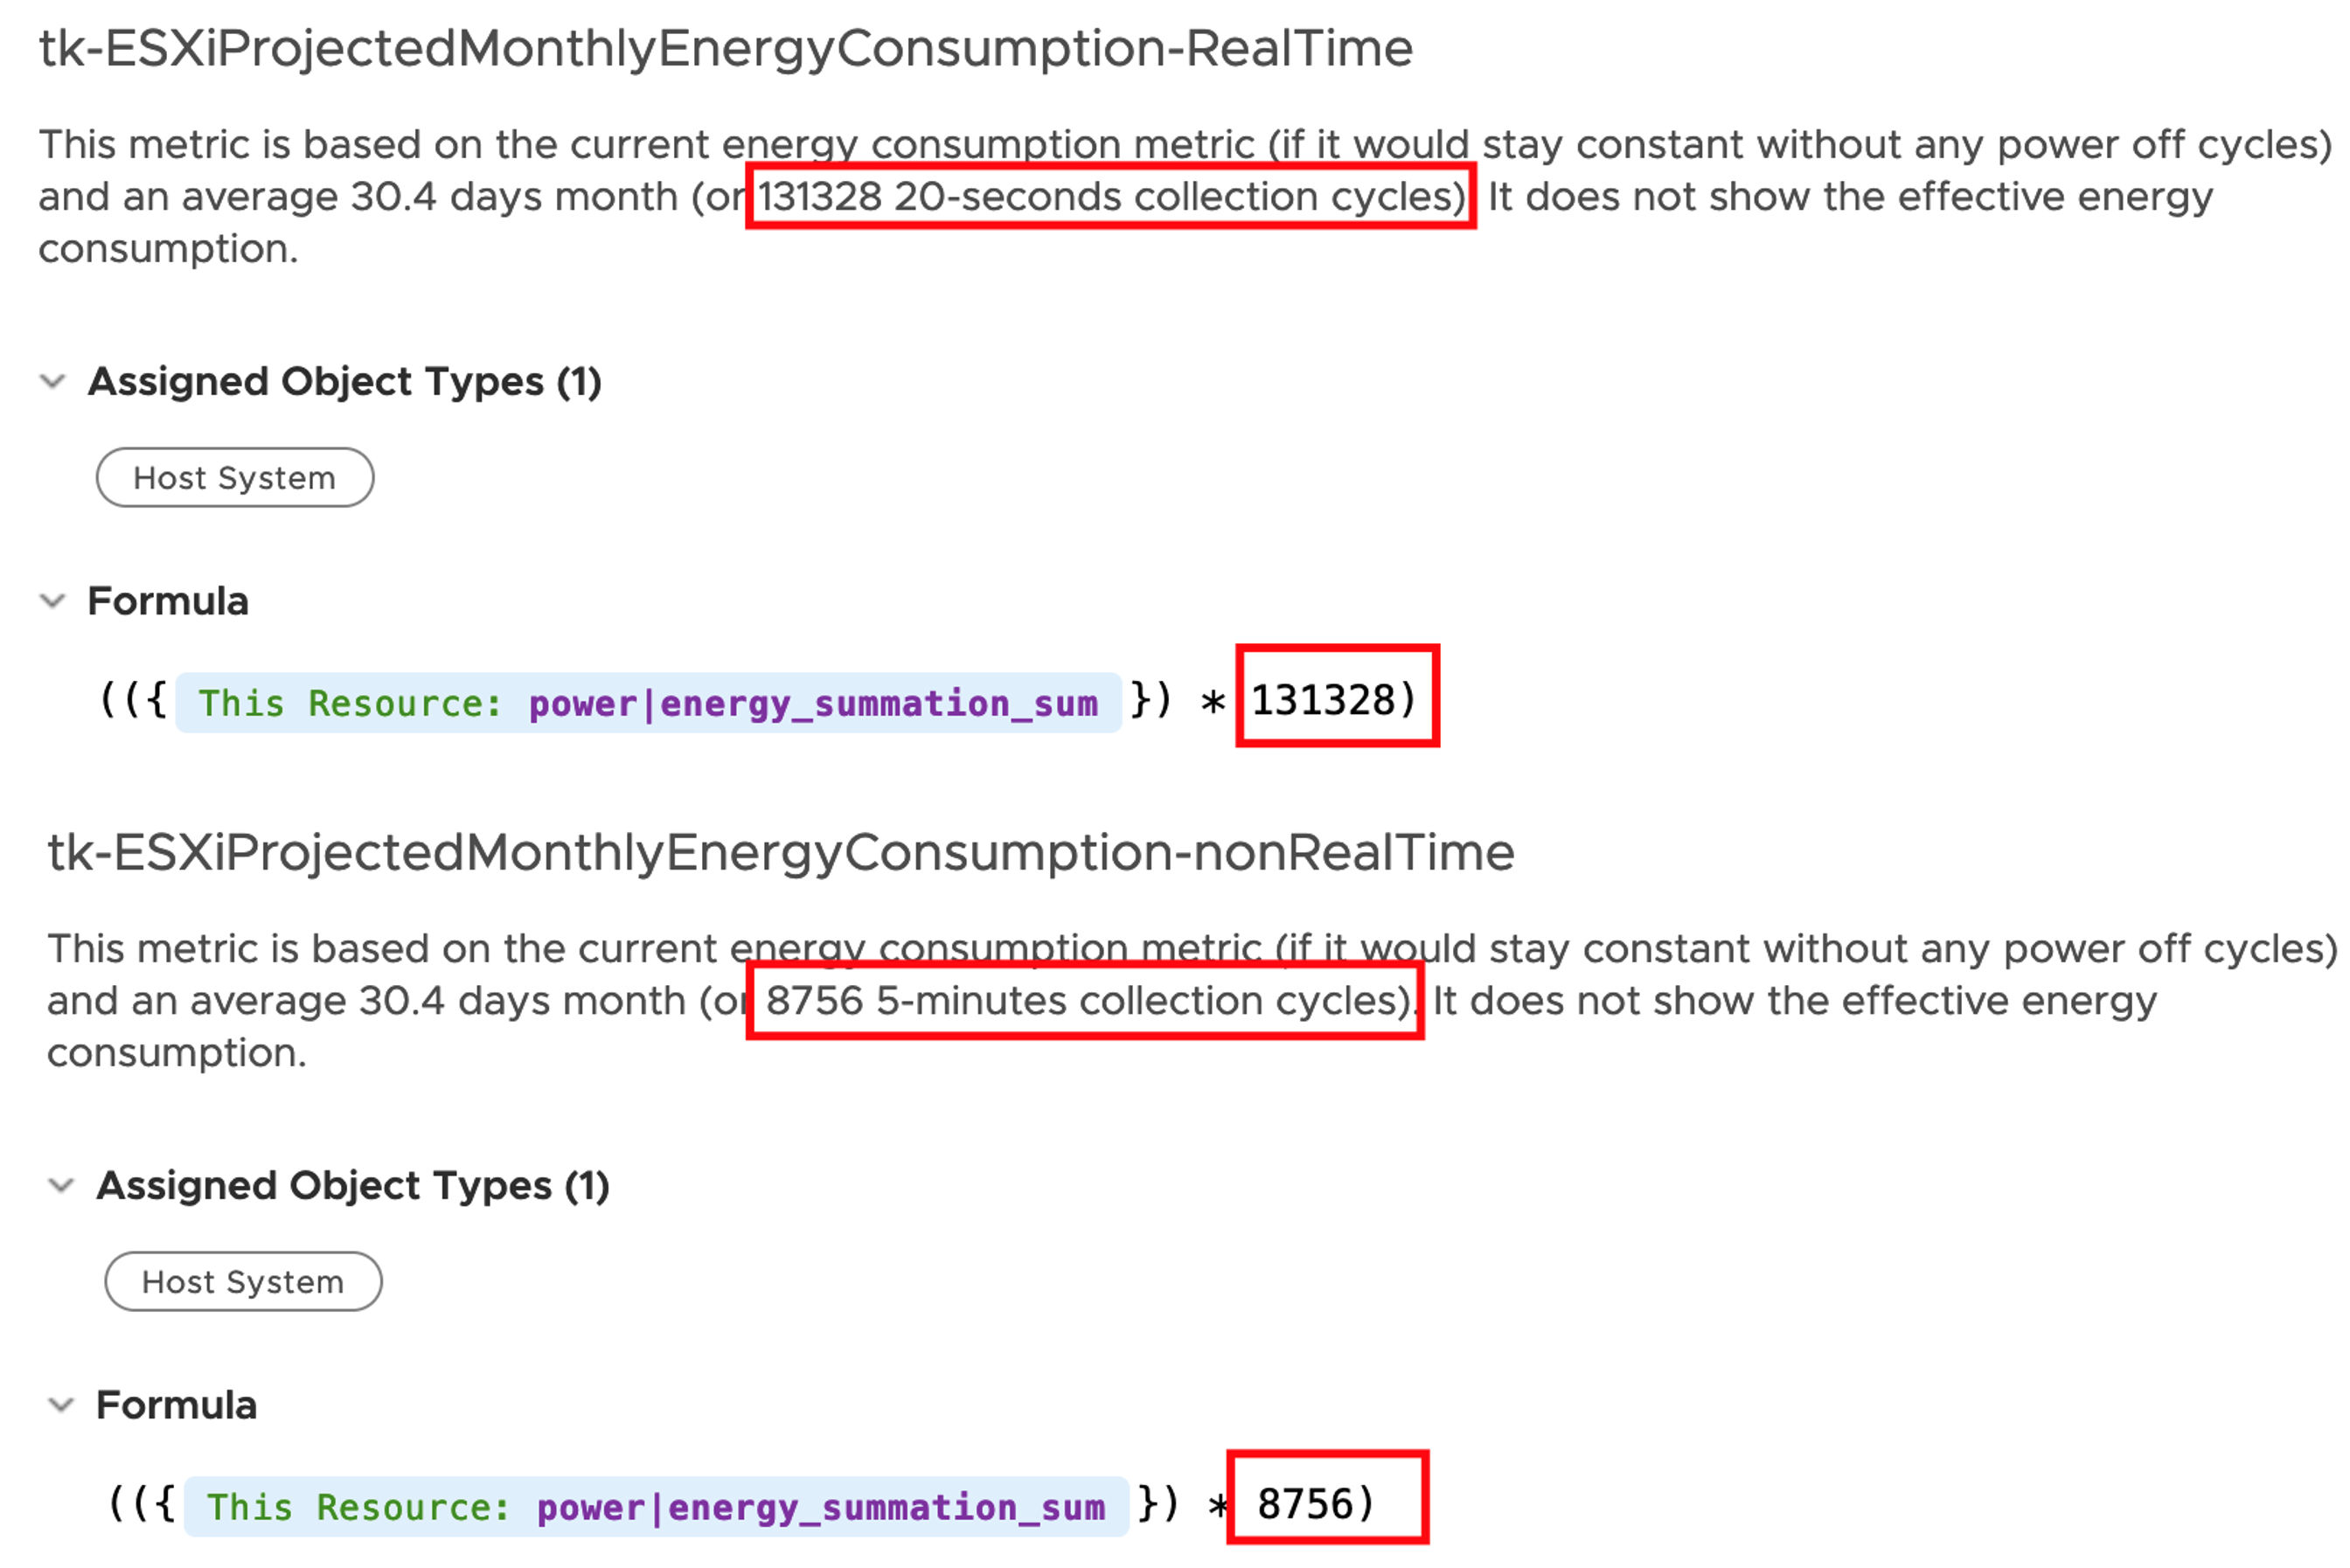
When Near Real-Time Monitoring is activated Super Metrics (as at the time of writing this blog post) will use the 20 seconds near real-time values in their formulas. This is for the majority of metrics absolutely OK but one needs to be careful with metrics representing a sum or product over time, like for example the Power|Total Energy (Wh) metric, which represents the energy consumption for a time period – 5 minutes per default or 20 seconds with activated Near Real-Time Monitoring. You can see the difference in the value in the previous screenshots – ca. 23Wh for 5 minutes vs. ca. 1.6Wh for 20 seconds, the math works 1.6 * 15 = 24.
Possible Solutions
If this metric is used as basis for further calculations in Super Metrics, the formula might need some adjustments. Like in the following example which extrapolates the value to calculate expected monthly usage.
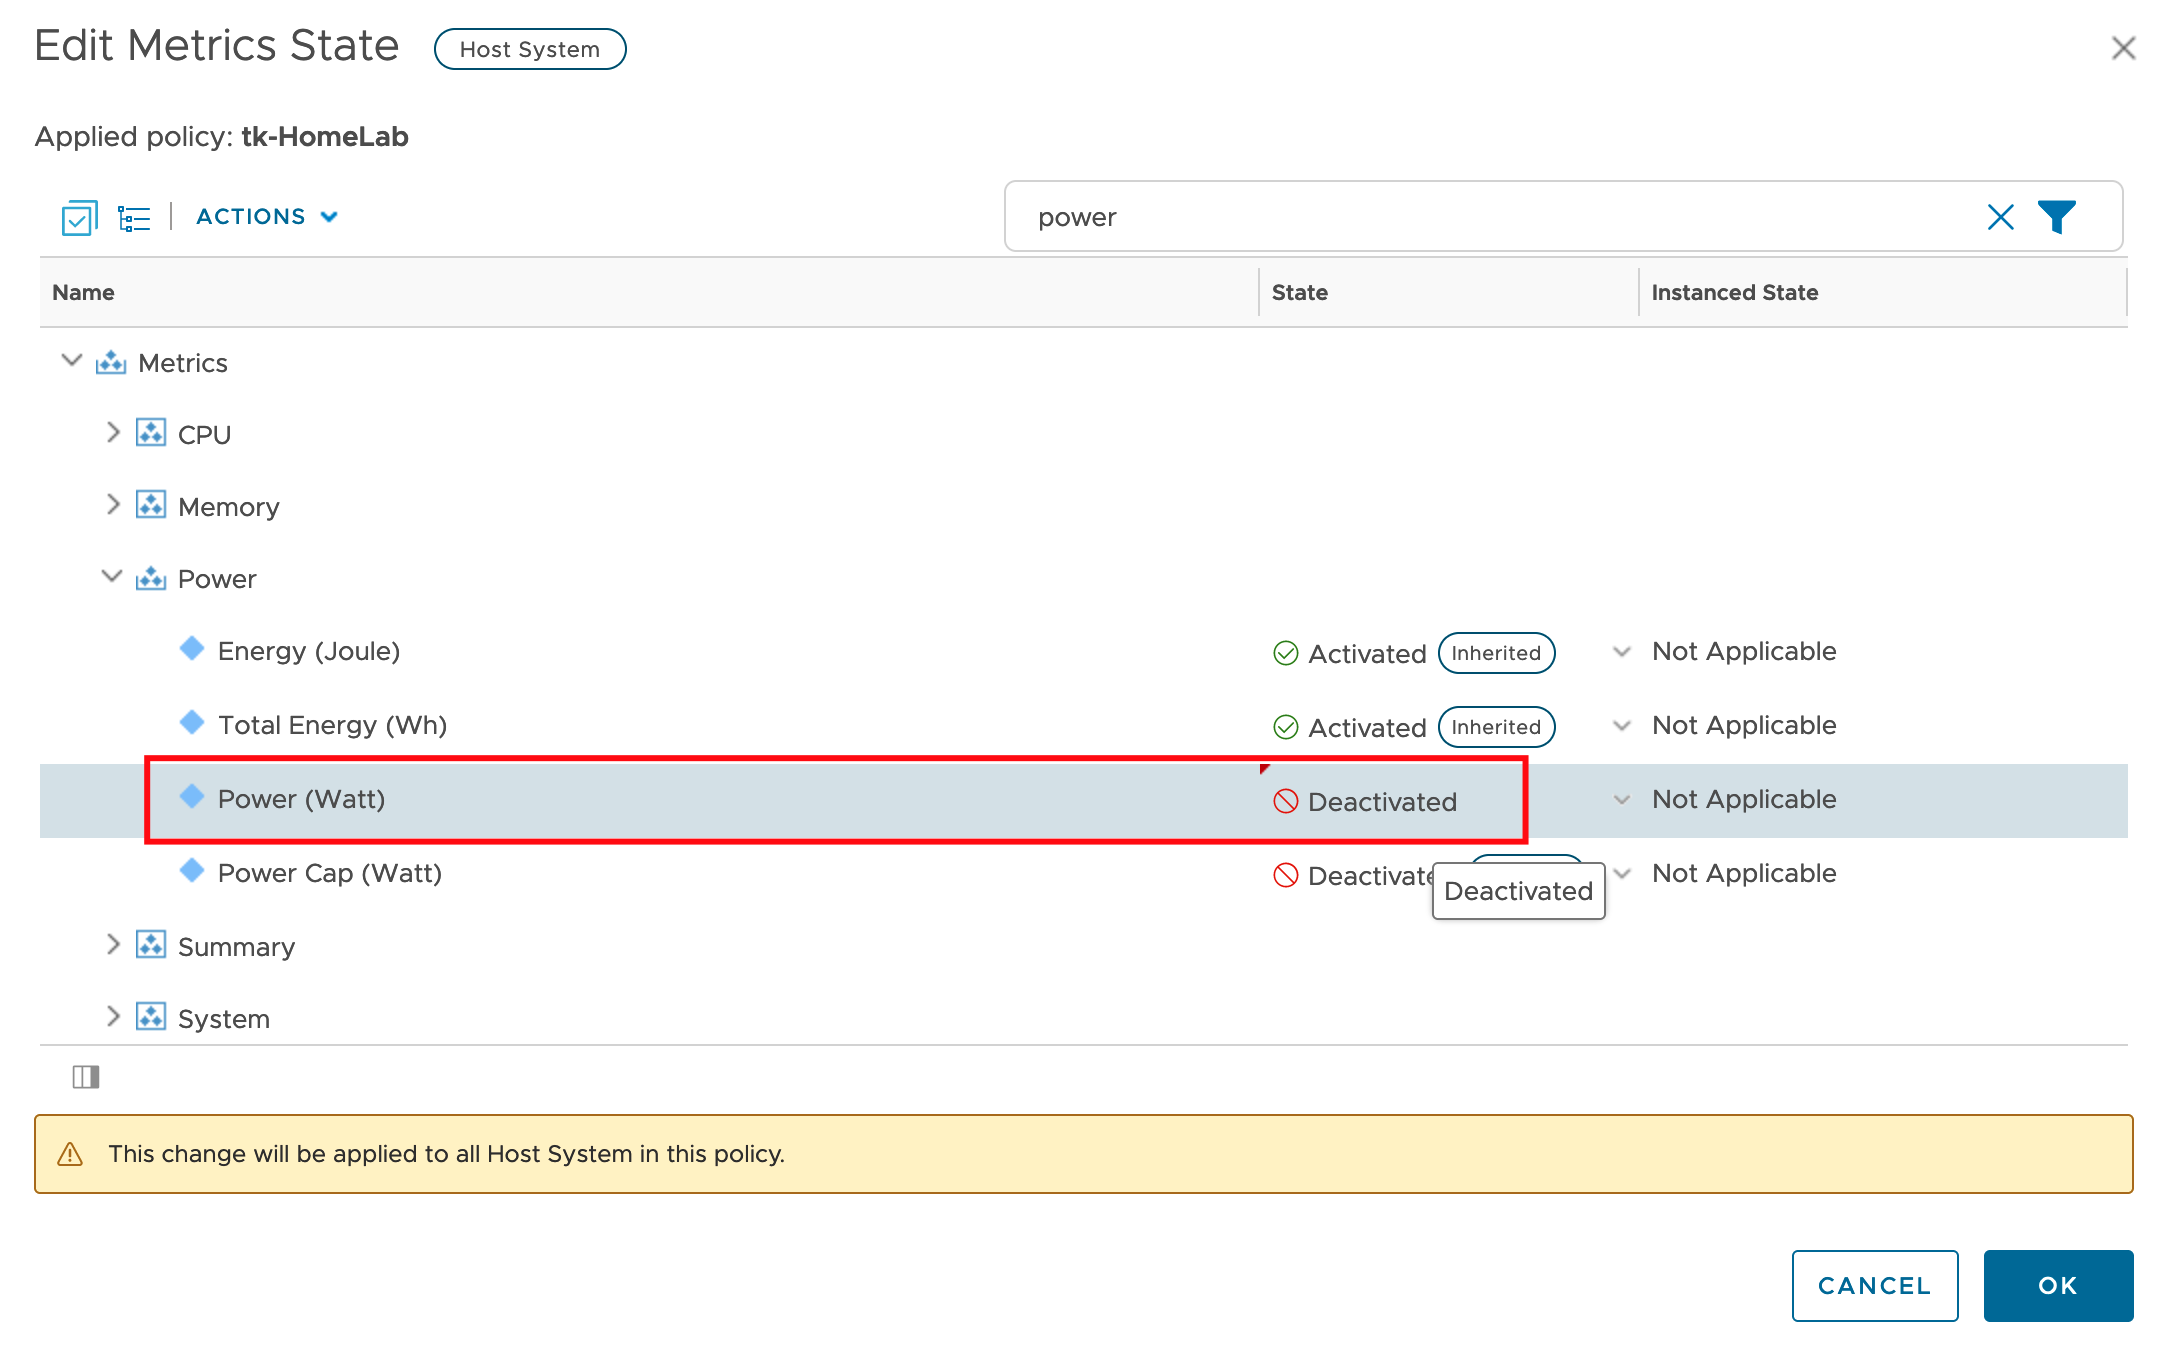
Another option is to check if there is any other metric, which might be used in Super Metrics and are deactivated in the Policy as per default. Like for example the Power(W) metric as depicted in the next figure.
In the next picture you can see the impact the choice of the right formula and values makes.
Stay tuned for more Sustainability related post.
Stay safe.
Thomas – https://twitter.com/ThomasKopto