My last posts focused on sustainability and how VMware Aria Operations can help get more insights into energy consumption, infrastructure efficiency and how to improve operations and make the virtual infrastructure more sustainable.
In this post I will describe how I used an old Raspberry Pi, a DHT22 sensors, few Shelly Plug S smart plugs and VMware Aria Operations for Applications (FKA Tanzu Observability, FKA Wavefront) to get environment, power usage, energy consumption, energy costs and carbon emissions insights of my various devices.
Hardware
An old Raspberry Pi Model B Rev 2 on my desk was waiting for a new usage purpose and I thought it would be a good idea measure the temperature and humidity in my server rack, simply to see if I need any additional cooling. In my case it is rather a proof of concept but in real data centers this information can easily help adjust the cooling system and save energy.
The DHT22 sensor and how to attach it to the Pi is very well described here:
https://pimylifeup.com/raspberry-pi-humidity-sensor-dht22
I am already getting power usage data from my HPE servers via vSphere and for example VMware Aria Operations, power consumption of all other devices was however a blind spot. A very convenient, providing a well documented API, and not extremely expensive way to get that information (and enable home automation) are the Shelly Smart Devices. For this use case I have ordered few of the Smart Plug and Switch devices.
https://www.shelly.cloud/de-ch/products/product-overview/1xplugs/shelly-plug-s-5-pack
Software
To process the DHT22 temperature and humidity data I have forked:
https://github.com/adafruit/Adafruit_Python_DHT
And did some modifications to better meet my requirements:
https://github.com/tkopton/raspberry-pi-dht22-rest-api
I know, I need to switch to CircuitPython libraries, this is in my backlog;-)
The small REST server is providing the data I need:
{
    "sensors": [
        {
            "humidity": 60.0,
            "id": 1,
            "name": "Rack01-Bottom",
            "temperature": 19.5,
            "timestamp": "2023-05-09T14:05:12.970183"
        },
        {
            "humidity": 53.599998474121094,
            "id": 2,
            "name": "Rack02-Top",
            "temperature": 22.299999237060547,
            "timestamp": "2023-05-09T14:05:12.970183"
        }
    ]
}
The Shelly devices provide a REST API (and MQTT, but this is something for another blog post) OOTB. The JSON responses include all the needed data for my use cases.
{
    "meters": [
        {
            "power": 559.12,
            "overpower": 0.00,
            "is_valid": true,
            "timestamp": 1683640714,
            "counters": [
                574.193,
                599.288,
                597.426
            ],
            "total": 1728563
        }
    ]
}
To get all these metrics into Aria Operations for Applications I am using a Wavefront Proxy running in my lab and the Telegraf agent configured with the HTTP Plugin.
The high-level setup is fairly simple:
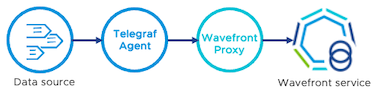
The Telegraf HTTP plugin is extremely easy to configure, few lines of config are sufficient to get all the data in. The first example shows the configuration for my Pi+DHT22 sensor and the second one for two Shelly devices (plug and switch):
[[inputs.http]]
  urls = [
    "http://192.168.0.151:5000/api/v1/sensors"
  ]
  method = "GET"

  timeout = "10s"
  data_format = "json"
  json_string_fields = ["name"]
[[inputs.http]]
urls = [
"http://192.168.0.23/status/0"
]
method = "GET"
username = "admin"
password = "secret"
timeout = "10s"
data_format = "json"
name_override = "shellyplug_lroom_tv"
[[inputs.http]]
urls = [
"http://192.168.0.17/status/0"
]
method = "GET"
username = "admin"
password = "secret"
timeout = "10s"
data_format = "json"
name_override = "shellyplug_basement_rack"
[[inputs.http]]
urls = [
"http://192.168.0.24/rpc"
]
method = "POST"
body = '''
{"id":1,"method":"Switch.GetStatus","params":{"id":0}}
'''
timeout = "10s"
data_format = "json"
name_override = "shellyswitch_kitchen_light_top"To calculate the carbon emissions we need to correct kgCO2 per kWh energy factor.
I am retrieving this real-time value (30-days trial) from:
https://app.electricitymaps.com/map
This is the config and after the trial I will switch to another source:
[[inputs.http]]
  urls = [
    "https://api-access.electricitymaps.com/$myID/carbon-intensity/latest?zone=DE"
  ]

  interval = "60m"
  method = "GET"
  headers = {"X-BLOBR-KEY" = "secret"}
  timeout = "10s"
  data_format = "json"
  name_override = "ElectricityMap_DE"
Outcome
Now it’s time to get insights from the data🙂
As I am still learning the WQL (Wavefront Query Language), these examples might not be perfect but they serve my use cases:
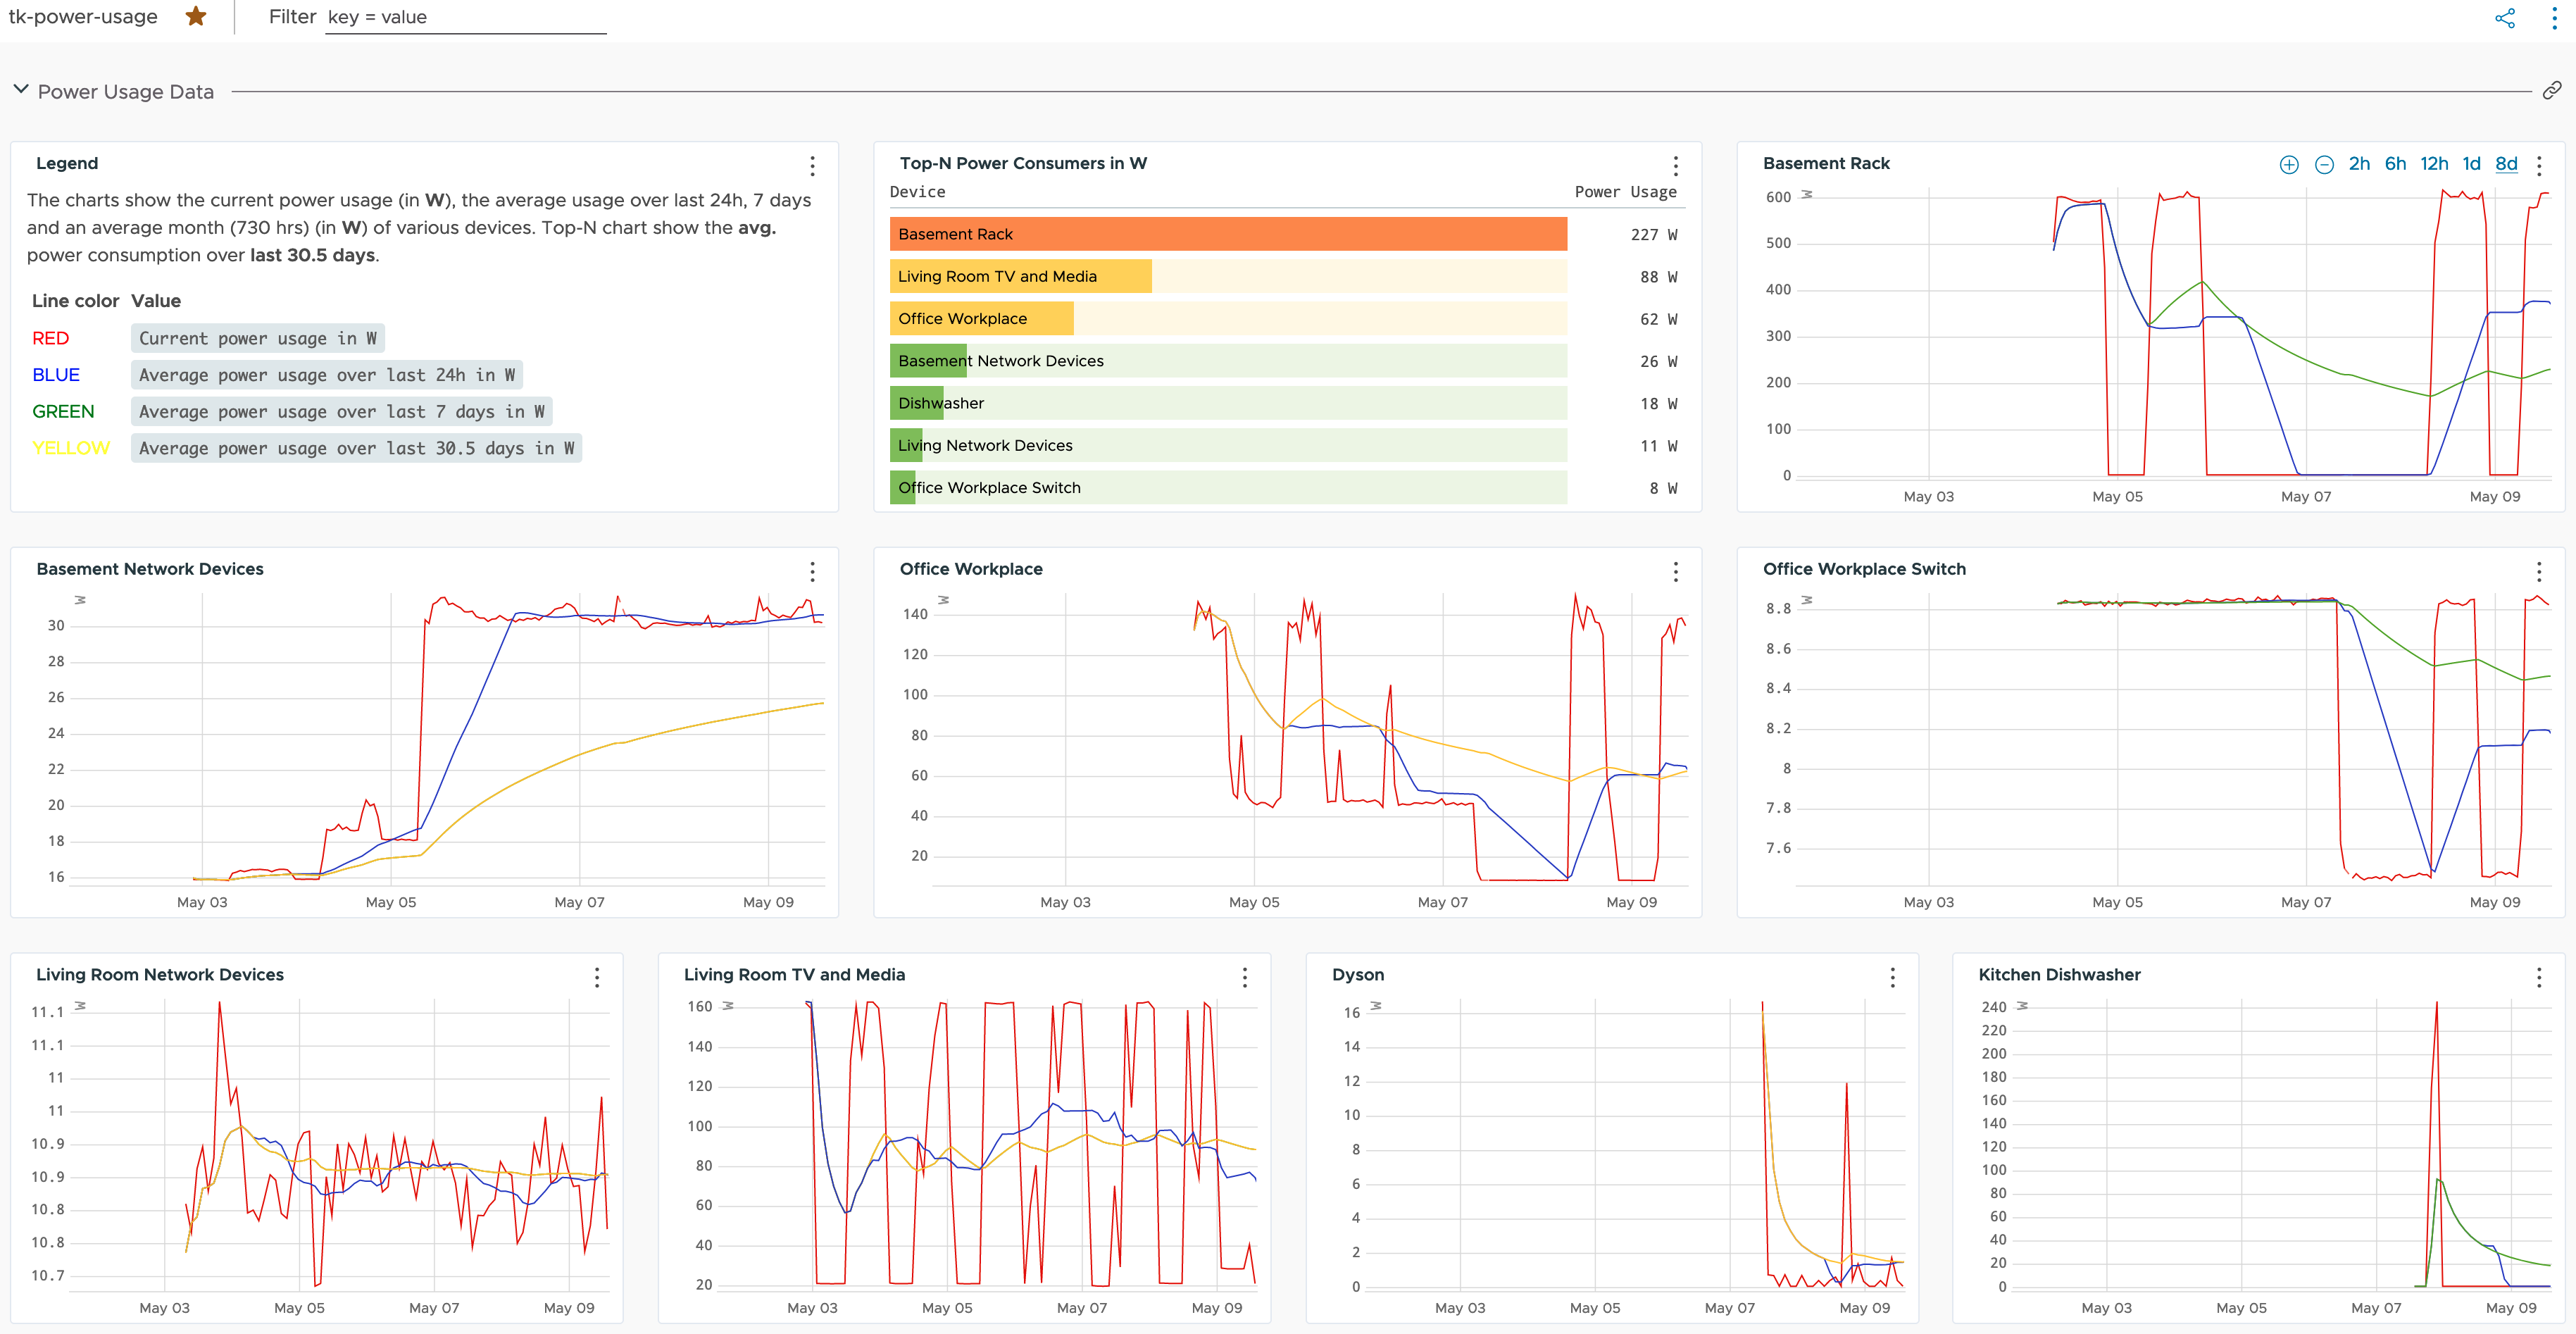
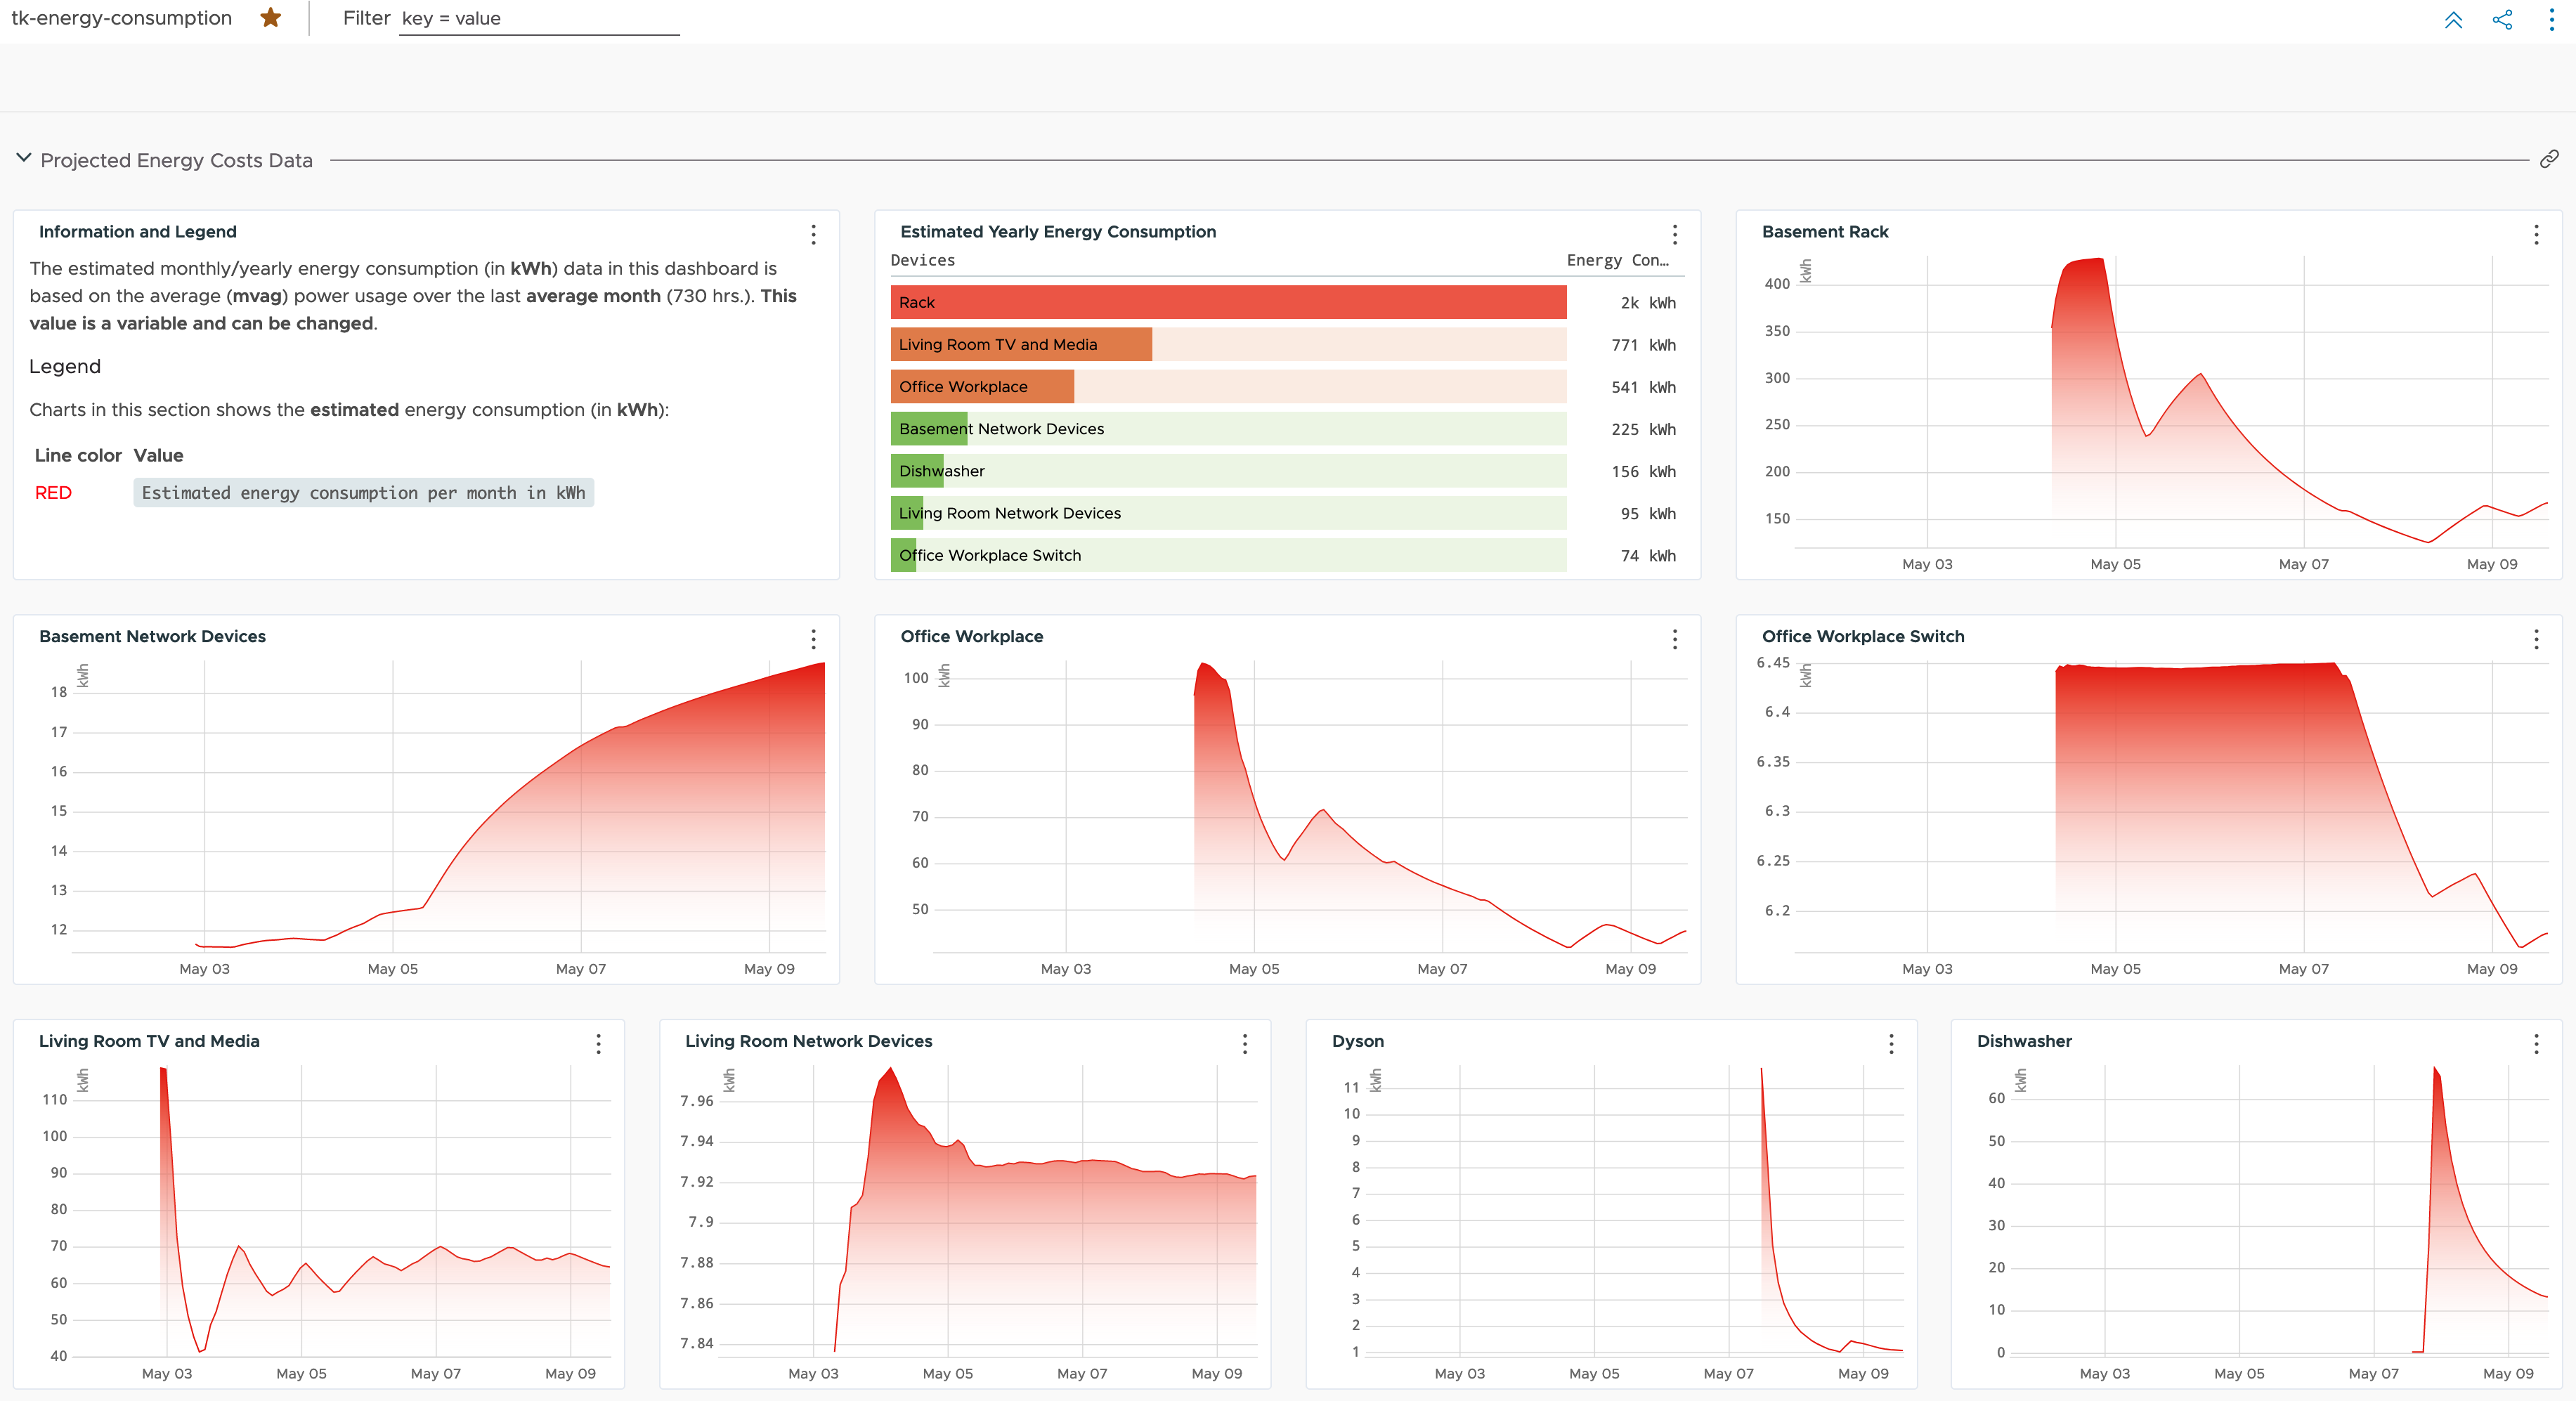
- I want to know the power usage of my devices
- I want to know the projected energy consumption of my devices over month, year etc.
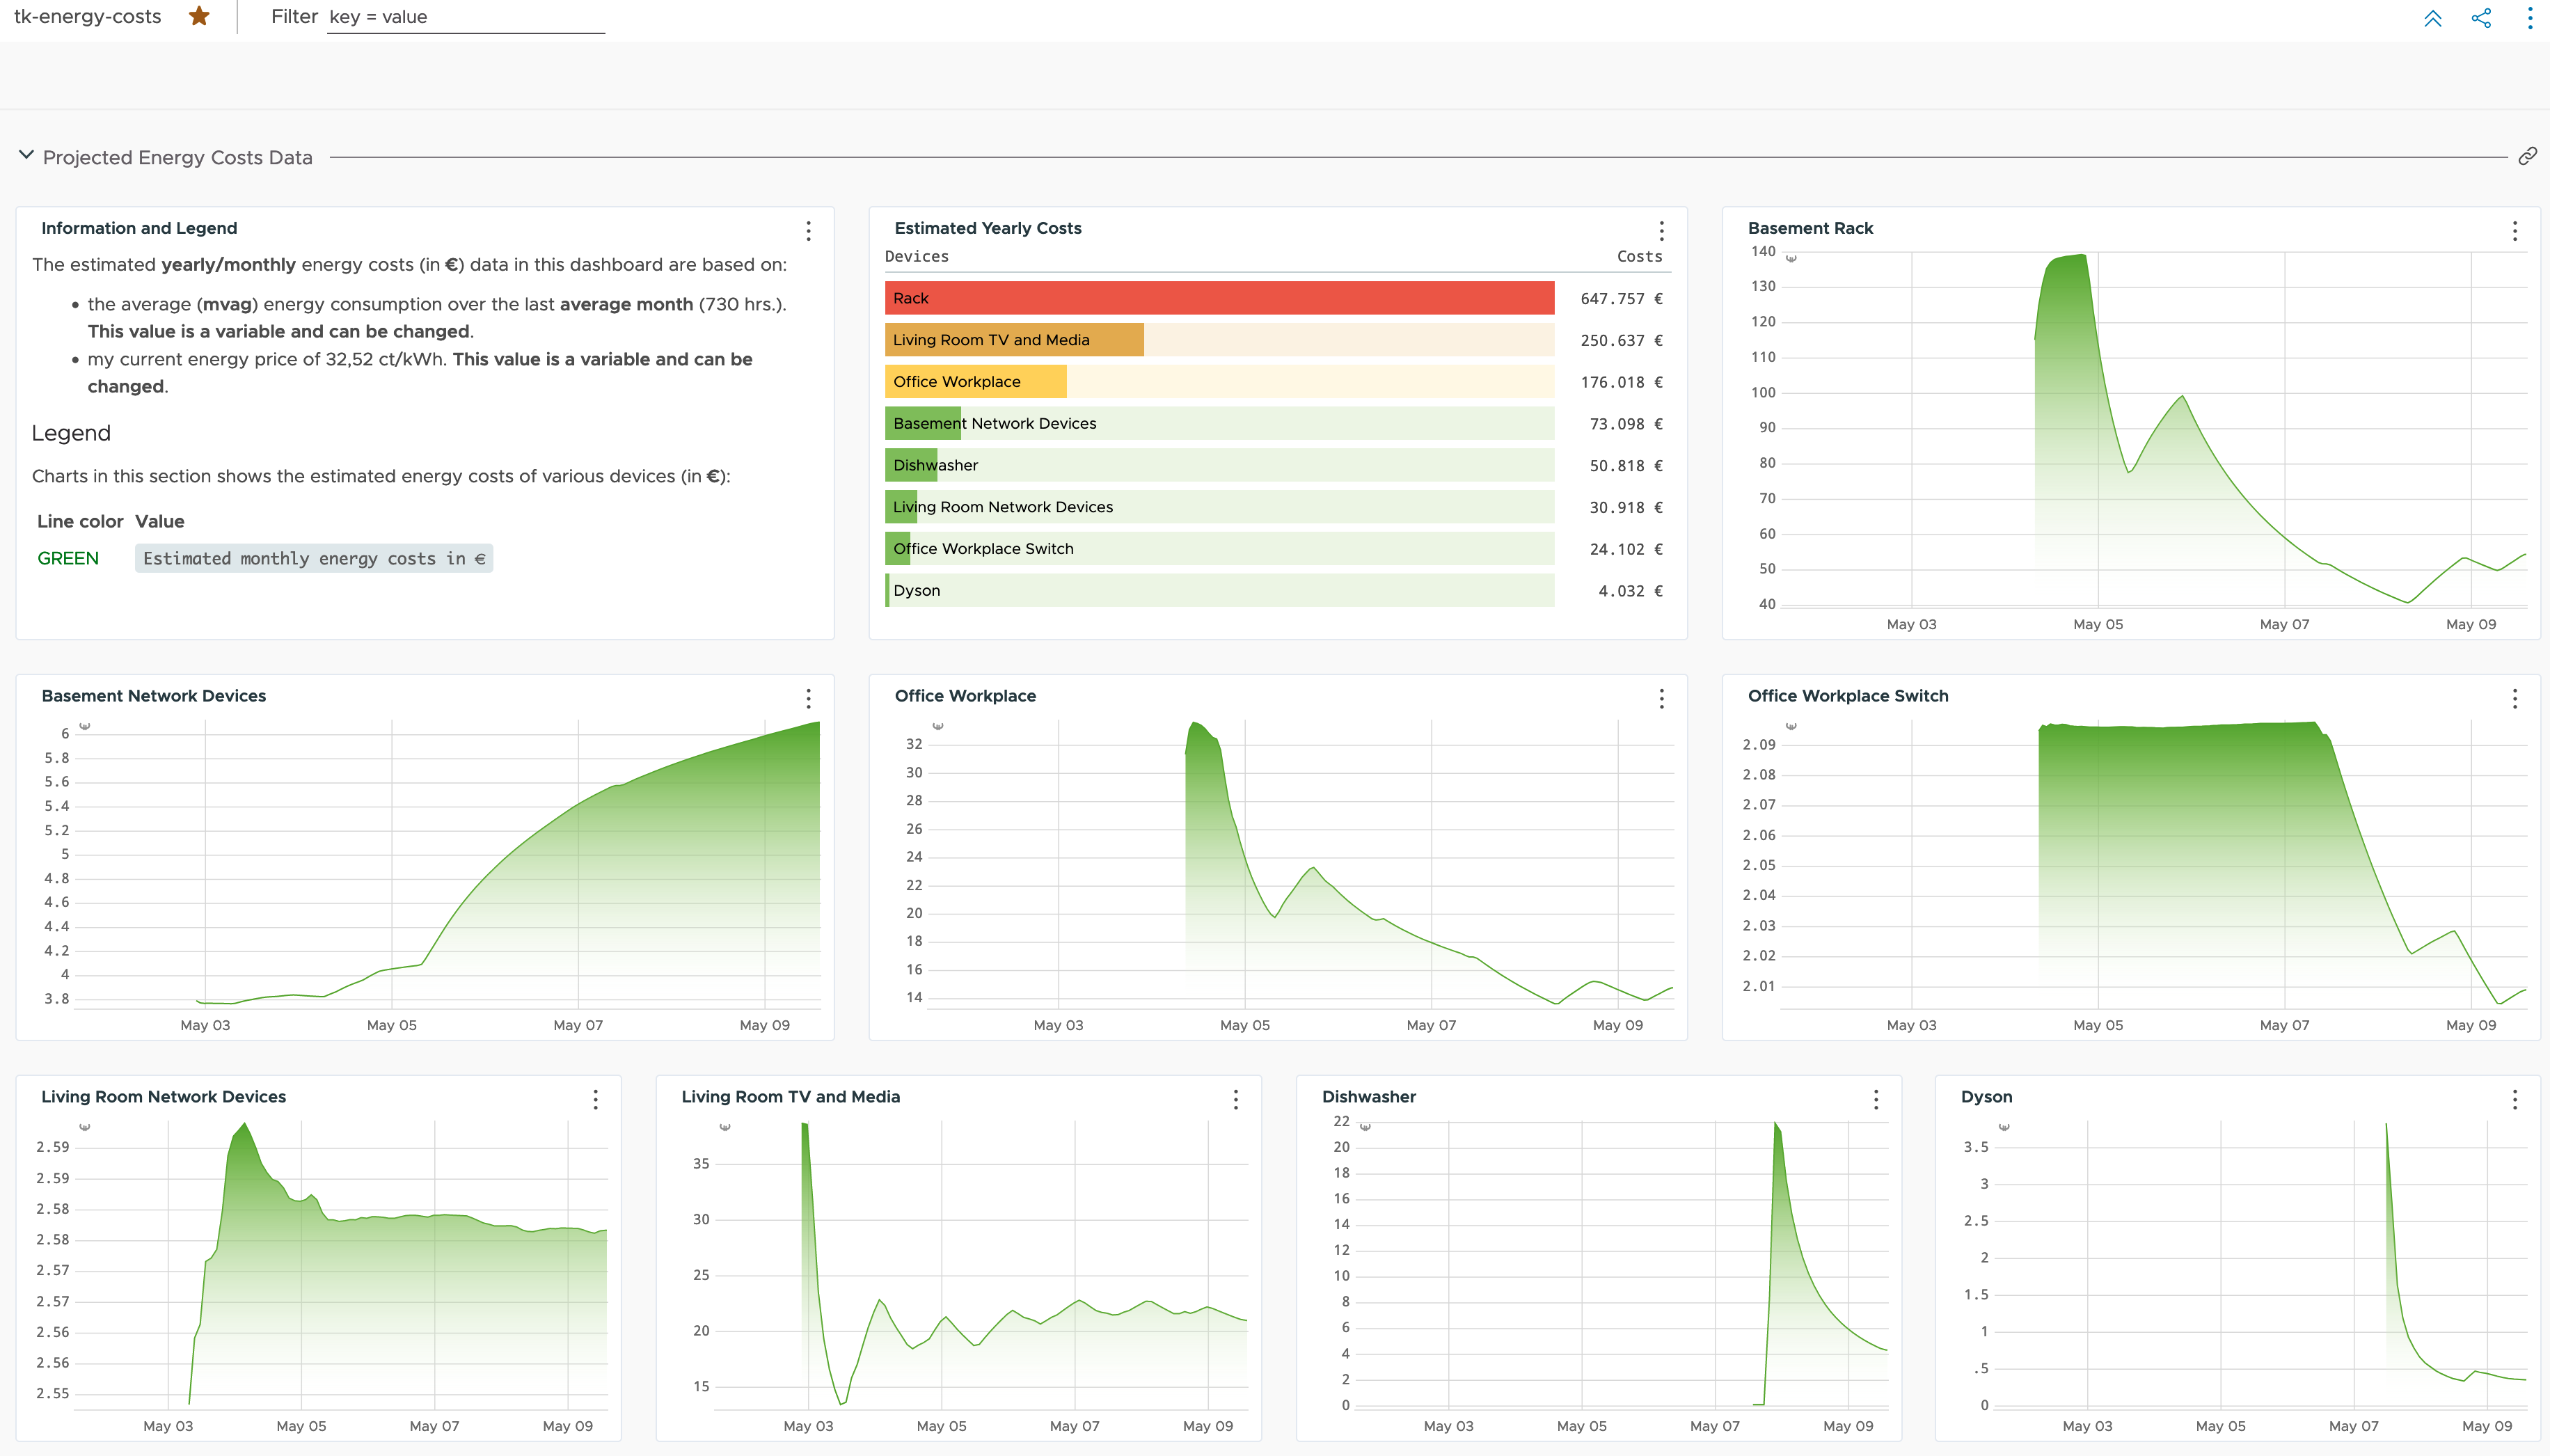
- I want to know the projected energy costs of my devices over month, year etc.
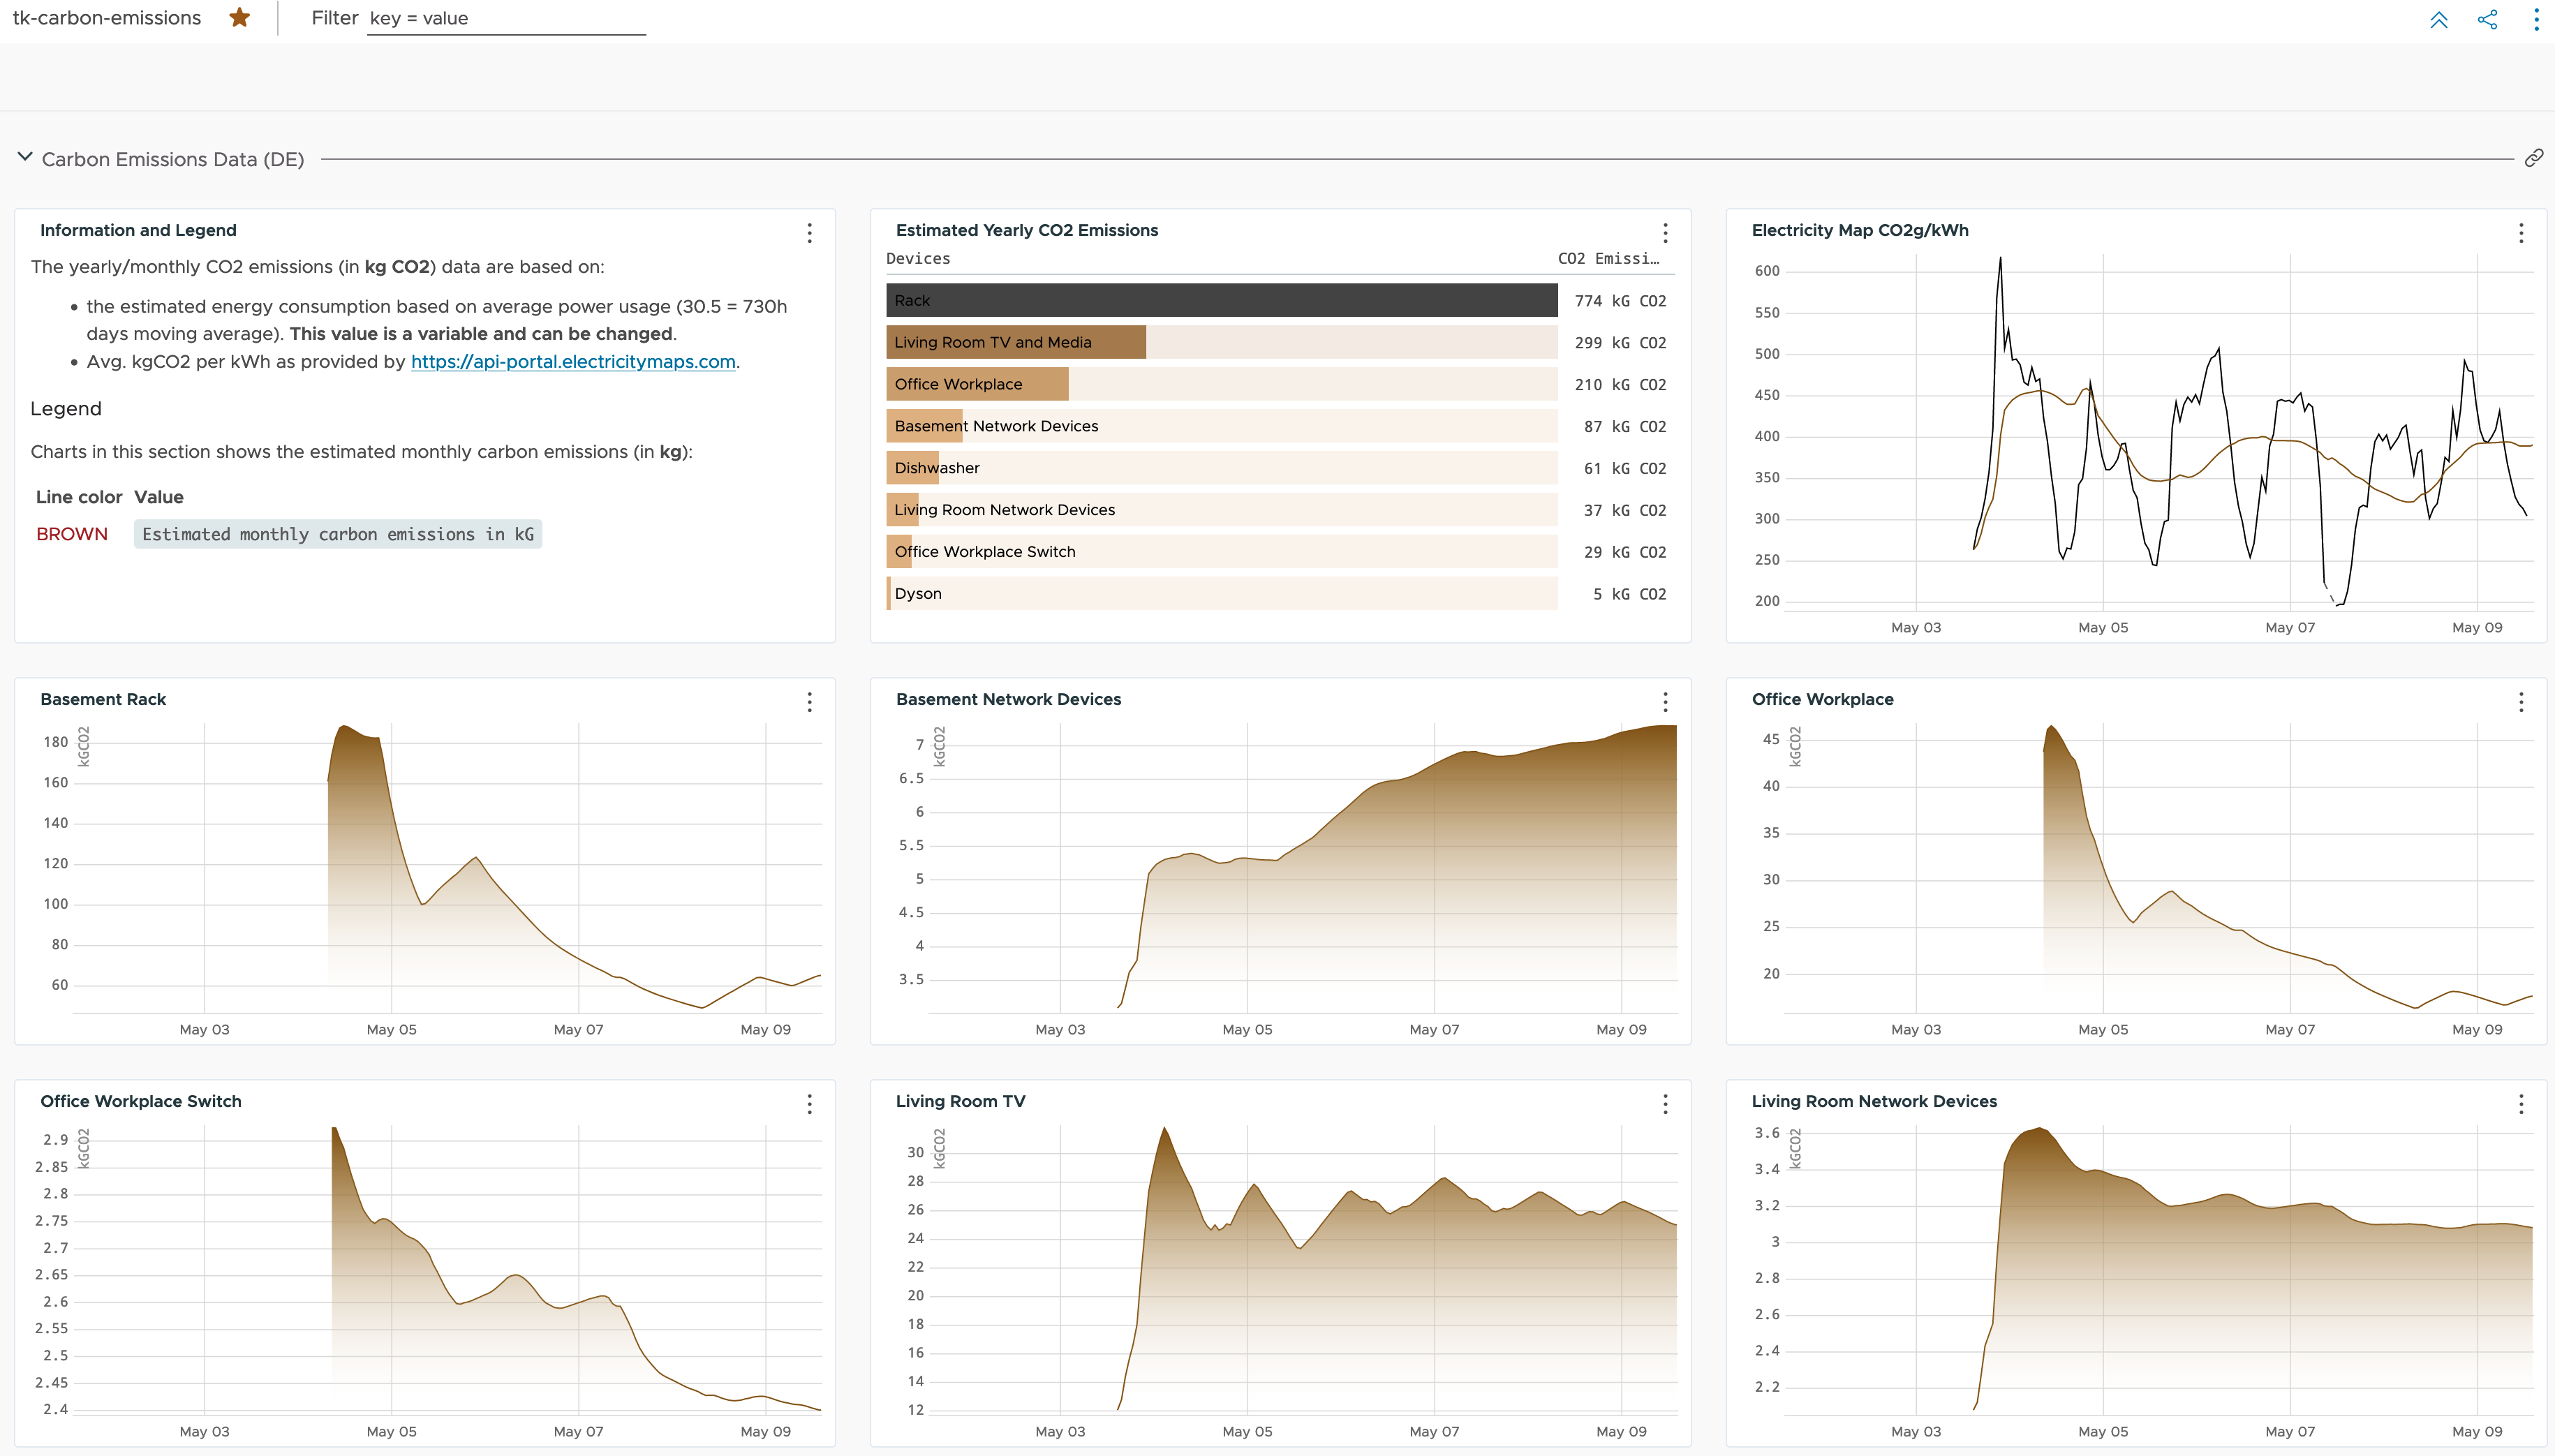
- I want to know the projected carbon emissions indirectly induced by my devices over month, year etc.
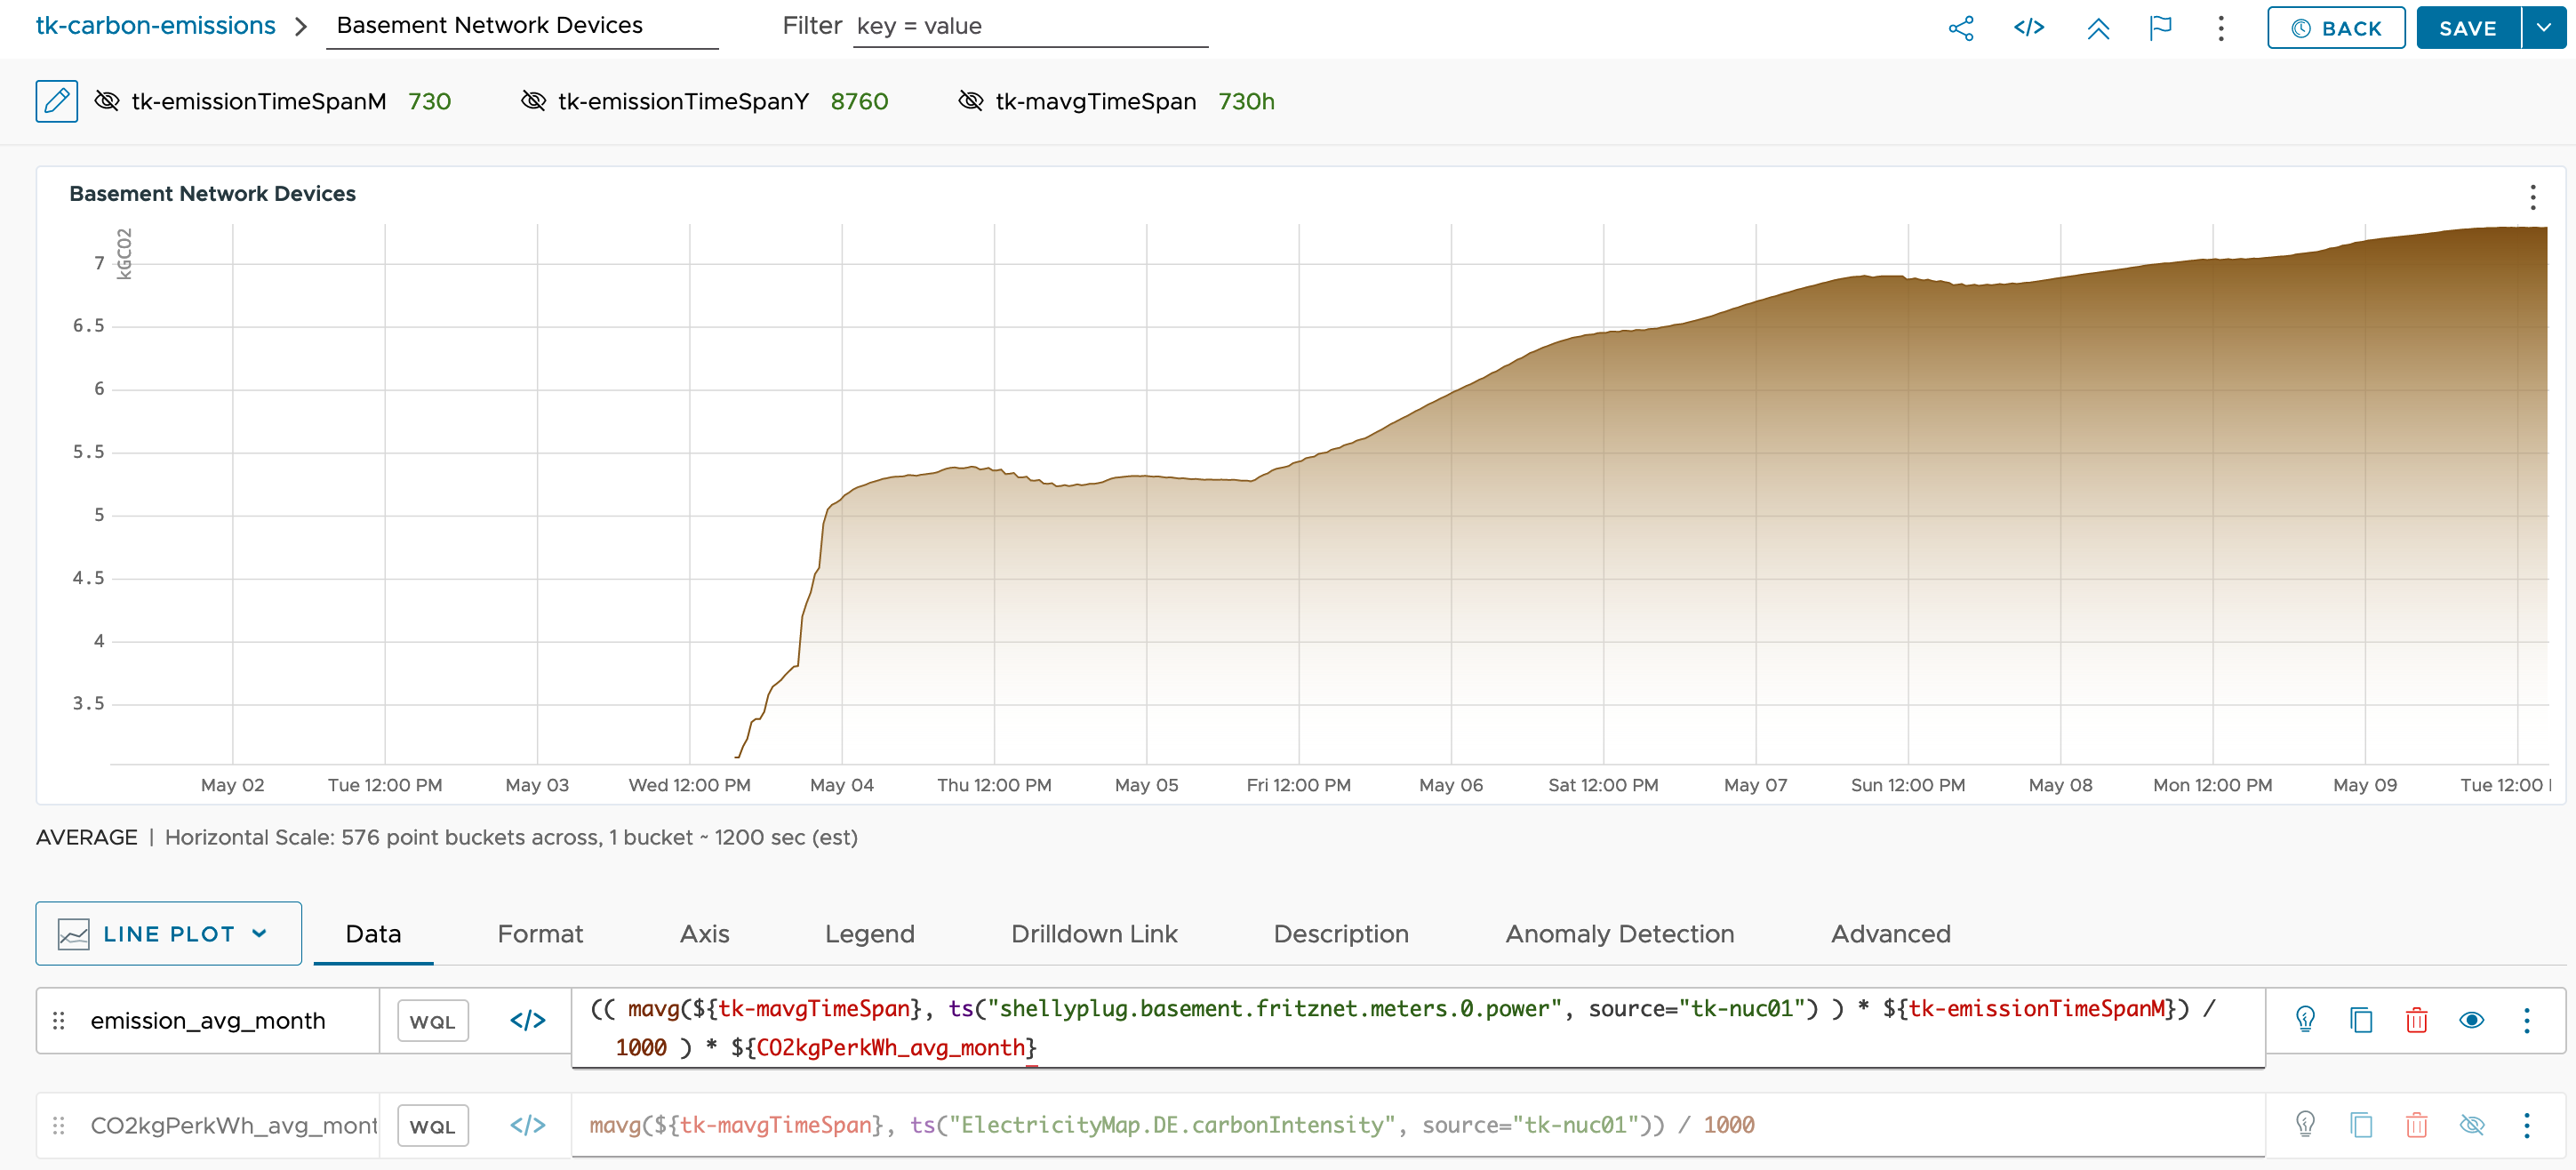
The next two pictures show the configuration of two widgets as an example.
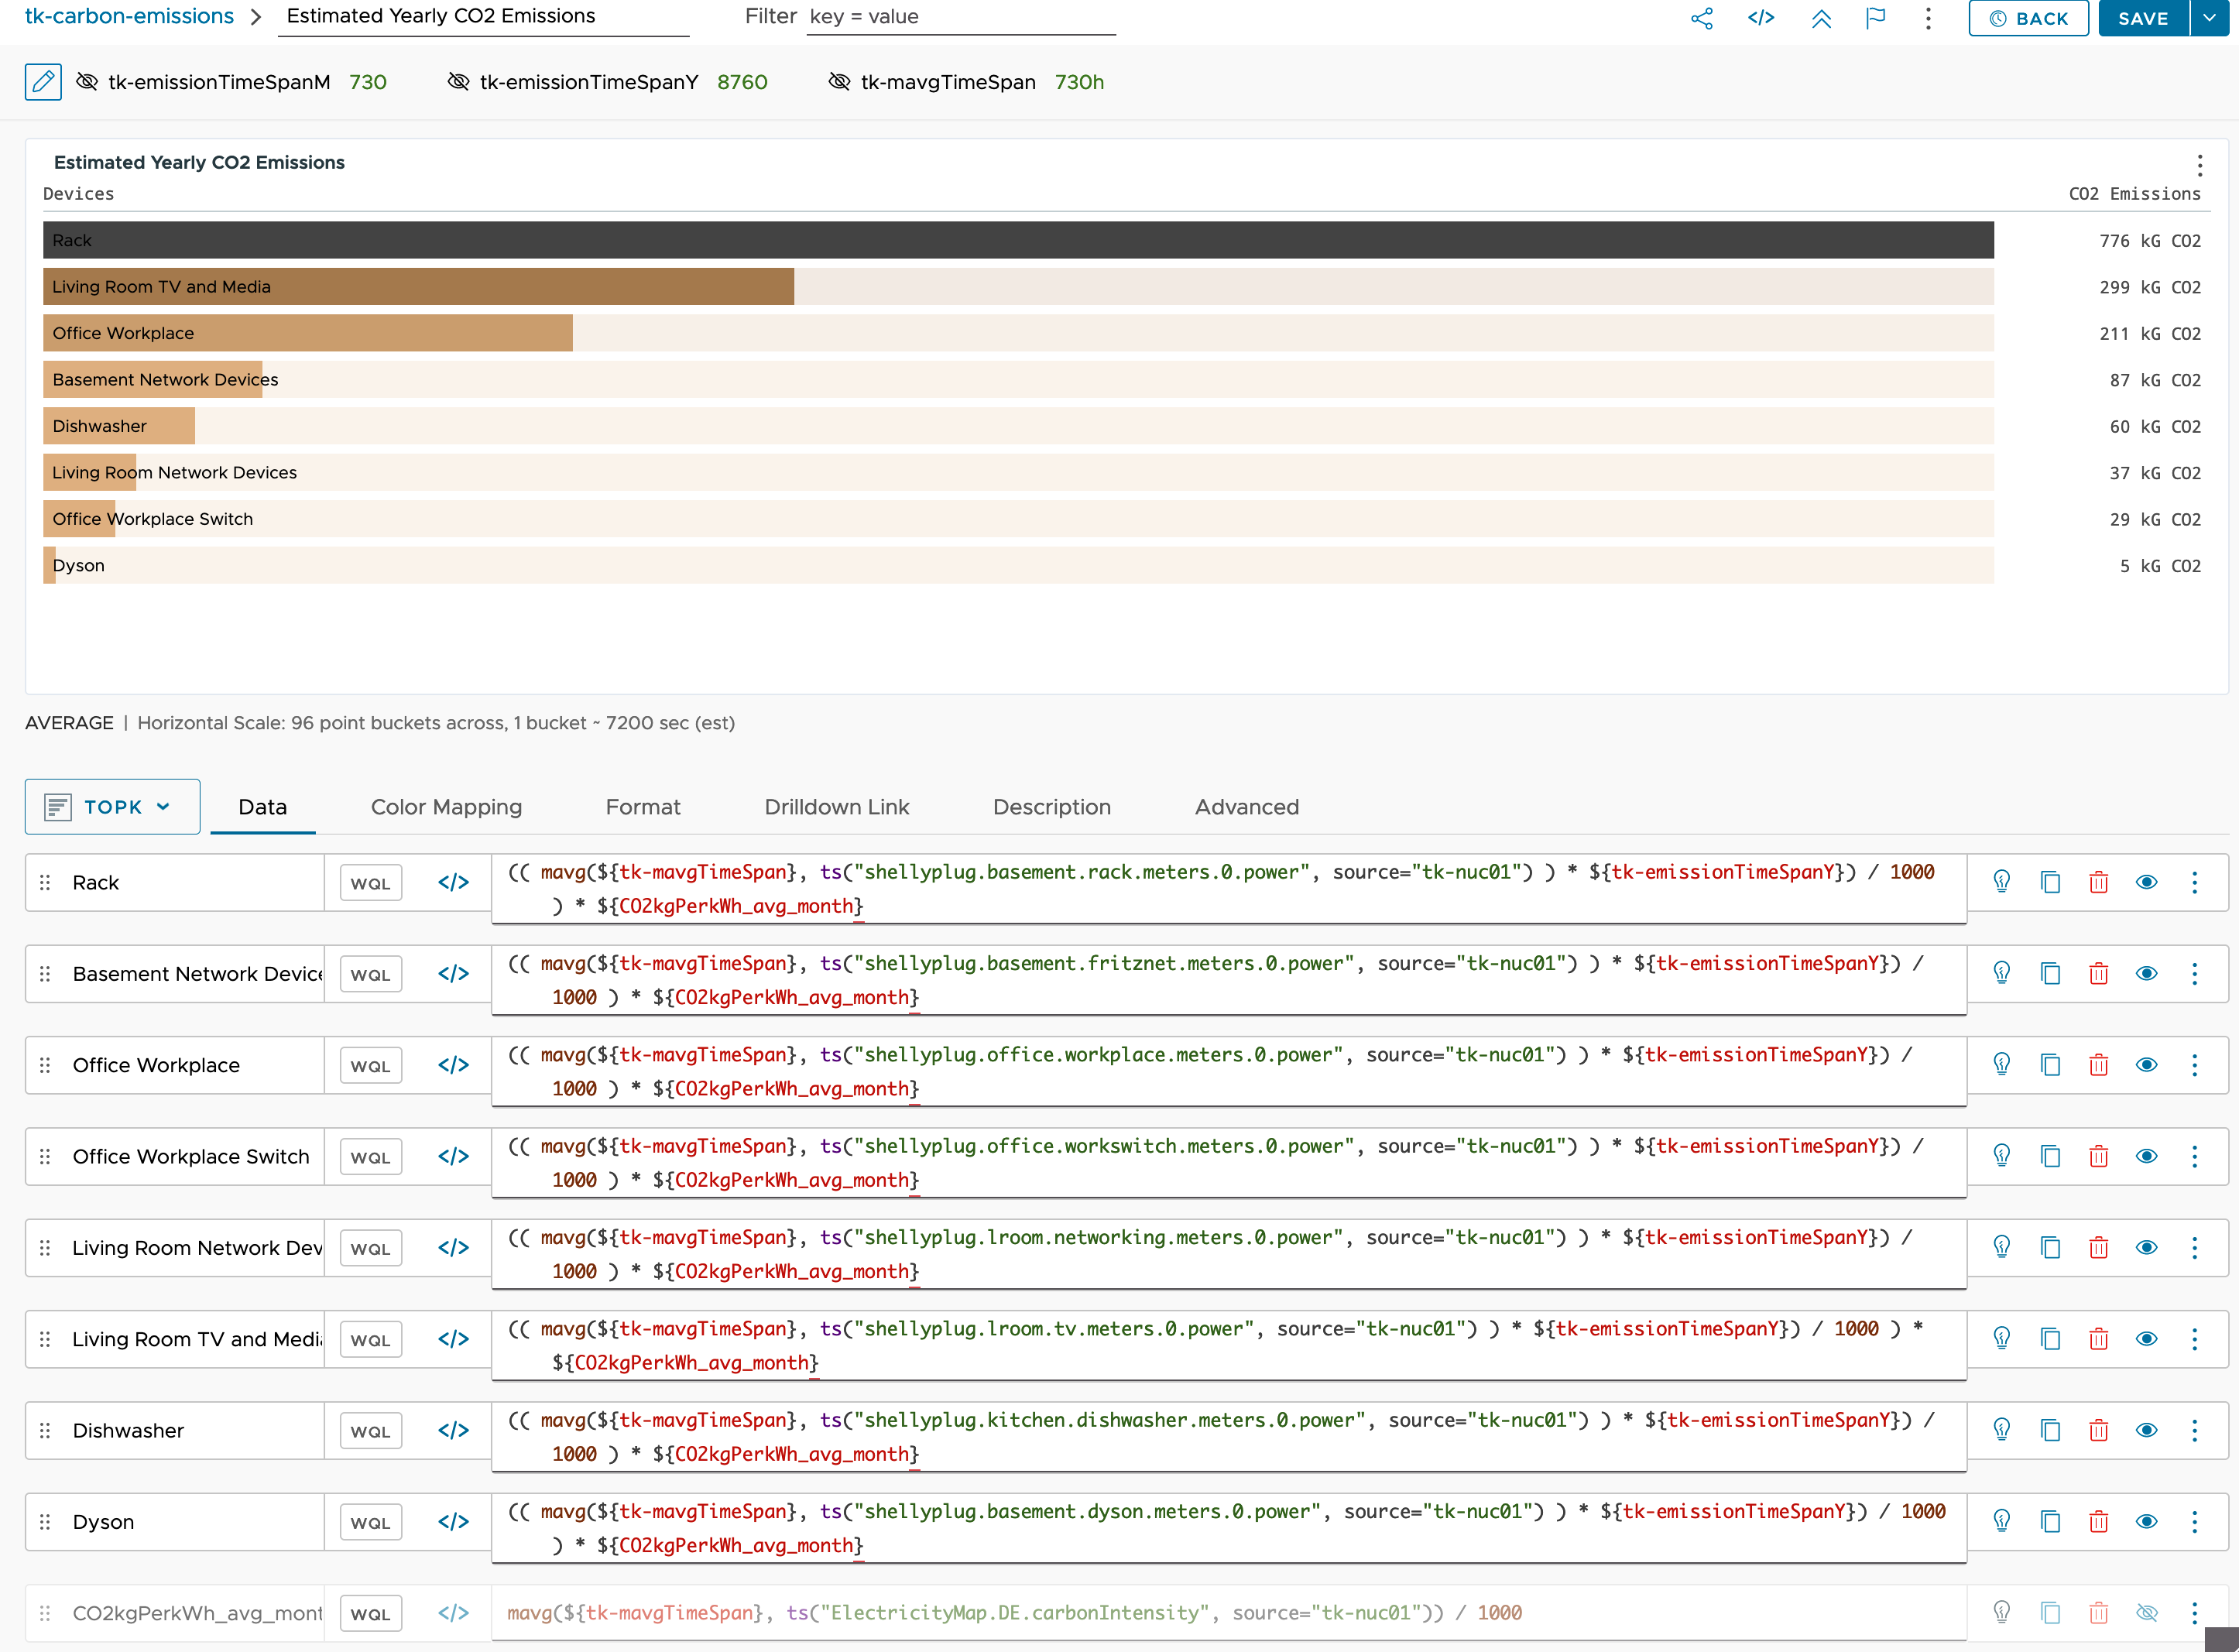
The following pictures show the dashboards I have created in Aria Operations for Applications to vizualize the energy related data.
In the following blog post I will describe how I implemented the same use cases in VMware Aria Operations focusing on the vSphere virtual infrastructure.
Stay safe.
Thomas – https://twitter.com/ThomasKopton