Recently I was asked how to quickly estimate the vRealize Log Insight (vRLI) data usage per day and I have checked several, more or less obvious, approaches.
Usually, this question comes up when a customer is either re-designing the vRLI cluster or migrating to the vRealize Log Insight Cloud instance. To answer that question we first need to specify what “data usage” means.
Data usage on disk is certainly the most important metric when you need to size your instance. The first idea was to use the vRLI System Monitor and evaluate the IOPS statistics – Bytes Written metric. In the example shown in the next picture, we have a value of around 13MB/s on average which would mean almost 1TB per day of written data! In my environment that cannot be correct. Firstly it is an average, secondly, it’s IOPS, which means not every byte written means data being stored, update and delete ops are also written data.
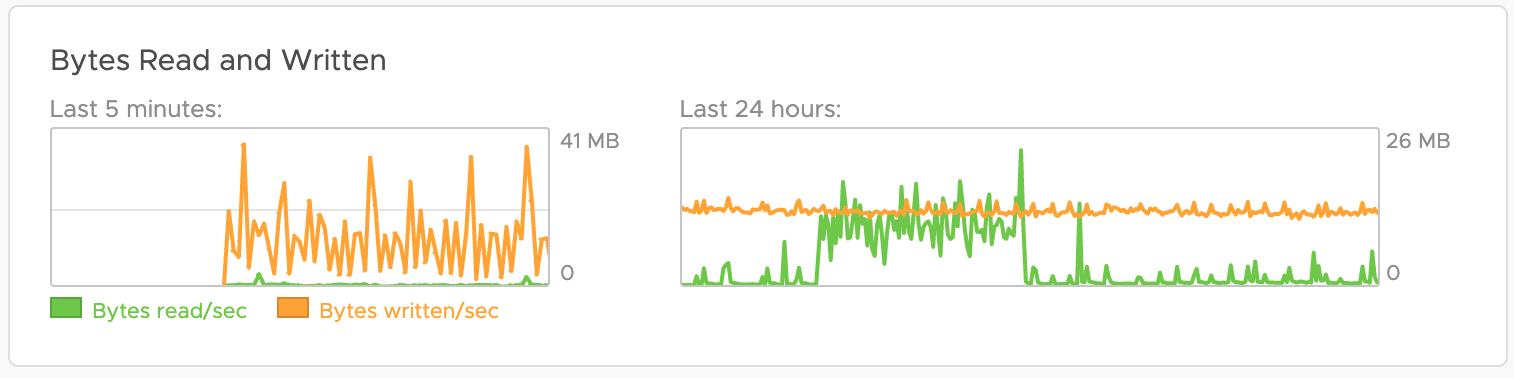
The number is still very valuable as you usually need the IOPS information to size your storage backend, but it does not help with the data usage on disk.
Next idea was to leverage vRrealize Operations (vROps) to estimate the daily usage or daily incoming data. In vROps you simply go to the vRLI node(s) and check the Guest File System usage. Unfortunately, that does not work if the disk is already at 97% of the usage as at this point vRLI will start deleting old buckets and you will see frequent drops and not a continuously increasing metric value. That approach also may not work if you have created various index partitions with different retention periods and vRLI is frequently removing data. In the next figure, you see the file system usage in case the file system is already breaching the 97% threshold.
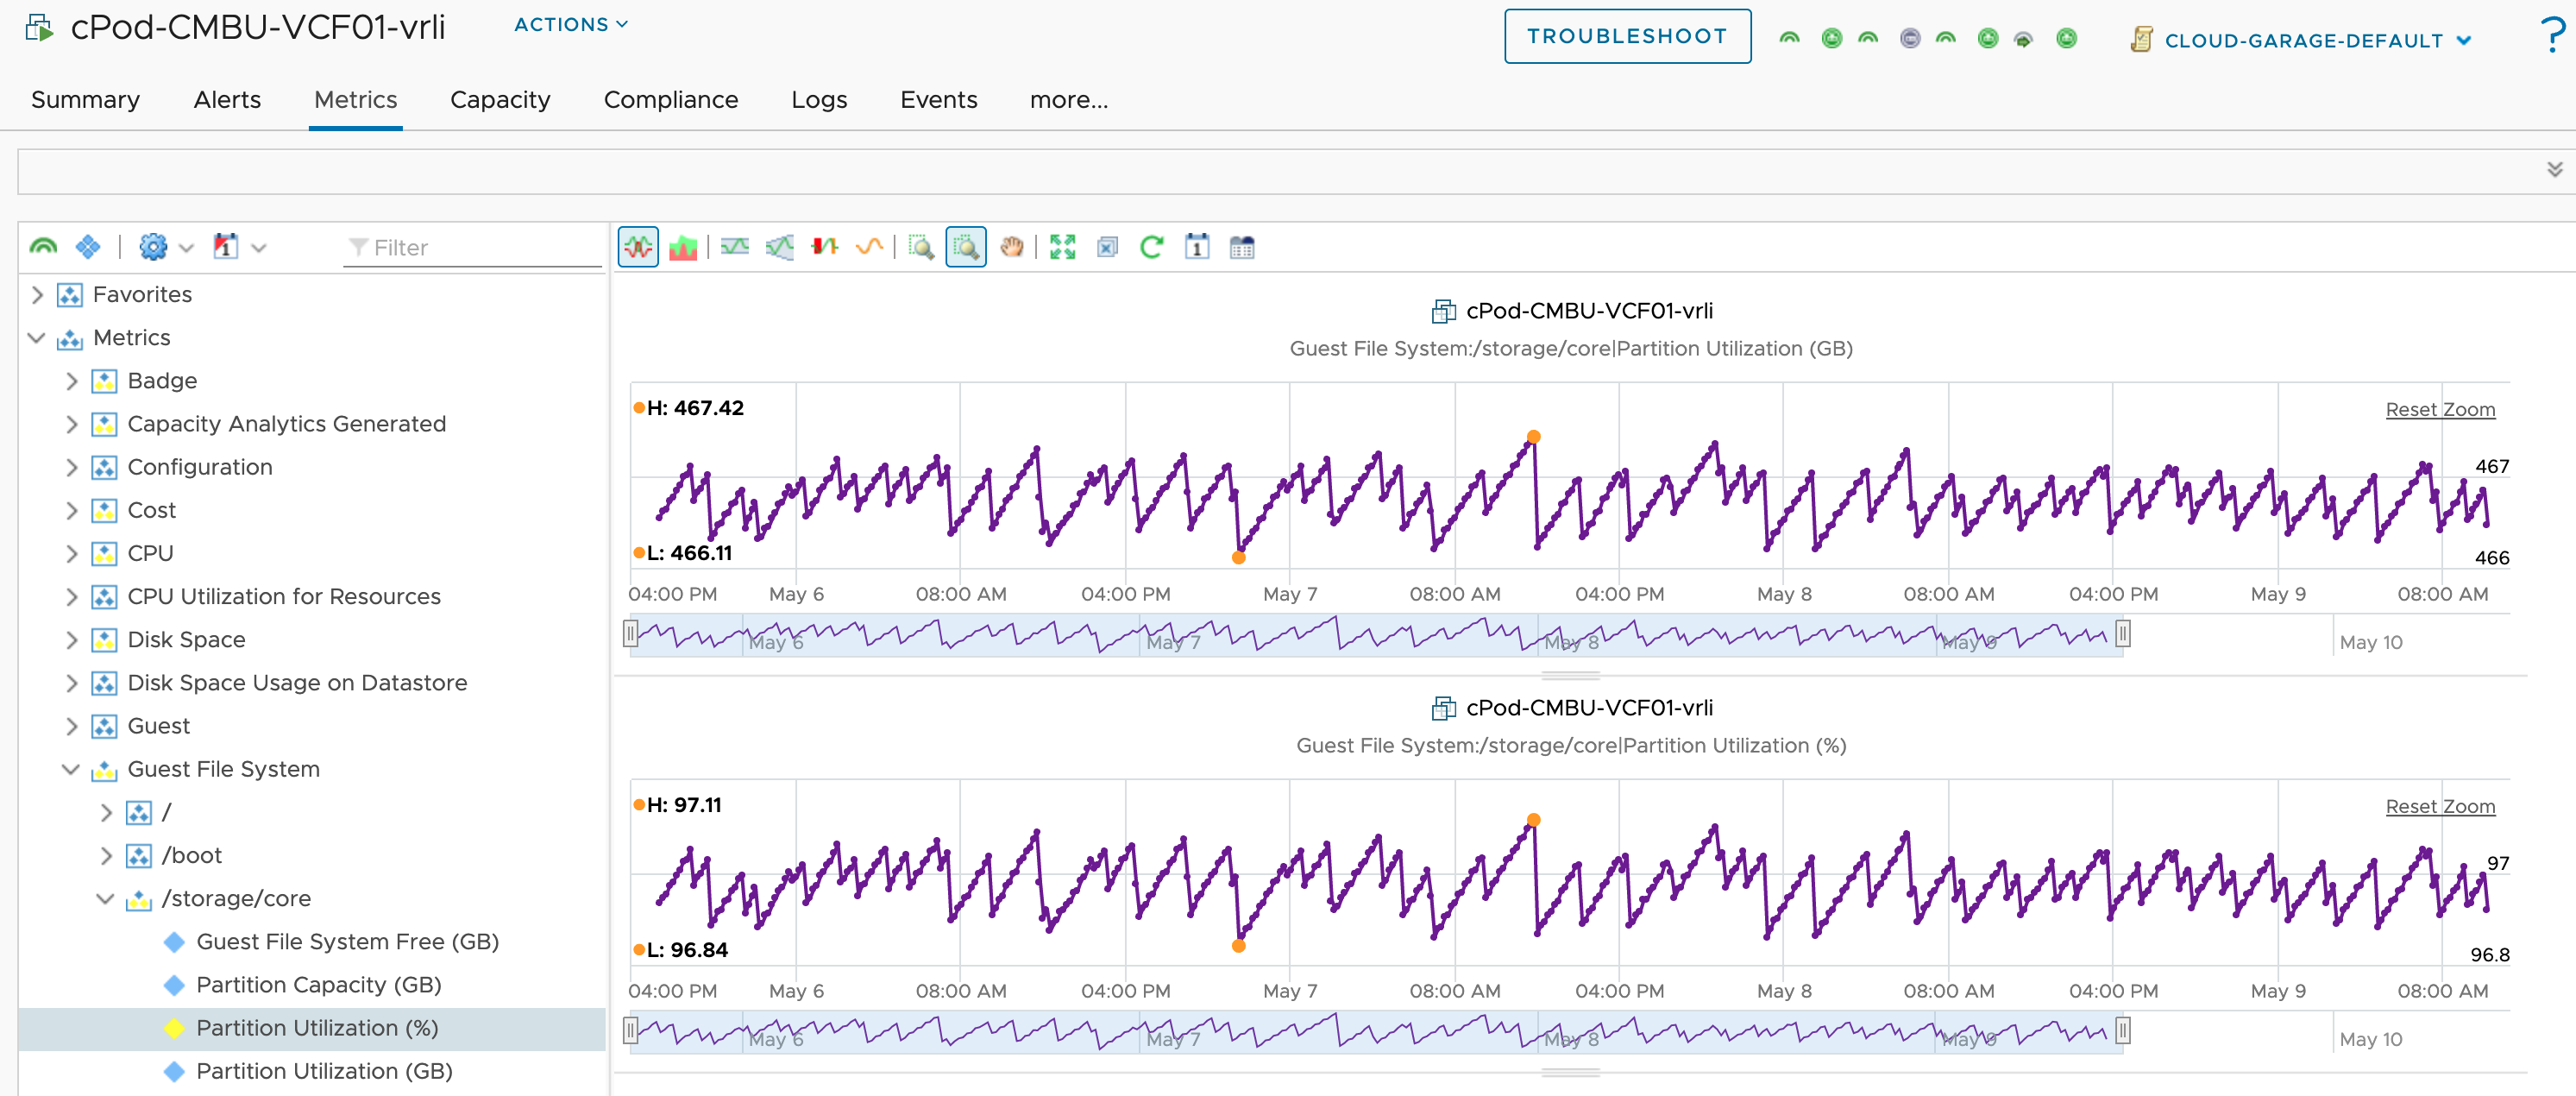
As long as the file system is way below 97% and there is only one index partition configured, this vROps number, or more specifically the difference between the value at day_n and day_n-1, will give you a pretty good estimation.
All that means is we need something more accurate.
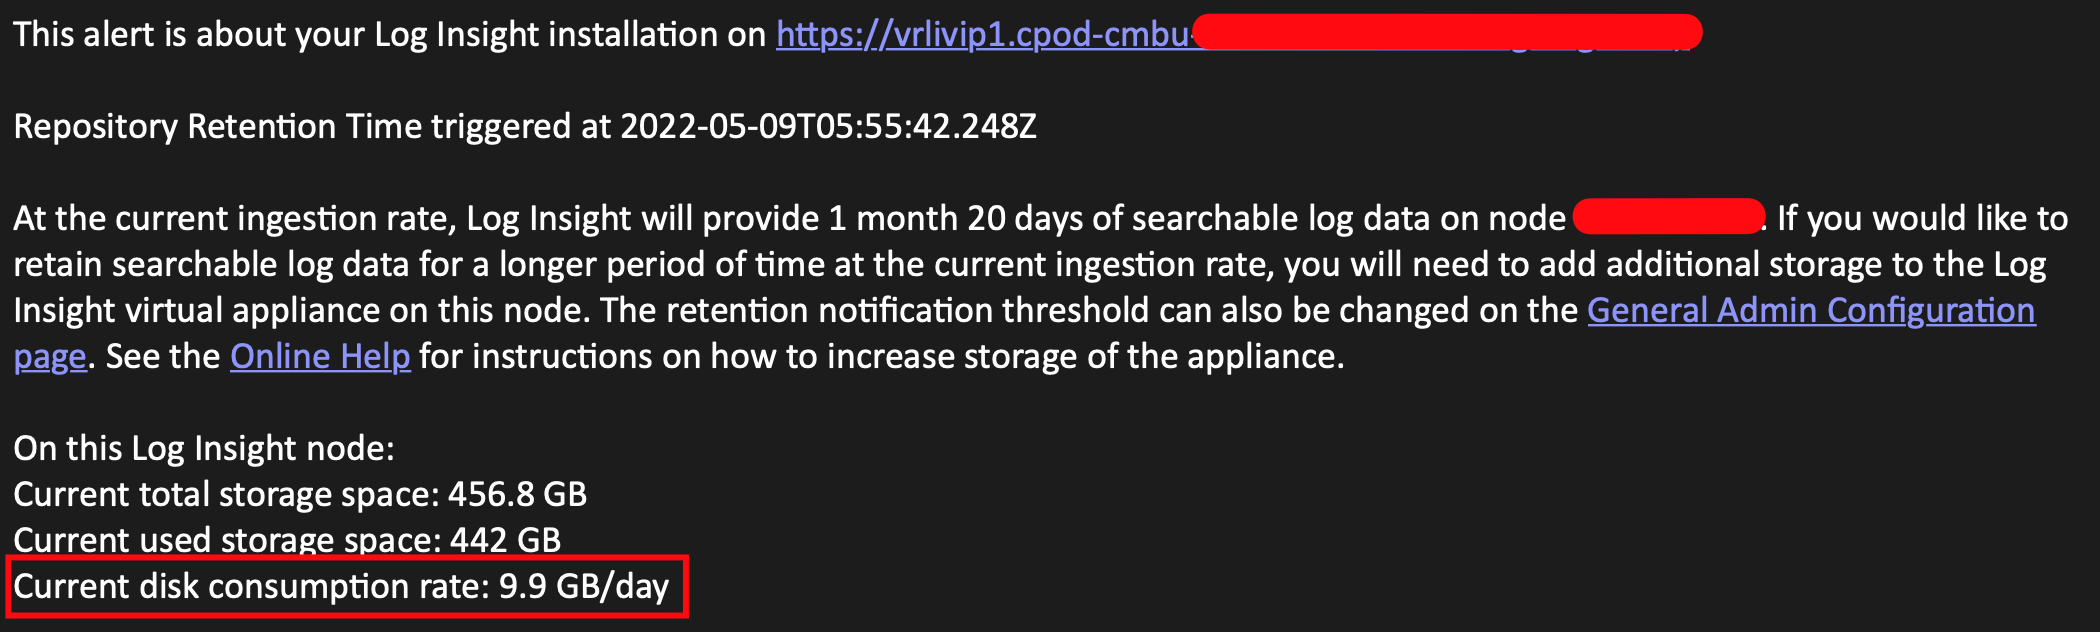
And here it comes. Working on System Alerts I have coincidentally discovered that the Repository Retention Time system alert will give you exactly the number you need. To trigger that alert you simply configure the threshold to a number that will be breached and you will get your information.

After the next evaluation (once every 24hrs) you will receive an email with the needed numbers. In the next figure, you see, that my vRLI instance consumes around 10GB per day. I have received that message for the next 2 days and the number remains stable at around 9.8 – 9.9 GB/day.
I hope that helps you size your vRLI when for example migrating to vRealize Log Insight Cloud.
Stay safe.
Thomas – https://twitter.com/ThomasKopton
1 Comment