As many of you are probably aware, vROps provides an easy and comprehensive way to monitor and manage a vRealize Automation (vRA) environment through utilizing the Native Management Pack (NMP) for vRealize Automation.
The MP gives you a variety of pre-configured dashboards, view, alerts etc. which all work perfectly fine and give you a sufficient view of the environment if your vRA is dealing with only one tenant.
Of course are vROps and the Management Pack capable of collecting and displaying information for multiple tenants, the problem is, that some content aggregates numbers across all tenants. You can see this in the following screenshot:
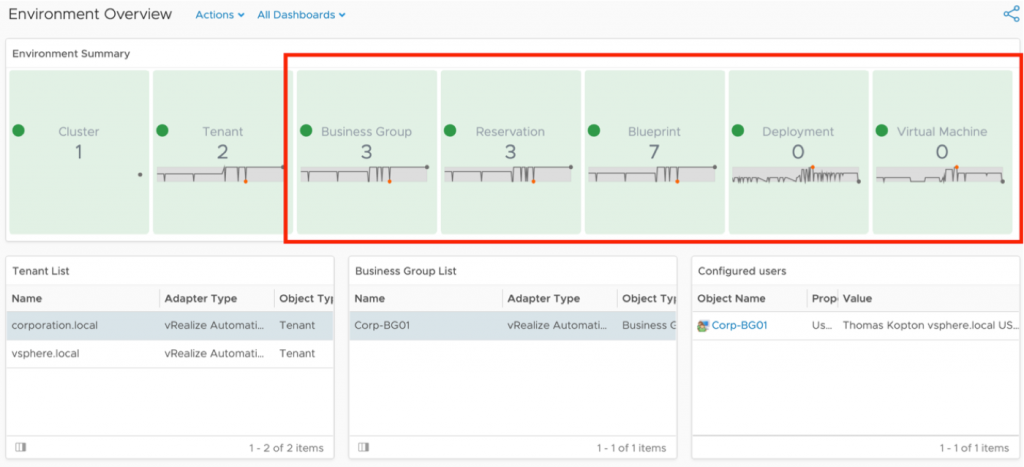
But what if you have multiple tenants and you would like to see e.g. environment numbers for each and every tenant separately? How many deployments have been done by tenant X and how many Linux VMs have been deployed by tenant Y?
In this blog I will show you the basic techniques you can utilize to create your own content focusing on a per tenant view.
At the end of this blog post you will find a link to VMware Code where you can download sample content.
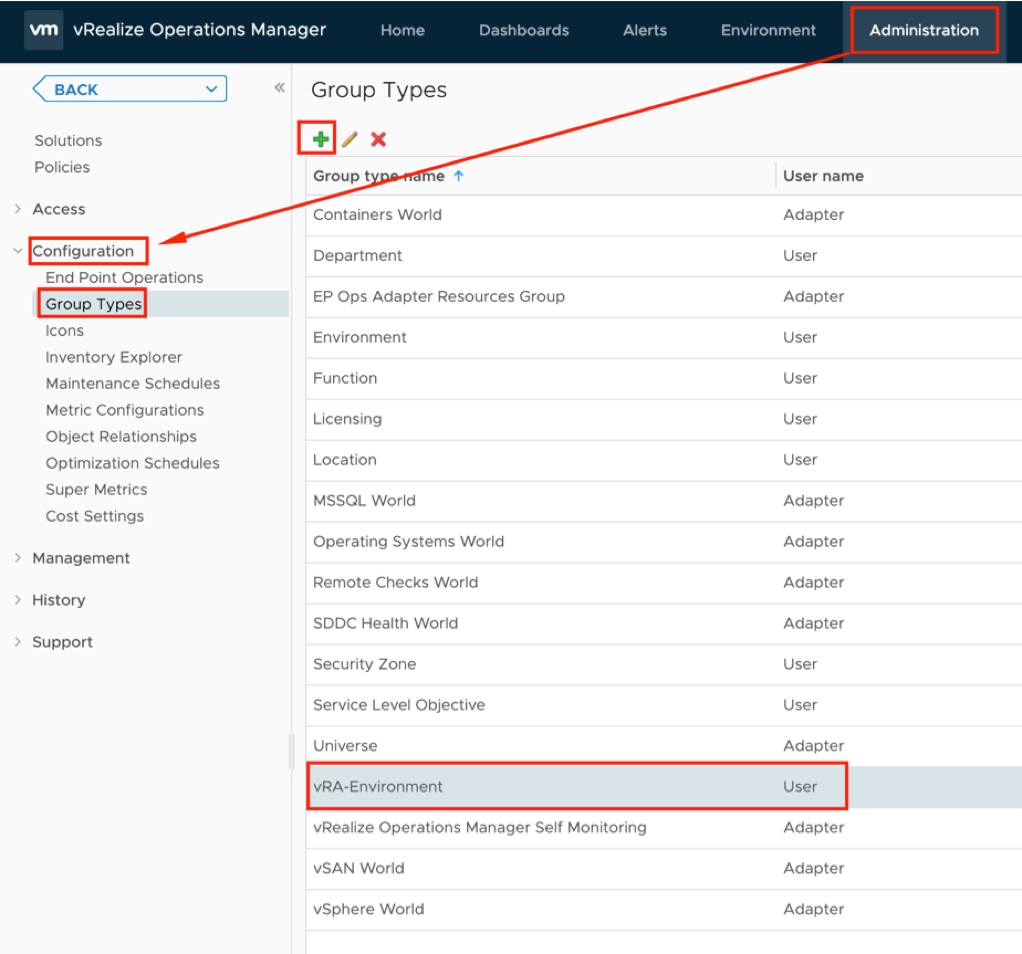
The foundation of the solution described in this post are Custom Groups.To have all the needed groups in one place, I have created a distinct Group Type:
Since I cannot describe all possible requirements this are my assumptions:
- vRA configured with two tenants (vsphere.local, corporation.local in my environment)
- requirement for having a Dashboard displaying how many Linux and Windows VMs have been deployed per tenant
- requirement for having a Dashboard displaying number of Blueprints per tenant
- requirement for having a Dashboard displaying number of Deployments per tenant
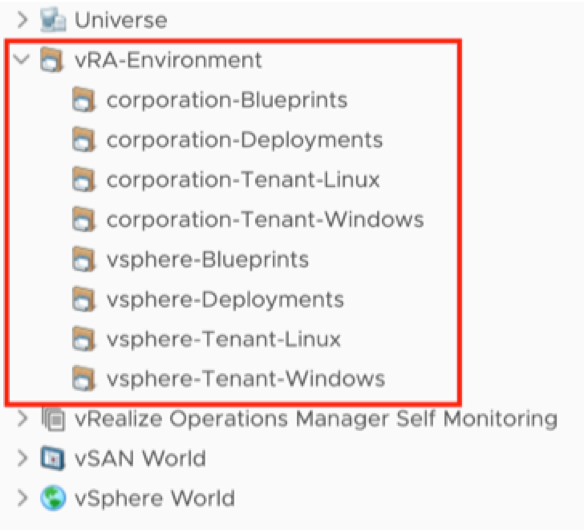
Based on these requirements we need following Custom Groups in our vROps:
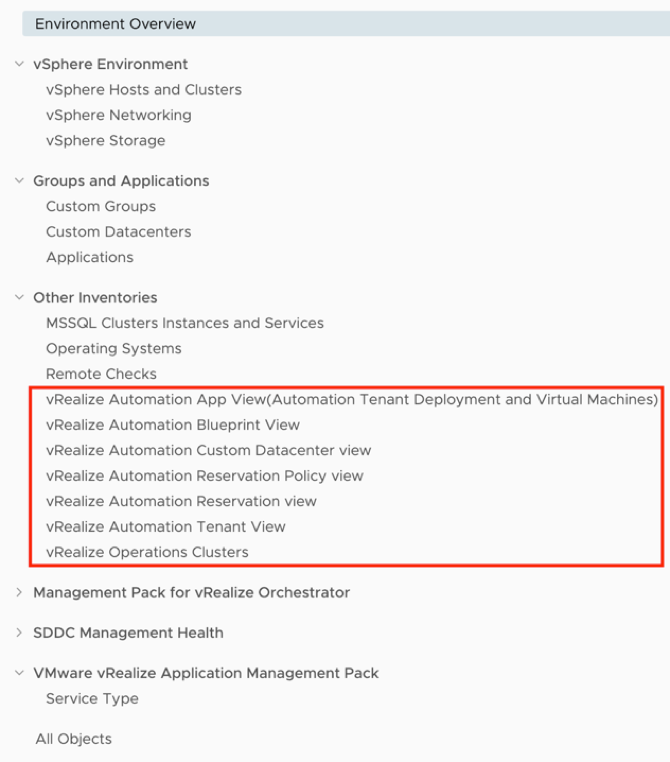
How to populate those groups dynamically with the corresponding objects?
Actually, this is pretty easy as the Management Pack provides the required Navigation Trees:
Let’s see how to create the Custom Groups.
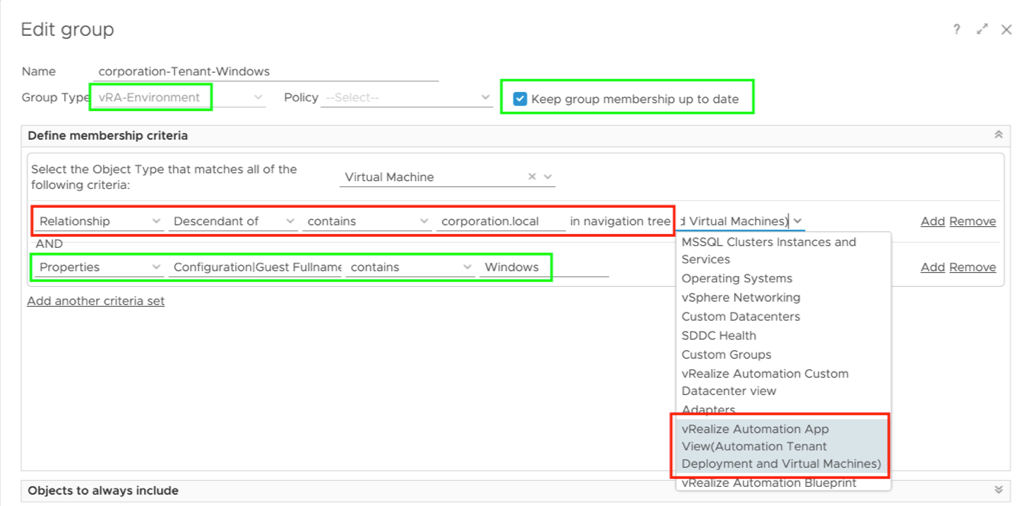
As an example you see here the Custom Group for Windows VMs deployed by the corporation-Tenant. The most important part is bordered in red, it is the relationship of an given object in a navigation tree.
The “contains” statement has to reflect the actual name of the tenant.
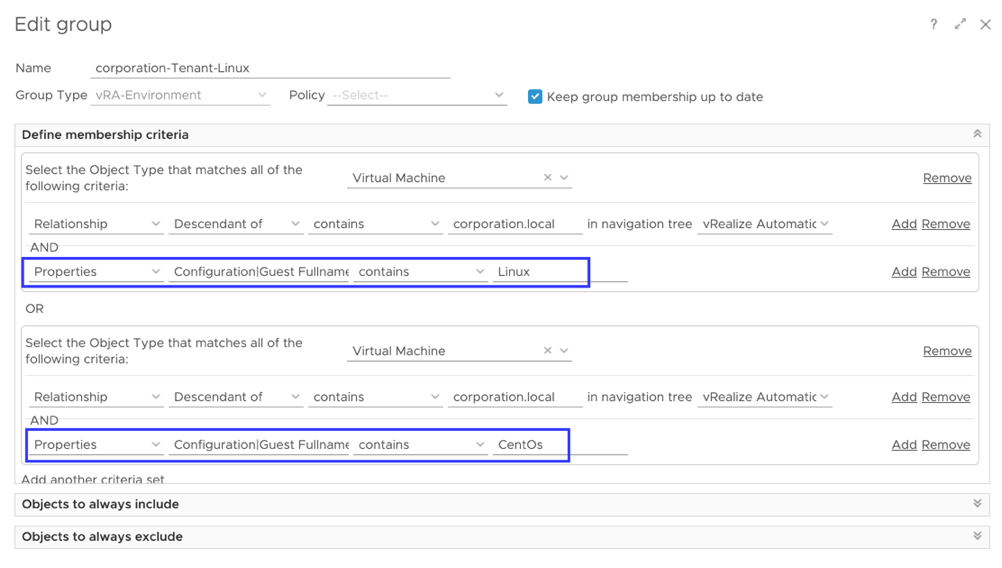
Obviously, for the Linux group only the Properties part looks a bit different and needs to reflect the actual environment:
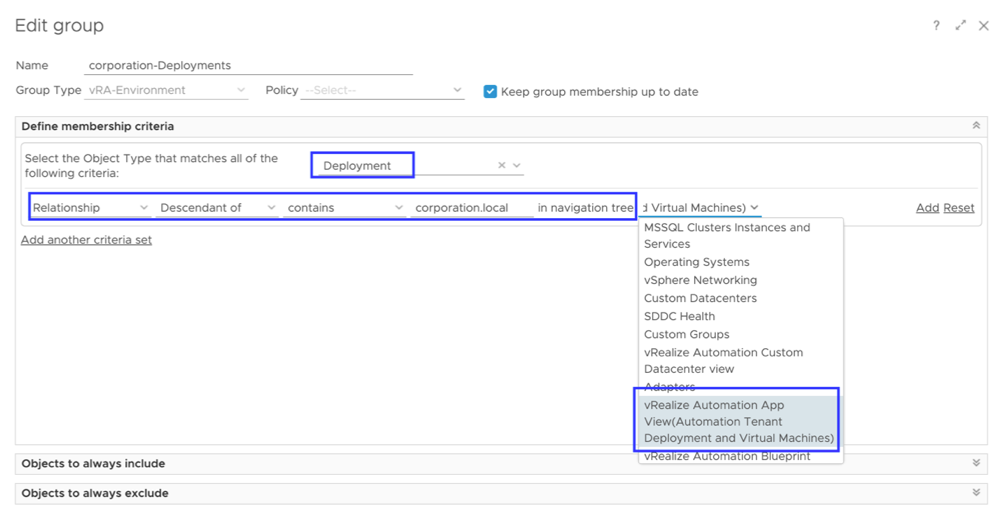
Now, let’s inspect the group configuration for Deployments and Blueprints:
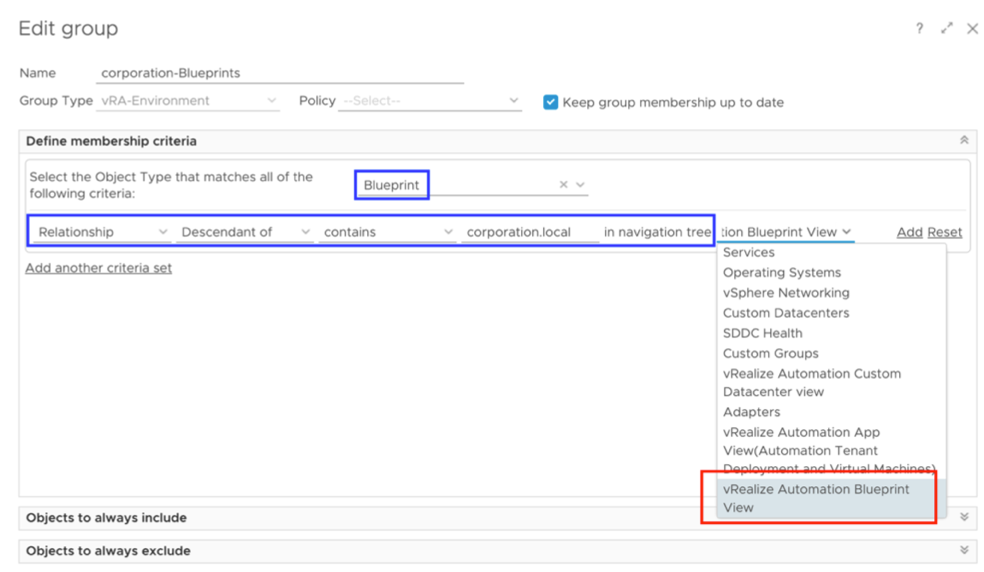
For the Blueprints Custom Group we need to use another Navigation Tree:
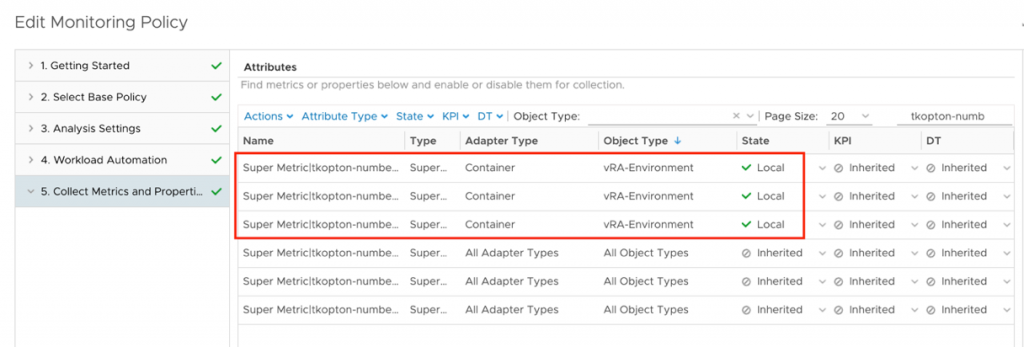
As there is no metric or property reflecting the count of objects belonging to a Custom Group, appropriate Super Metrics need to be created, associated with the corresponding Custom Group Type and enabled in their respective Policy:
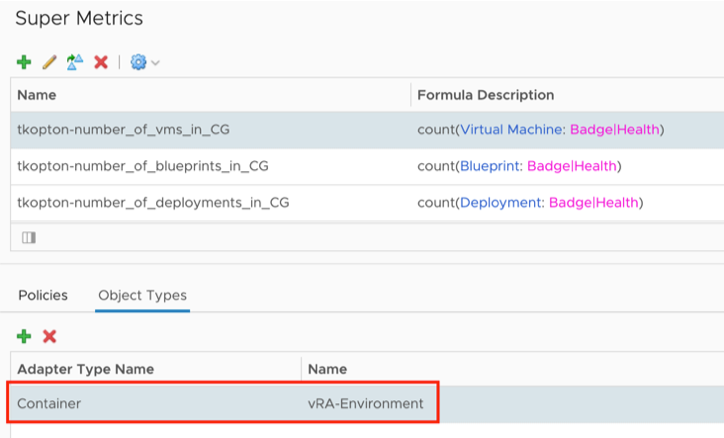
Super Metrics enabled in the policy:
Here an example of the actual formula for the first Super Metric:
count(${adaptertype=VMWARE, objecttype=VirtualMachine, attribute=badge|health, depth=1})After few collection cycles the new Super Metric will show up on our new Custom Groups and the values can be used in the content.
Now we have all ingredients to create our own custom dashboard displaying the various numbers separately for all our vRA Tenants.
This is how my sample dashboard looks like:
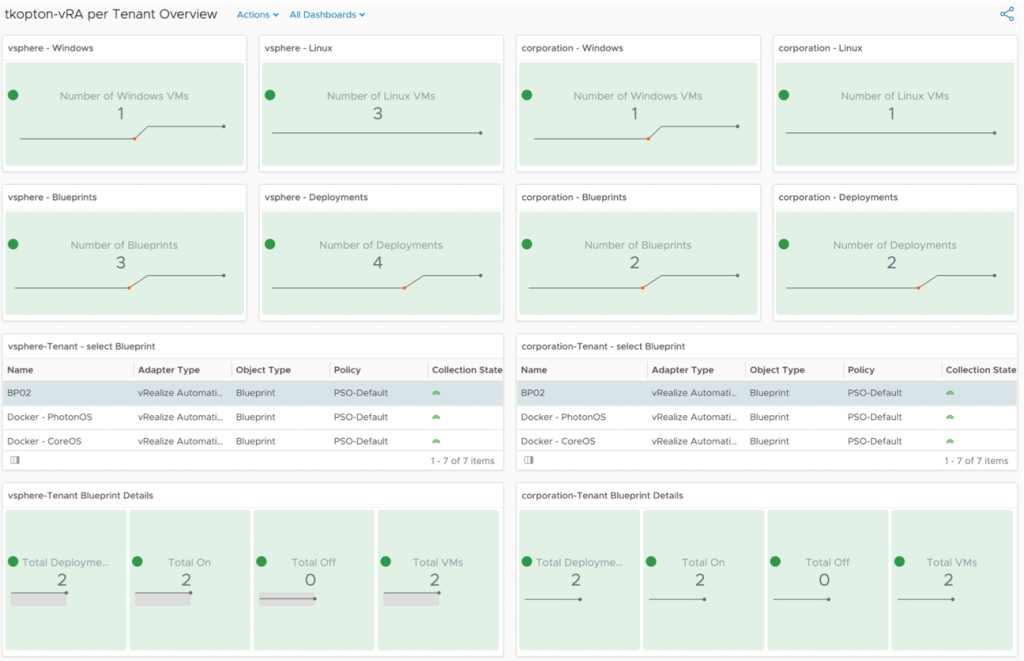
What is happening behind the scenes is fairly easy. The Scoreboards are configured as self-provider and are using previously created Custom Groups as source of the objects and the respective Super Metrics to show the correct numbers.
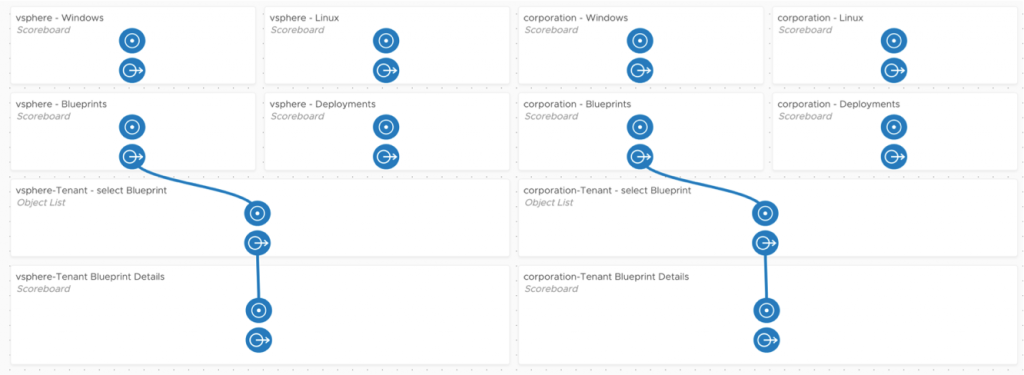
At the bottom of Dashboard some additional information regarding the selected Blueprint is displayed. To achieve this correct wiring of the sources and destinations is required:
A zip file containing all elements can be found here:
https://code.vmware.com/samples?id=5348
Thomas