In today’s global landscape, sustainability has become an imperative priority for organizations worldwide. Executives at every level are fully dedicated to reducing their carbon footprint across all aspects of their operations and seeking innovative ways to achieve their environmental objectives.
VMware plays a pivotal role in assisting customers in making significant advancements towards reducing energy costs and carbon emissions associated with their digital infrastructure. VMware solutions not only provide responsive scalability and simplified management but, most importantly, offer a pathway to achieve decarbonization.
With the introduction of VMware Aria Operations 8.6 (formerly known as vRealize Operations), groundbreaking sustainability dashboards found their way into the product. These dashboards are designed to highlight the carbon emissions saved through compute virtualization while also offering optimization strategies to reduce carbon footprints by identifying idle workloads.
In this post I describe how to create additional custom dashboards in VMware Aria Operations with focus on:
- current power usage
- energy consumption
- energy costs
- carbon emissions
Use Case
My use case is to get a quick overview of the mentioned energy related data at all levels of the virtual infrastructure, Datacenters, Clusters, Hosts, Virtual Machines. I would like to see that information for the current month – Month to Date (MTD) time frame – beginning of the month up to now.
Solution
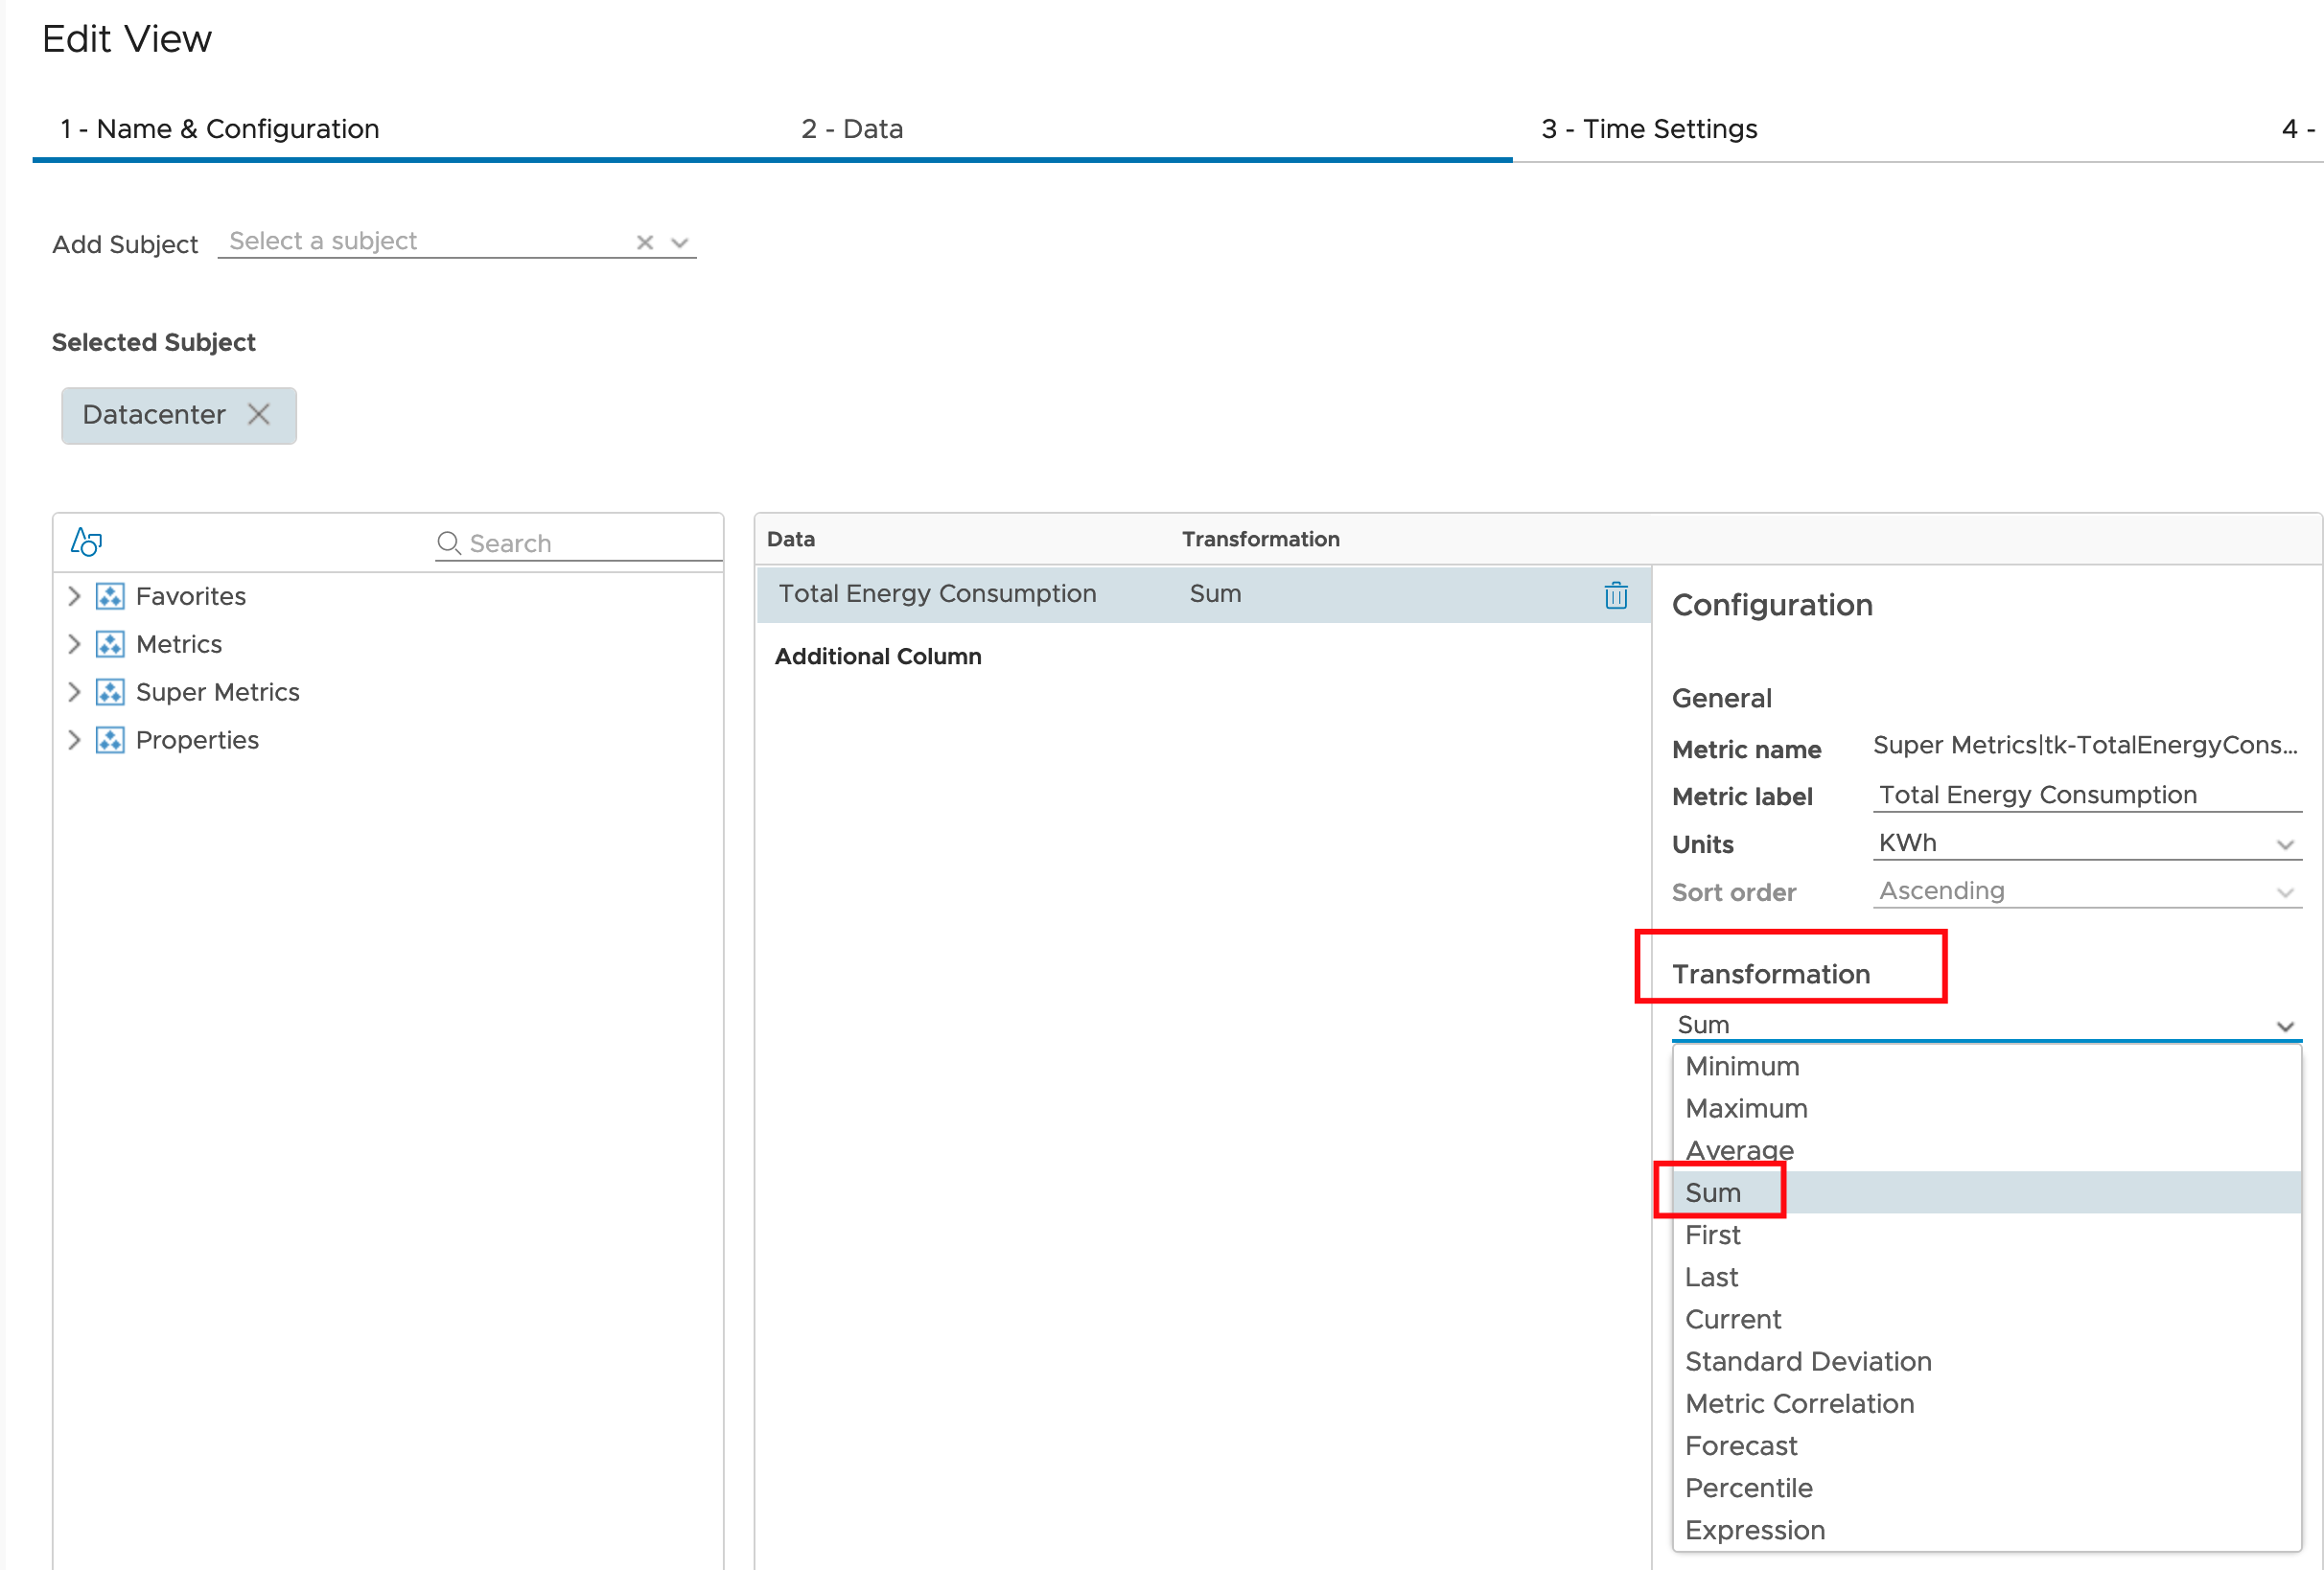
The fundamental parts of my dashboards are Aria Operations Views as they provide an easy way to transform the collected data – in my case I need the sum() transformation to summarize values over a period of time.
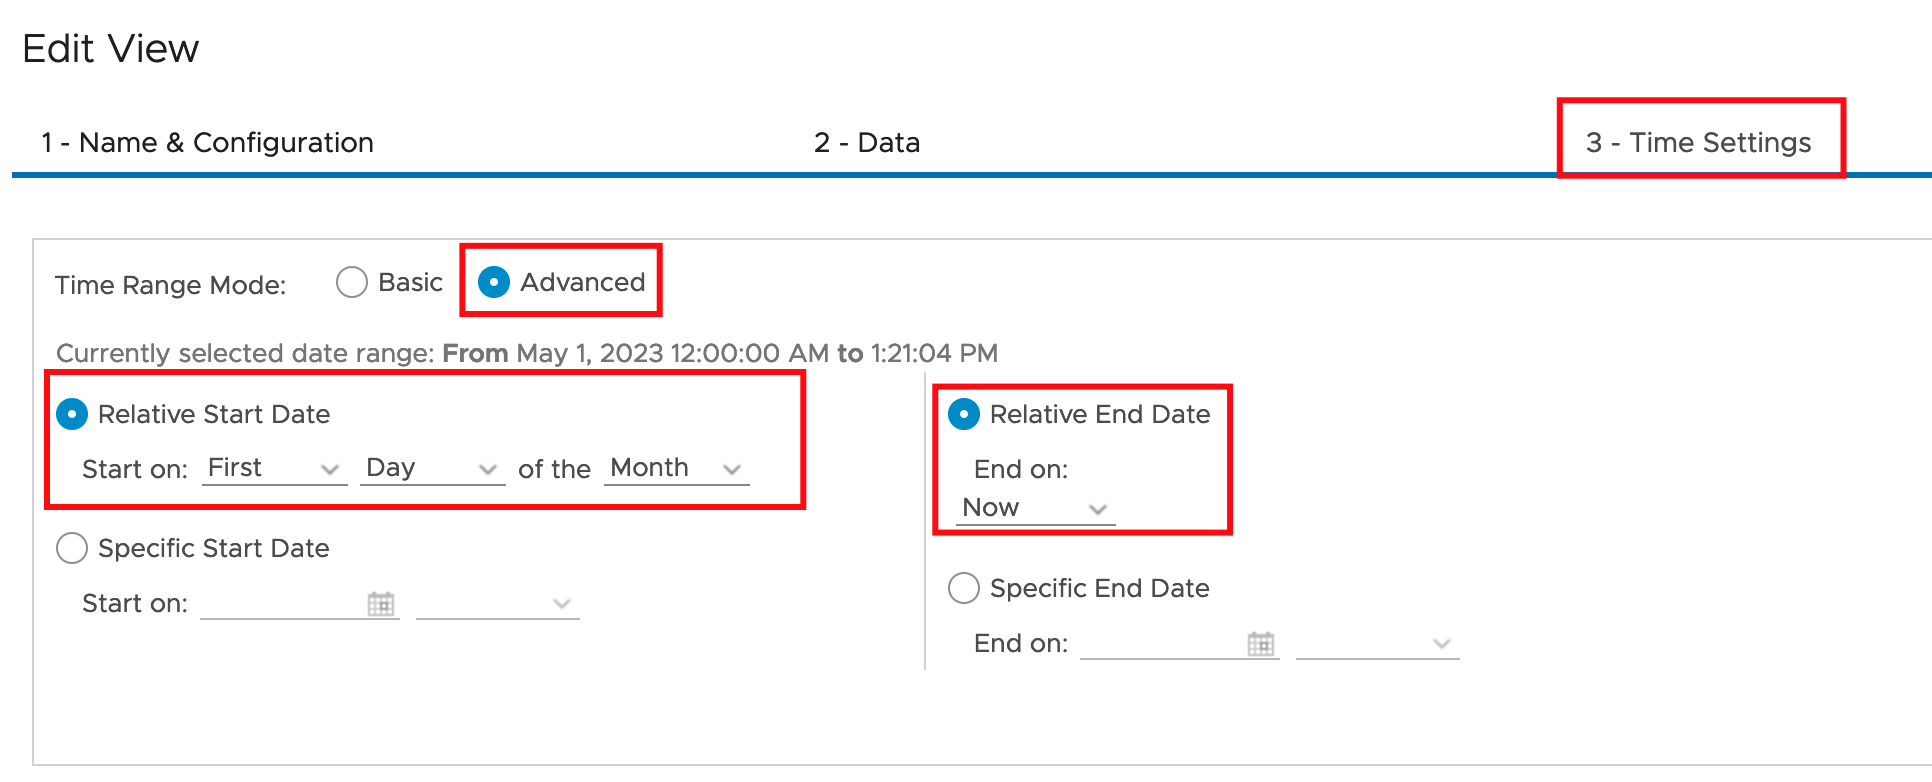
The next crucial part is the Time Settings option. This option provides a wide range of settings related to the time range applied to the selected metrics or properties. The following picture shows the settings needed to specify the MTD time range.
The second important construct in Aria Operations are Custom Groups. Custom Groups are not only ideal for dynamically grouping objects using certain criteria, it is also a perfect way to add additional properties to all objects within a group.
I am using the Custom Group construct to add Energy Rate and CO2perkWh values to ESXi Host Systems running in a certain locations. The next picture shows the Custom Property option within Custom Group configuration.

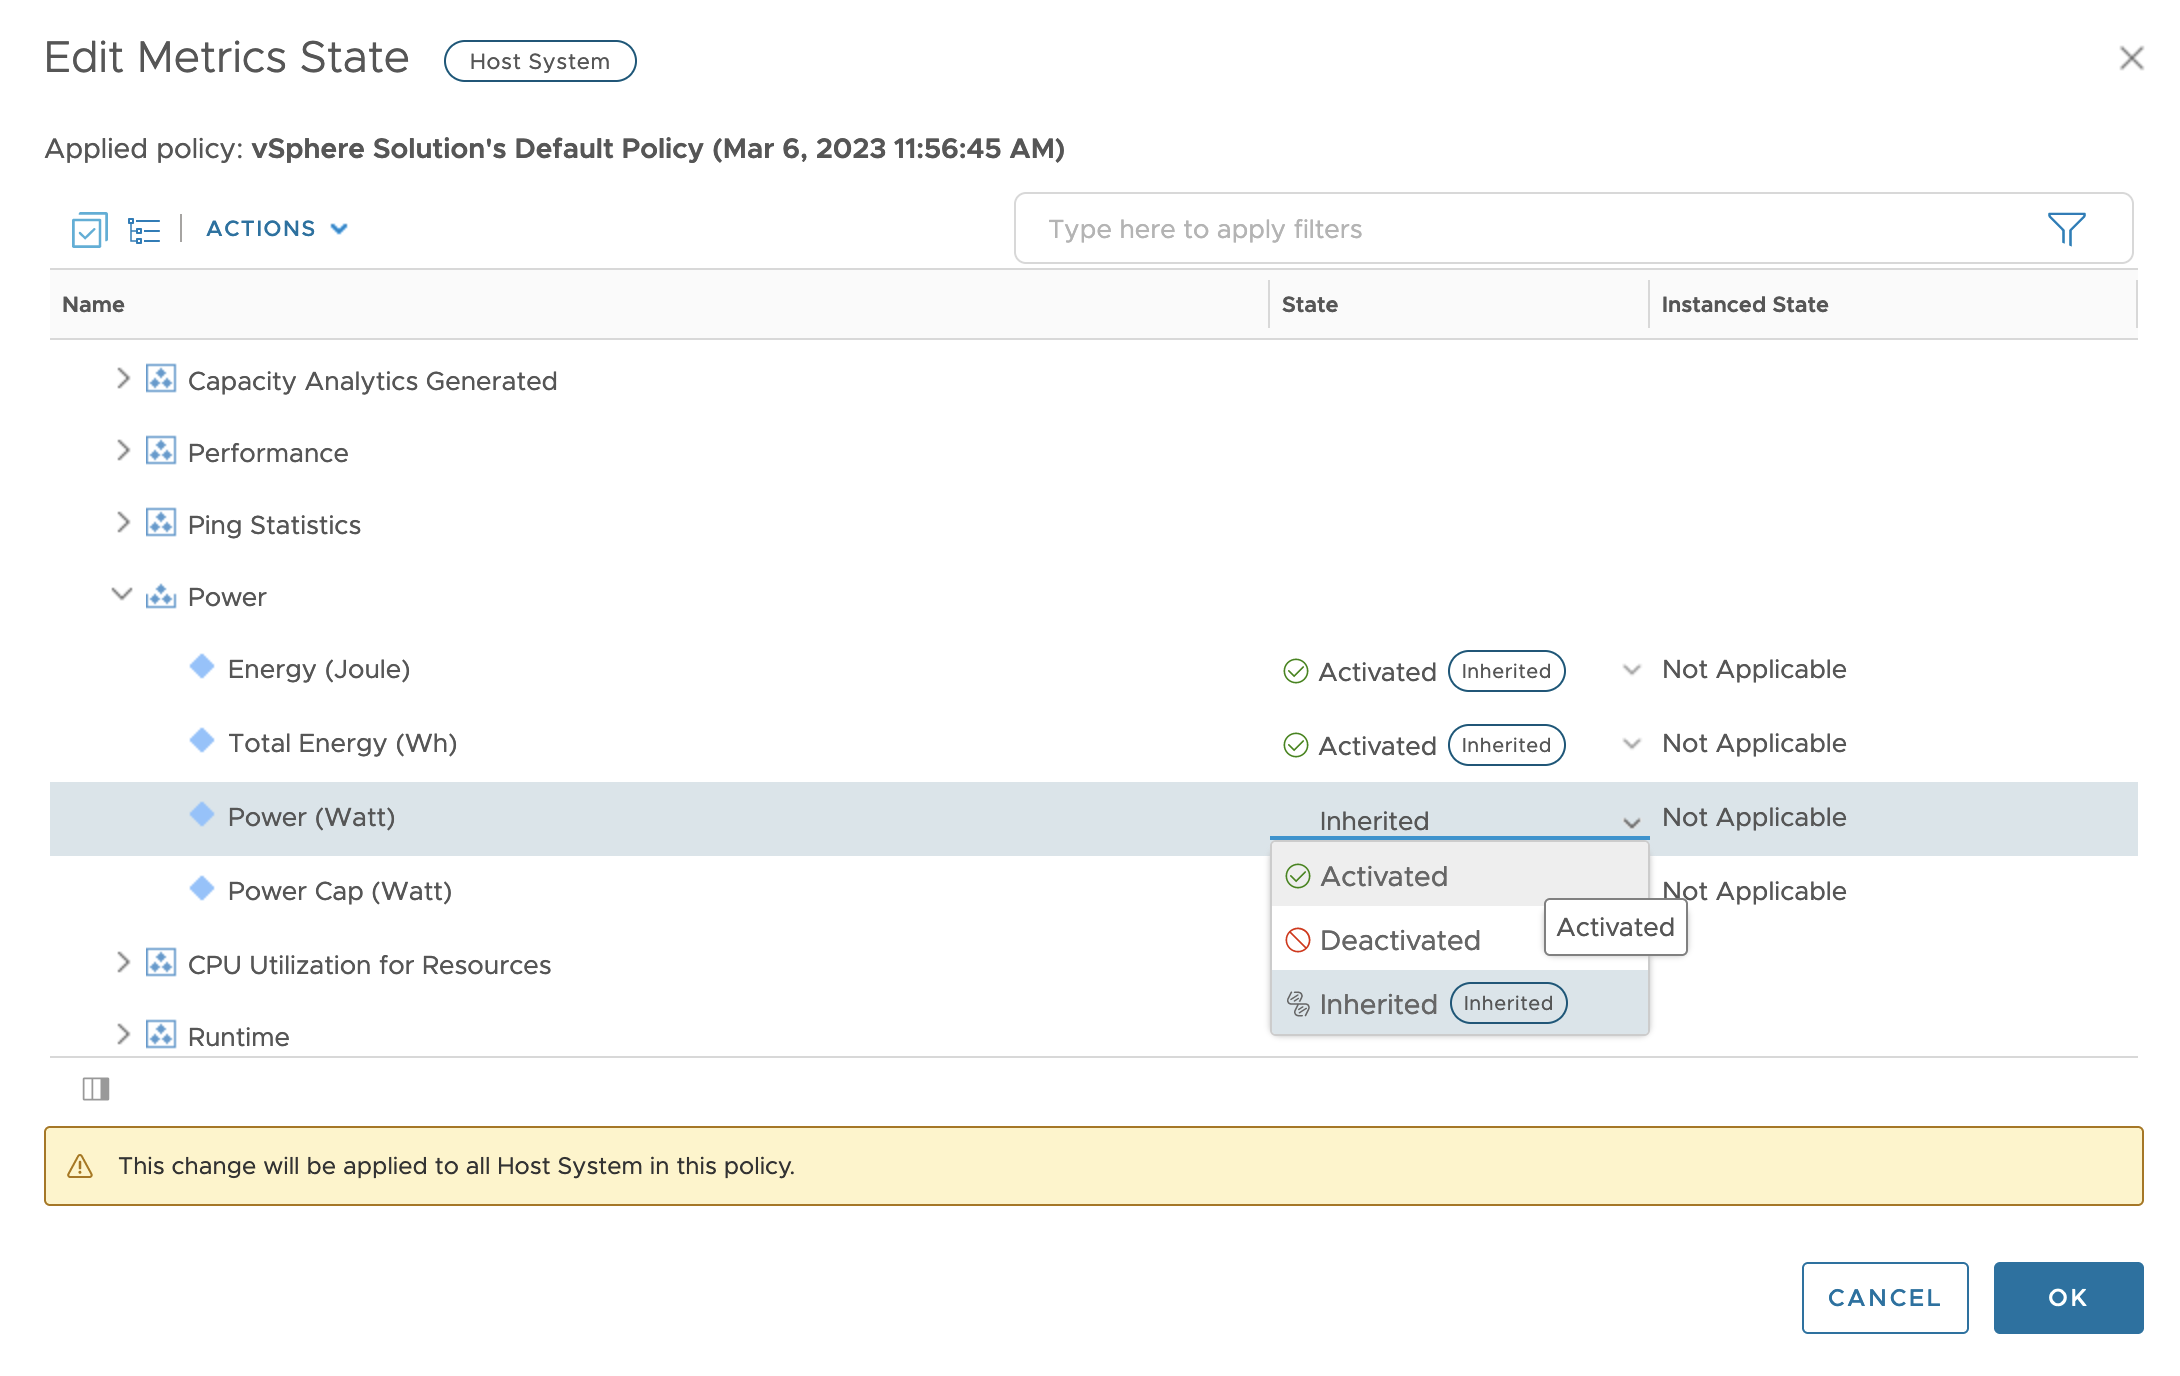
As already described in one of my previous blog posts, VMware Aria Operations collects all relevant power and energy related metrics, some of them need to be activated in the respective policy. The metrics used in this scenario are:
Cluster Compute Resource: Power|Power (Watt)
Host System: Power|Total Energy (Wh)
Host System: Power|Power (Watt)
Virtual Machine: Power|Total Energy (Wh)
Virtual Machine: Power|Power (Watt)
There are literally thousands of metrics and properties and still sometimes a specific metric is missing. The first step is always to check the Aria Operations policy for disabled metrics and if there is still something missing –> Super Metrics to the rescue!
I am using Super Metrics in my scenario to:
- calculate the
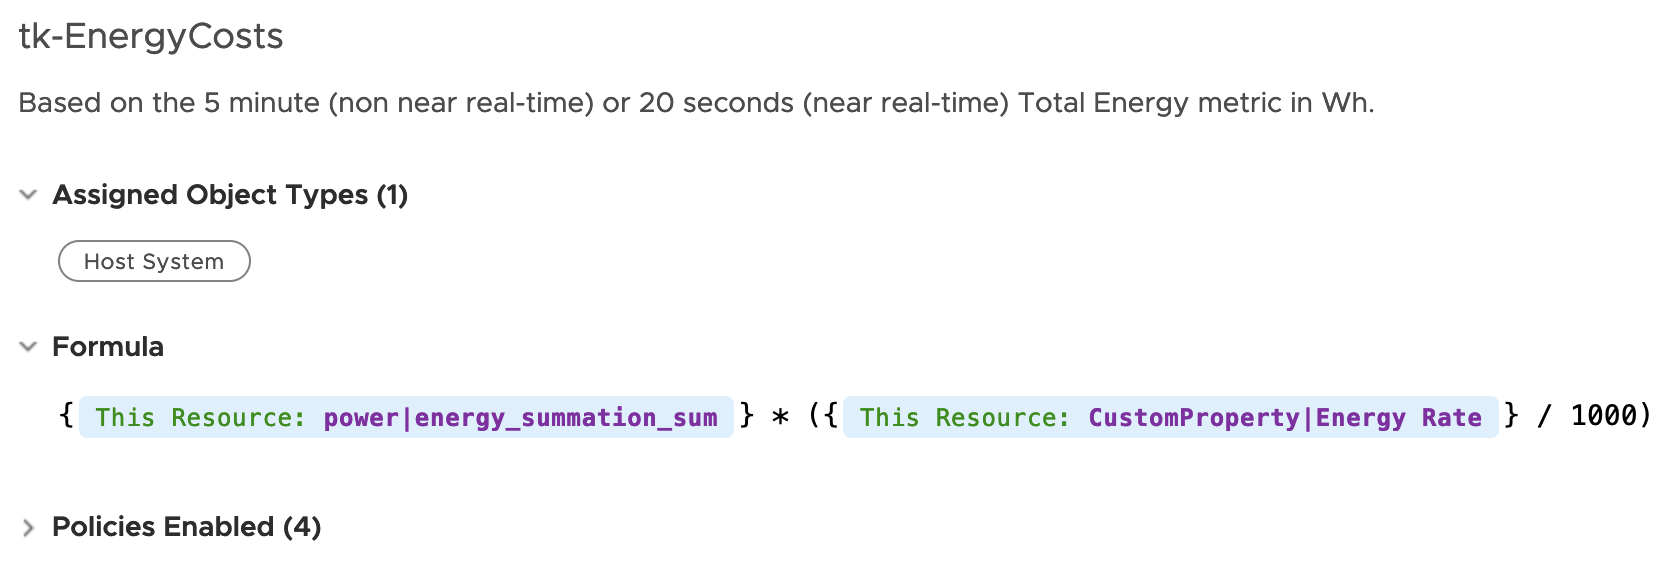
Energy Costsmetric (at the Host System level) based onHost System: Power|Total Energy (Wh)and theEnergy Ratecustom property (adjusted to Wh value) - calculate the
Carbon emissionsmetric (at the Host System level) based onHost System: Power|Total Energy (Wh)and thetk-CO2perkWhcustom property - calculate the
sum of Energy Costson all relevant levels - calculate
sum of Carbon Emissionson all relevant levels - calculate
sum of Energy Consumptionon all relevant levels
The next picture show as an example the tk-EnergyCosts Super Metric.
With all this pre-work (described on GitHub) I have created following dashboards to vizualize the energy related information from the initial use case.
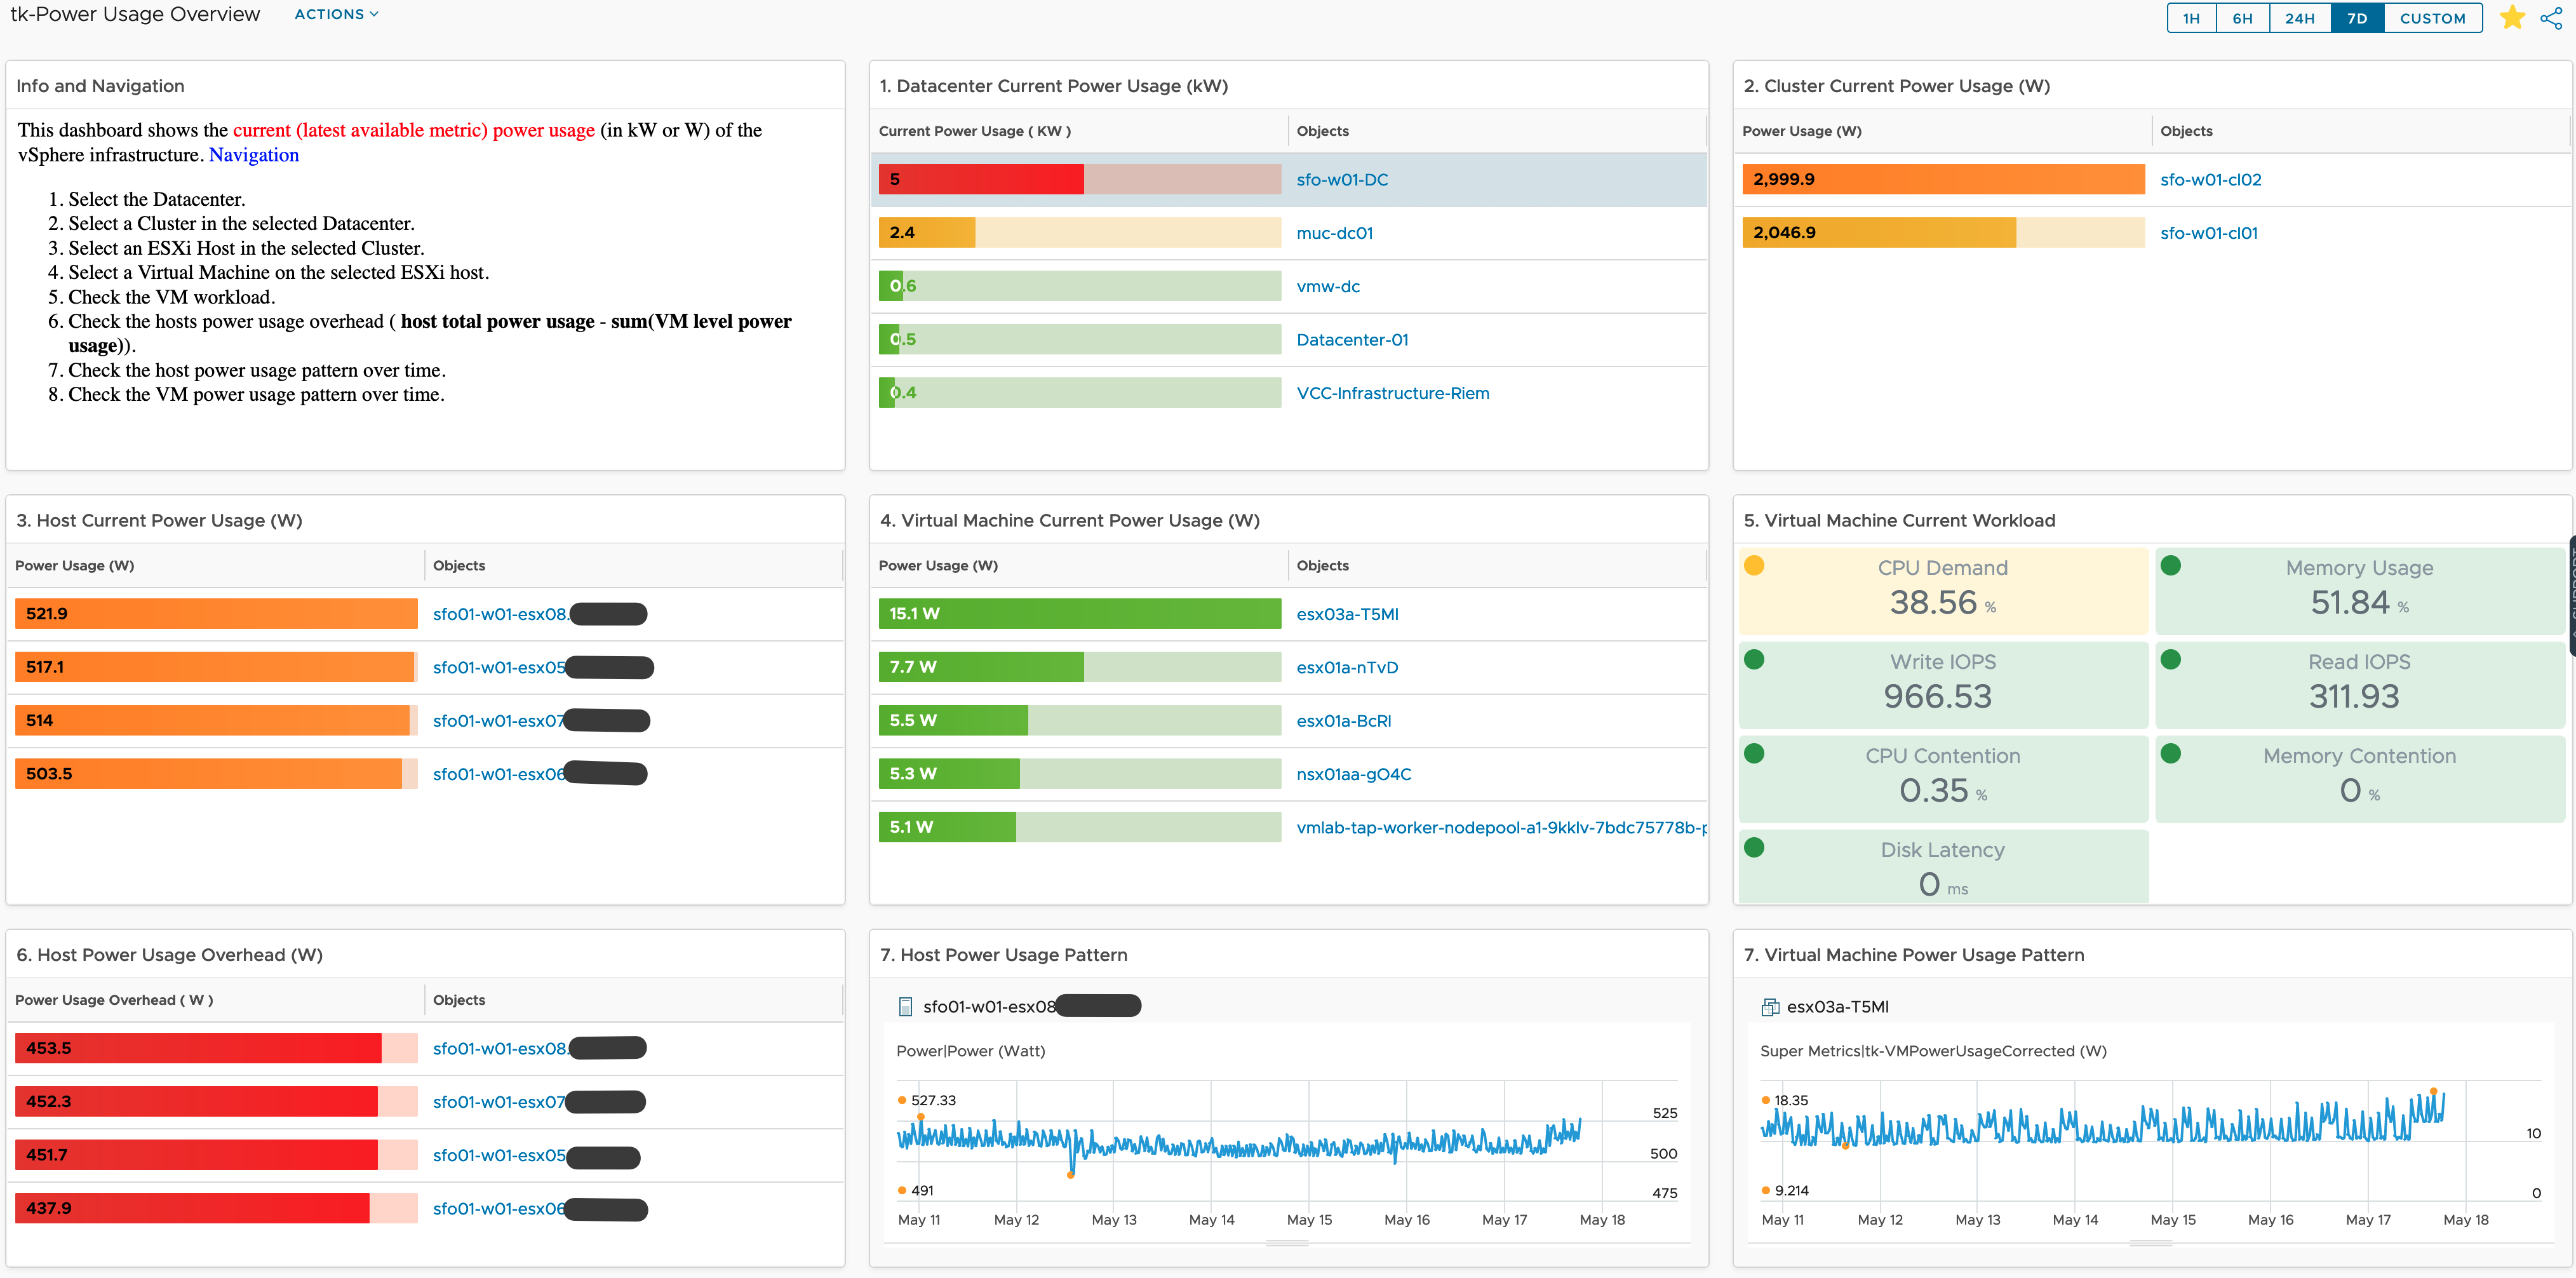
The first dashboard shows the current (or last available) power usage metrics. The navigation through this dashboard is described in the first widget.
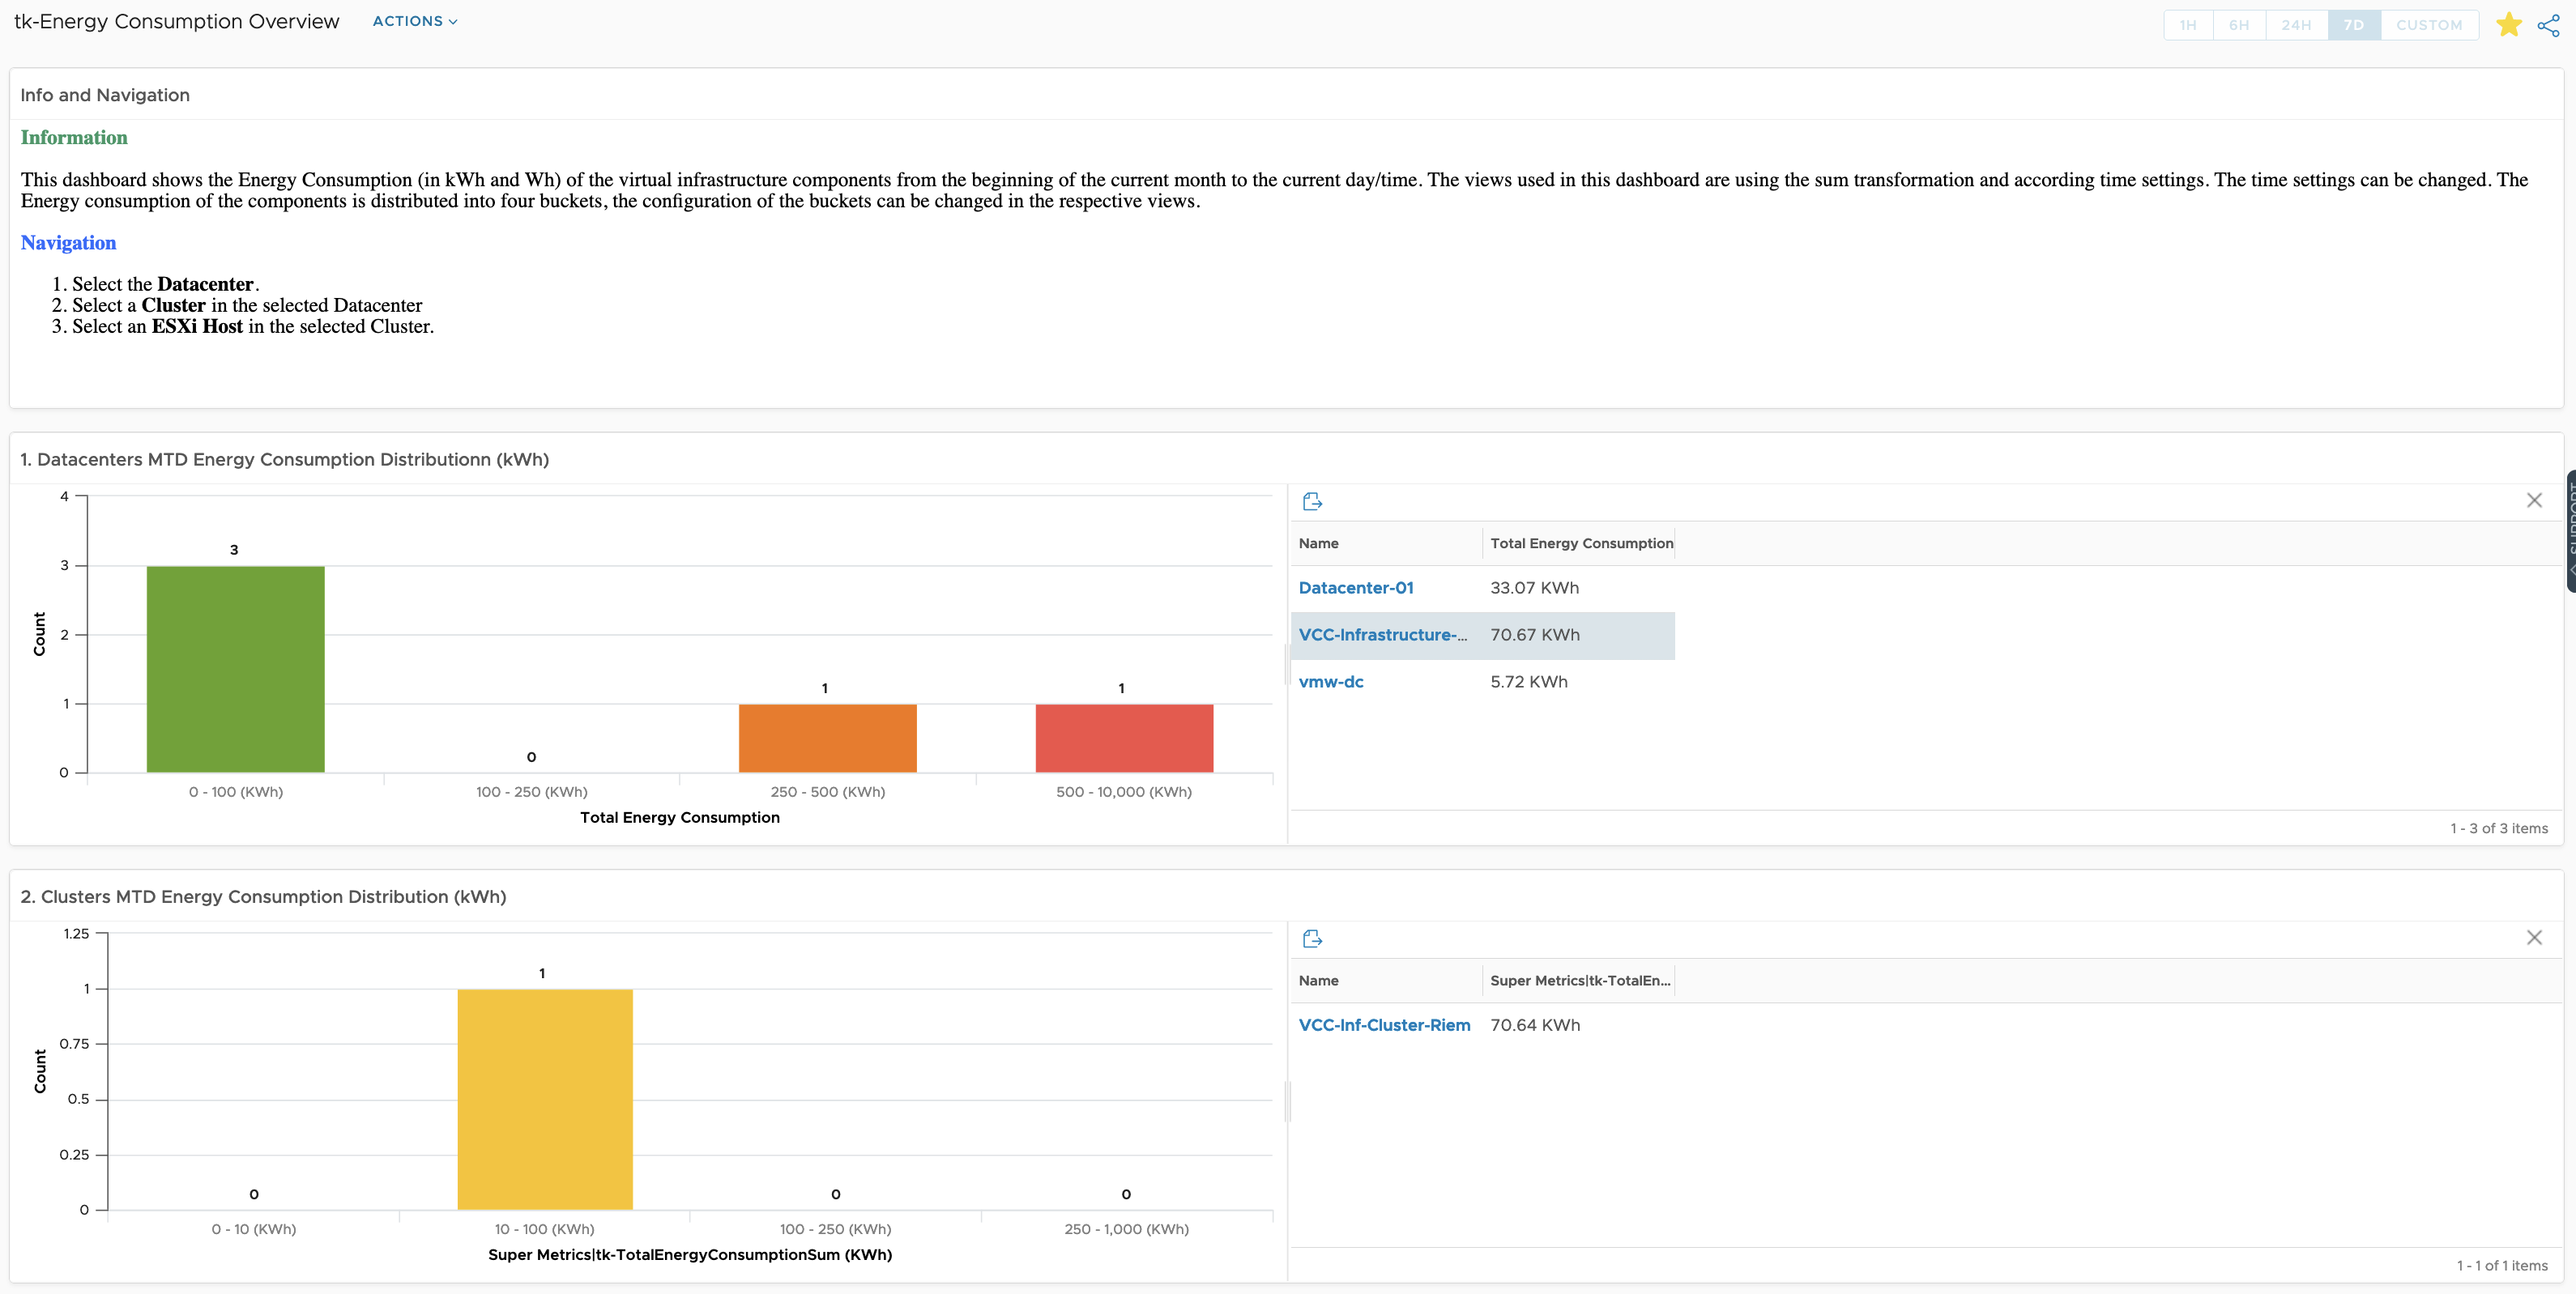
The second dashboard focuses on energy consumption since the beginning of the month. As described in the “Info and Navigation” widget, the configuration of the buckets can be changed in the corresponding view to better meet the actual values in your environment. This applies to all dashboards and views.
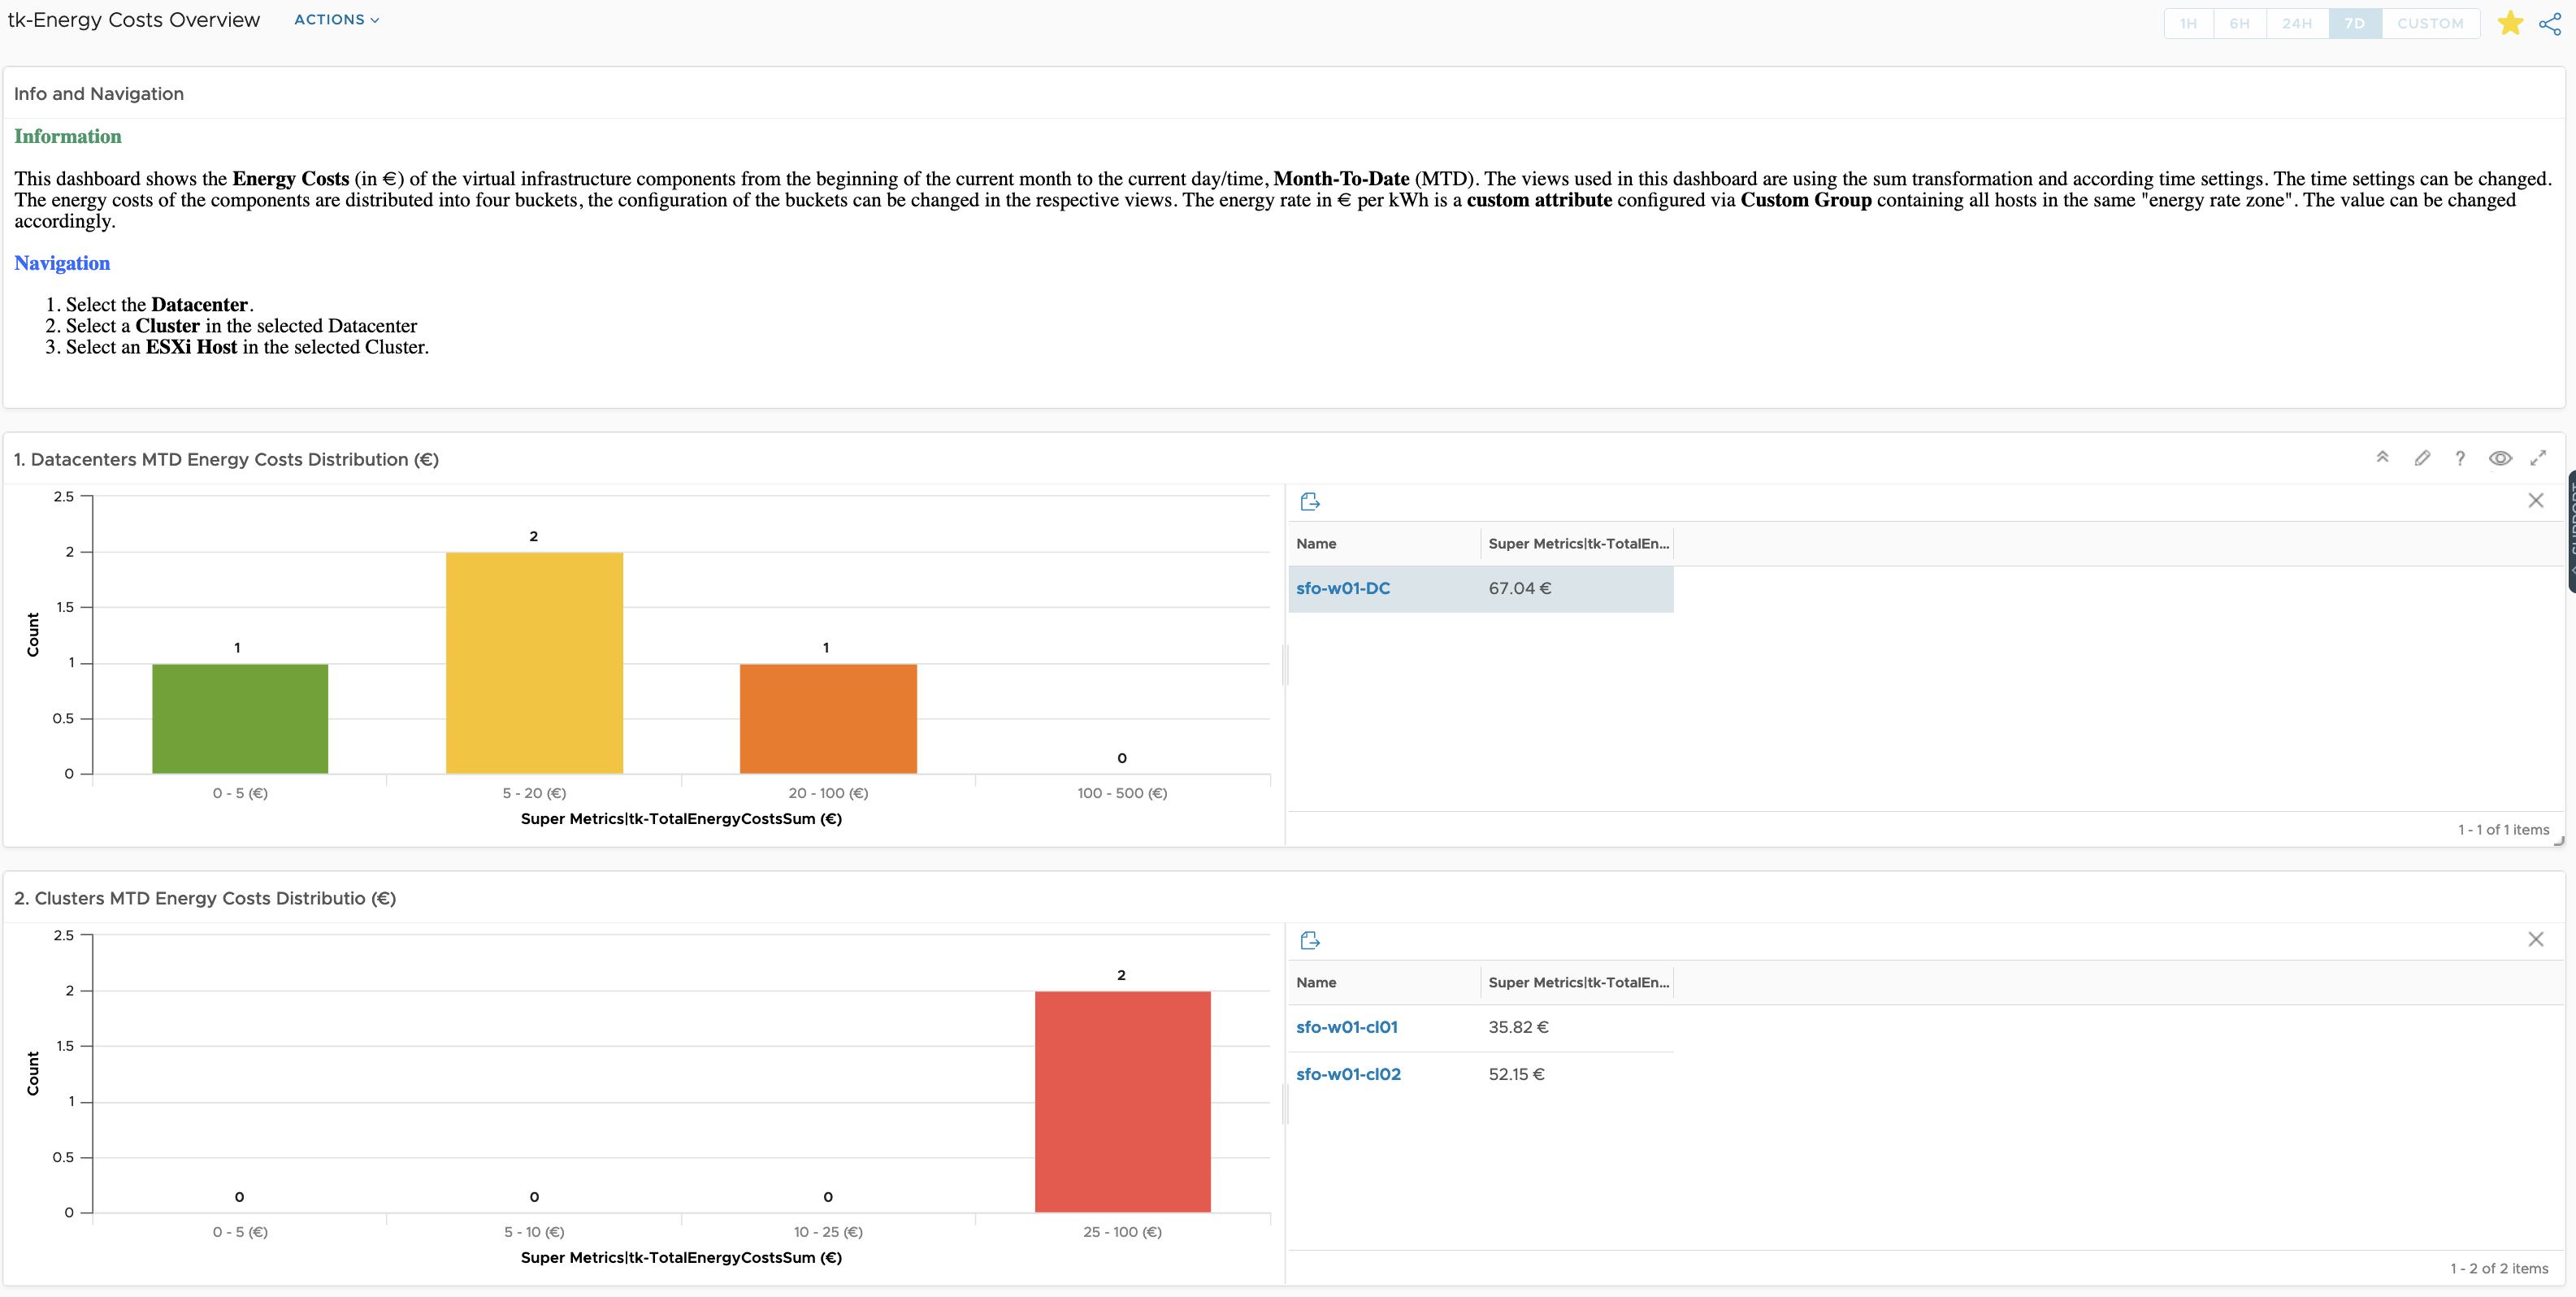
The third dashboard shows the energy costs since the beginning of the month. As mentioned before, the energy rate value can be easily configured via Custom Groups.
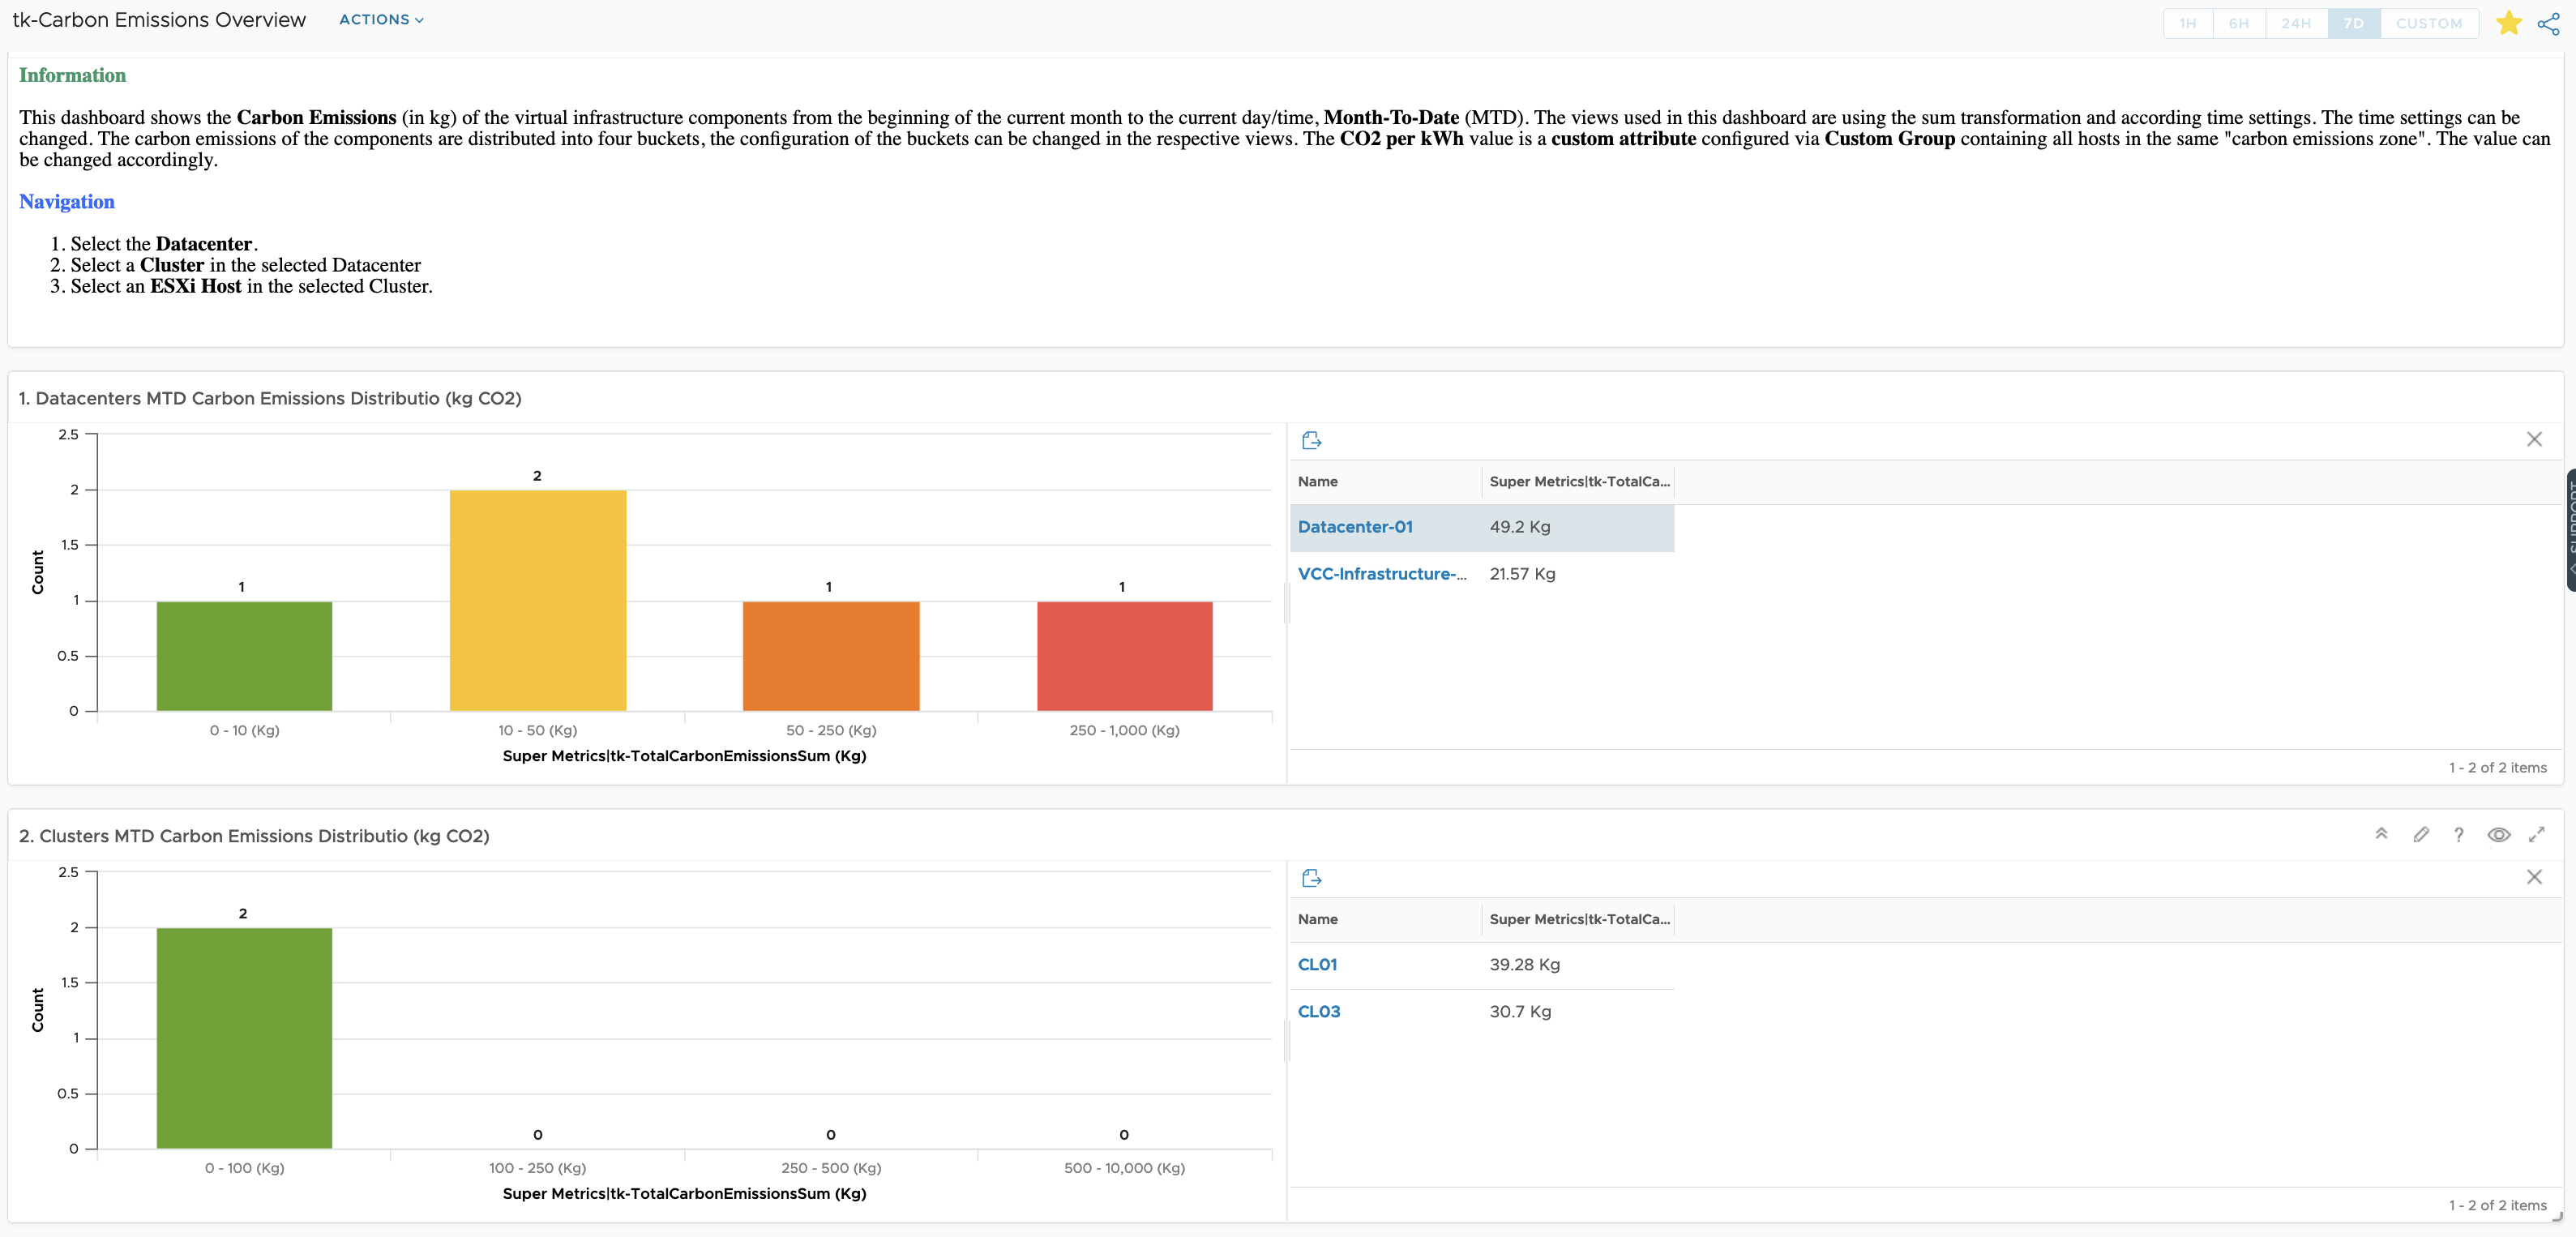
The fourth and last dashboard vizualizes the carbon emissions since the beginning of the month. Similar to the energy rate, the CO2 per kWh value can be also configured via Custom Groups.
The content can be downloaded directly from my GitHub repo or via VMware Code.
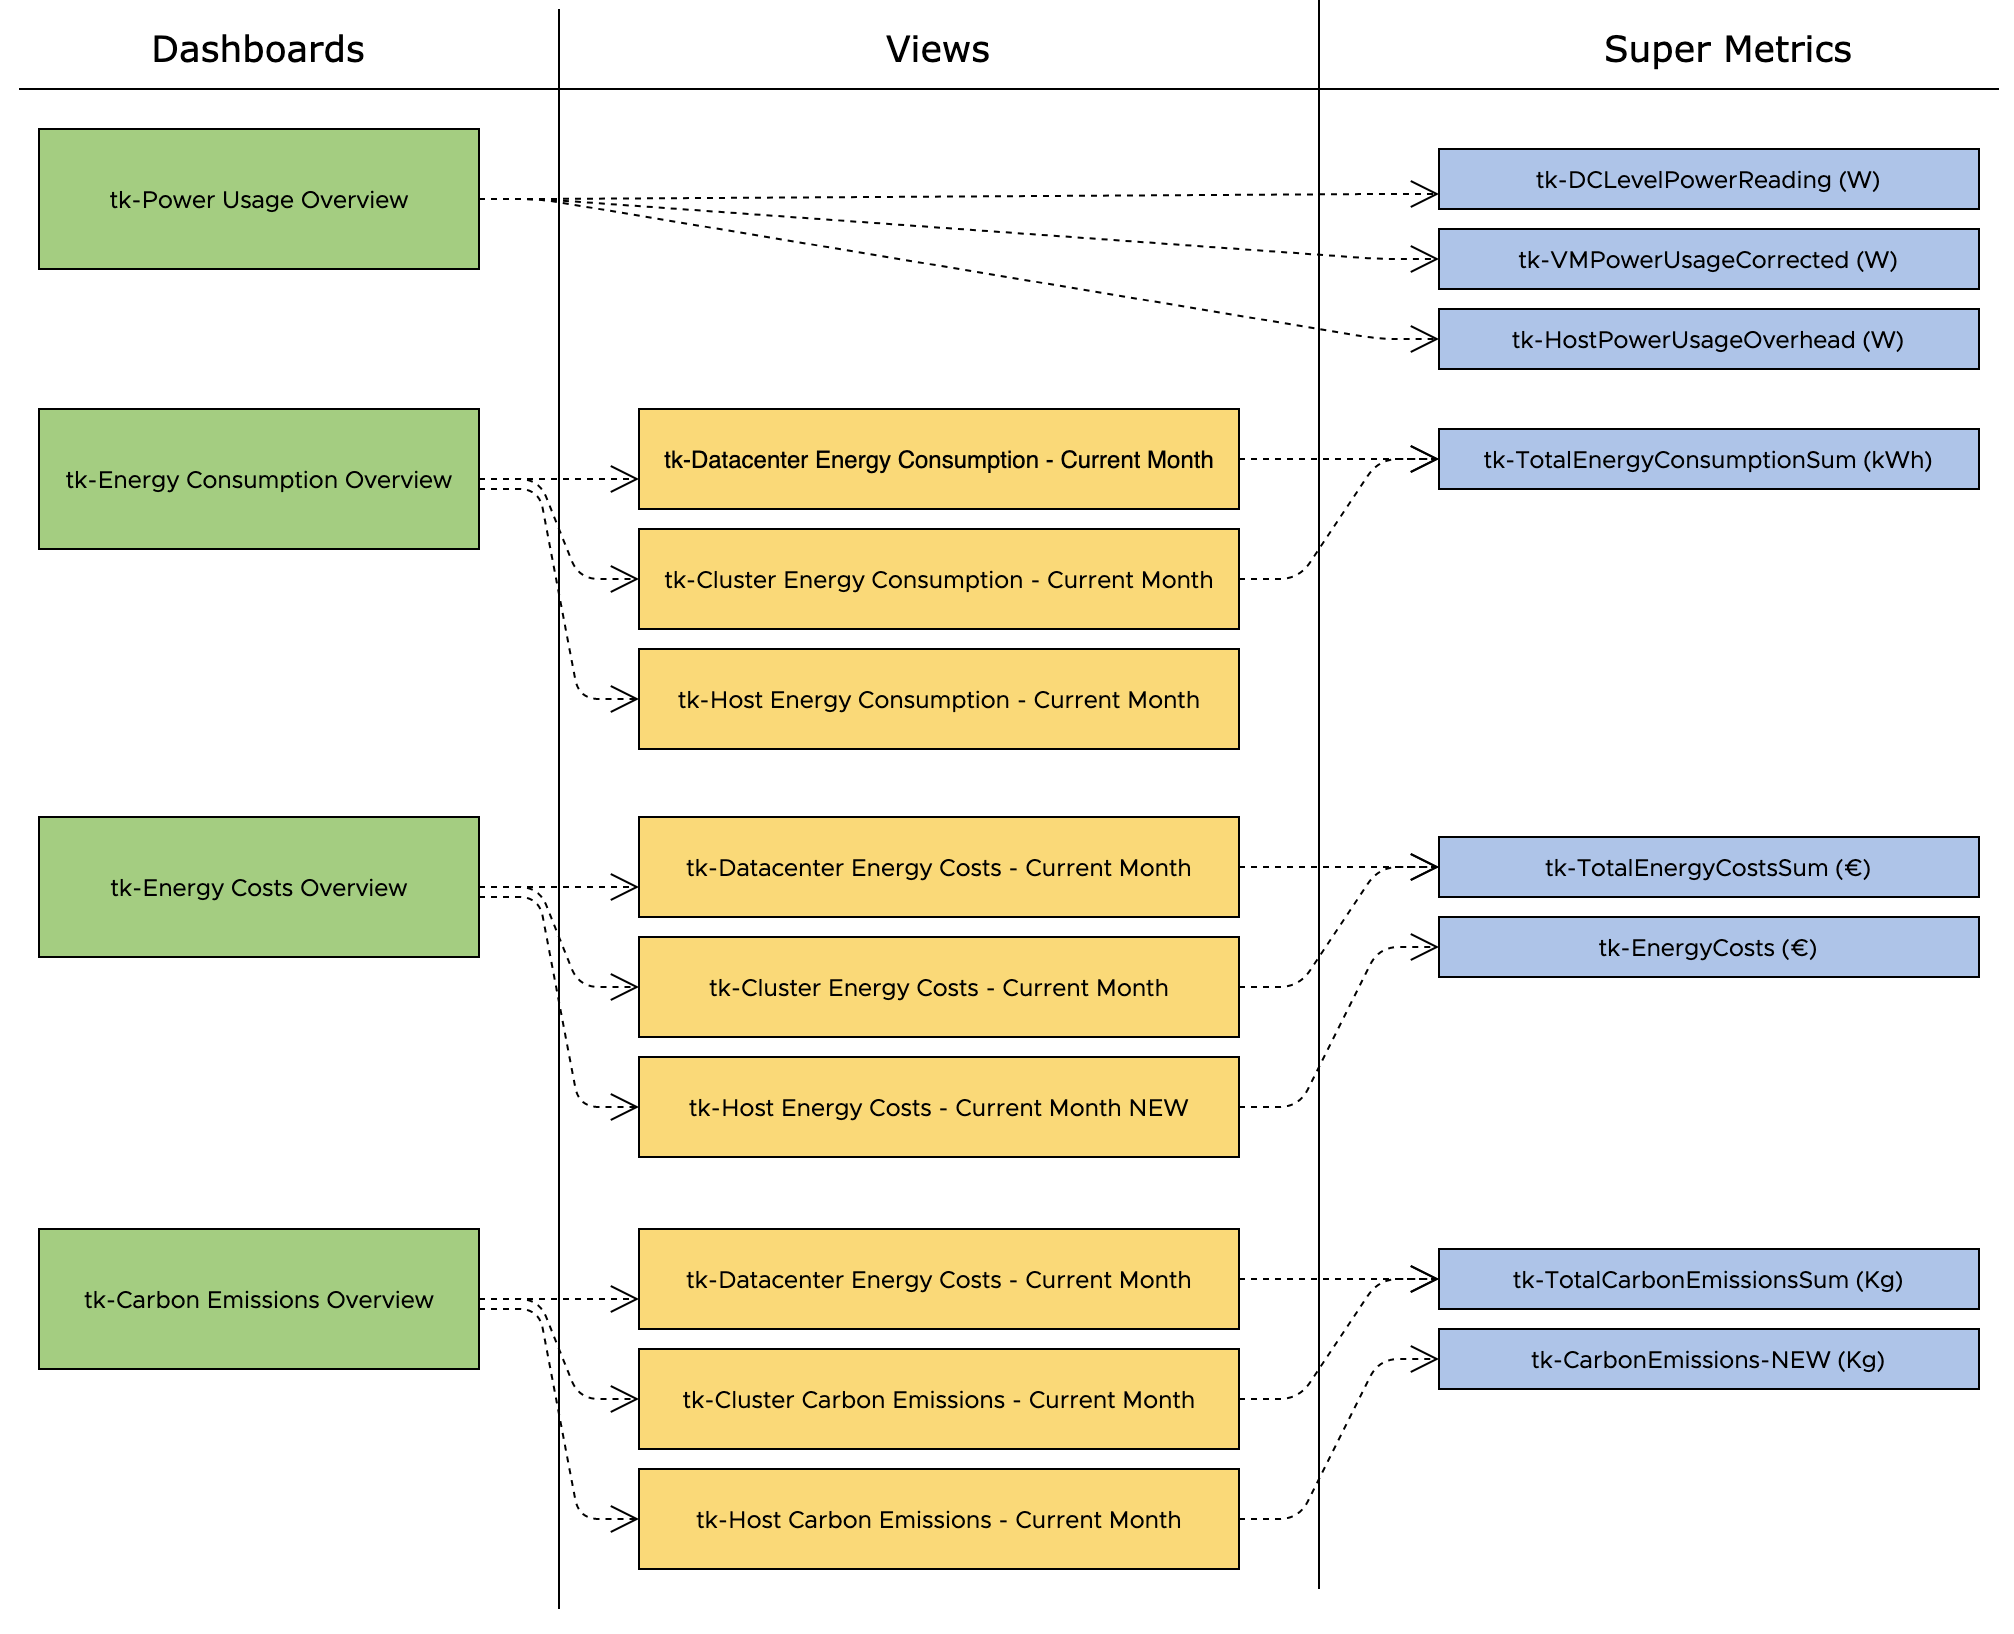
The following picture shows the relations between the various custom content objects.
Happy dashboarding!
Stay safe.
Thomas – https://twitter.com/ThomasKopton
Super Post as always ! Thank you very much.
I would like to know if vROPS can extend this to detect / dashboard other devices storage arrays, network switch etc. ?
Hi,
in short – yes.
There are several ways how you can add more device or in general more data sourced to Aria Operations.
Given your endpoint provides a REST API and JSON formatted data, this might be the easiest option:
https://communities.vmware.com/t5/Management-Pack-Builder/ct-p/13006
I will blog about this shortly.
Thomas
Hi,
thx for the great work and sorry for my poor english. Can you tell me how did you solve the inconsistency on your screenshots between
-Month to date Host level carbon emission of co² in kg (30.7kg and 39.28kg) and month to date cluster level carbon emission of co² in kg (49.2kg)
-Month to date Host Energy Cost (35.82€ and 52.15€) and month to date Cluster Energy Cost (67.04€)
?
On my own dashboards there are same inconsistencies