As you all probably know, VMware Aria Operations is providing several energy consumption and sustainability related data at different levels. From the power usage of a single Virtual Machine up to the aggregated data at the vSphere Cluster (Cluster Compute Resource) level.
What we are missing, at least as of today, are similar aggregated metrics at the Datacenter and Custom Datacenter level.
Fortunately there is an easy way to calculate the missing information. VMware Aria Operations Super Metrics is the recommended way to implement it, as usual in such scenarios where we need to derive data from existing metrics using mathematical formulas.
In this short post I will focus on one specific metric, the general procedure applies to any other metric.
Use Case
“As DC manager I want to see the energy consumption of my data centers over the period of last month (or any other configurable time period).”
Implementation
To cut the long story short, I will use a Super Metric to calculate the sum of the Sustainability|Power usage (kWh) metric at the Cluster level and make it available at the Datacenter and Custom Datacenter object level. Following picture shows the available metric at the cluster level.

Please note that every data point of this metric shows the power usage over the last 5 minutes. The power usage over the last hour is the sum of 12 data points. For the sfo-w01-cl01 cluster in the previous picture it would be roughly 160W * 12 = 1920Wh = 1,92kWh.
The Super Metric is extremely simple, you see the formatted formula in the following picture alongside with the object types this Super Metric will be assigned to (calculated for), Datacenter and Custom Datacenter, and the Aria Operations Policies where this Super Metric will be activated. As always for Super Metrics, do not forget the last step – activate the new Super Metric in your respective policy.

If you prefer to copy and paste the formula, here comes the unformatted formula:
sum(${adaptertype=VMWARE, objecttype=ClusterComputeResource, attribute=sustainability|power_usage, depth=2})The following picture shows the new Super Metric being calculated every 5 minutes for one of my Datacenter objects.
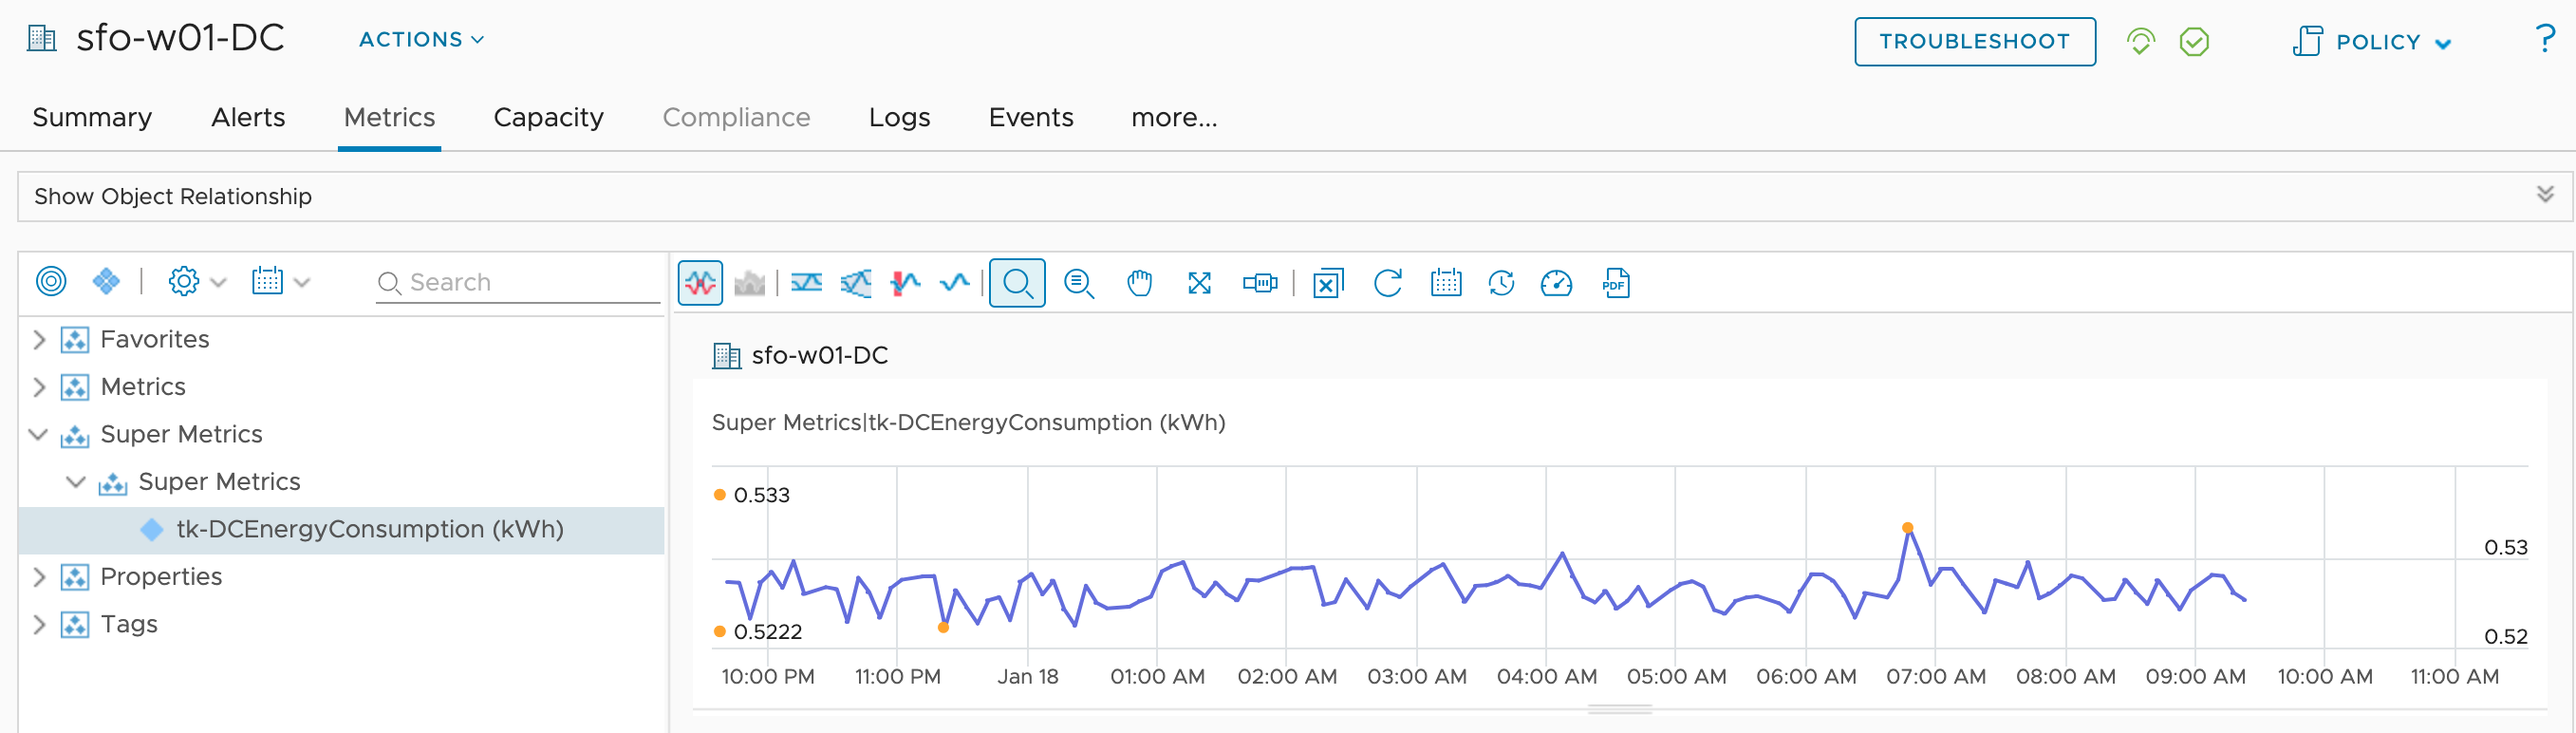
Now we can create a View, as shown in the next picture, with all our Datacenter (and Custom Datacenter) objects and use it in Dashboards or Reports.

As always the time range configured in the Aria Operations View can be adjusted to meet the actual requirement.
Stay safe.
Thomas – https://twitter.com/ThomasKopton