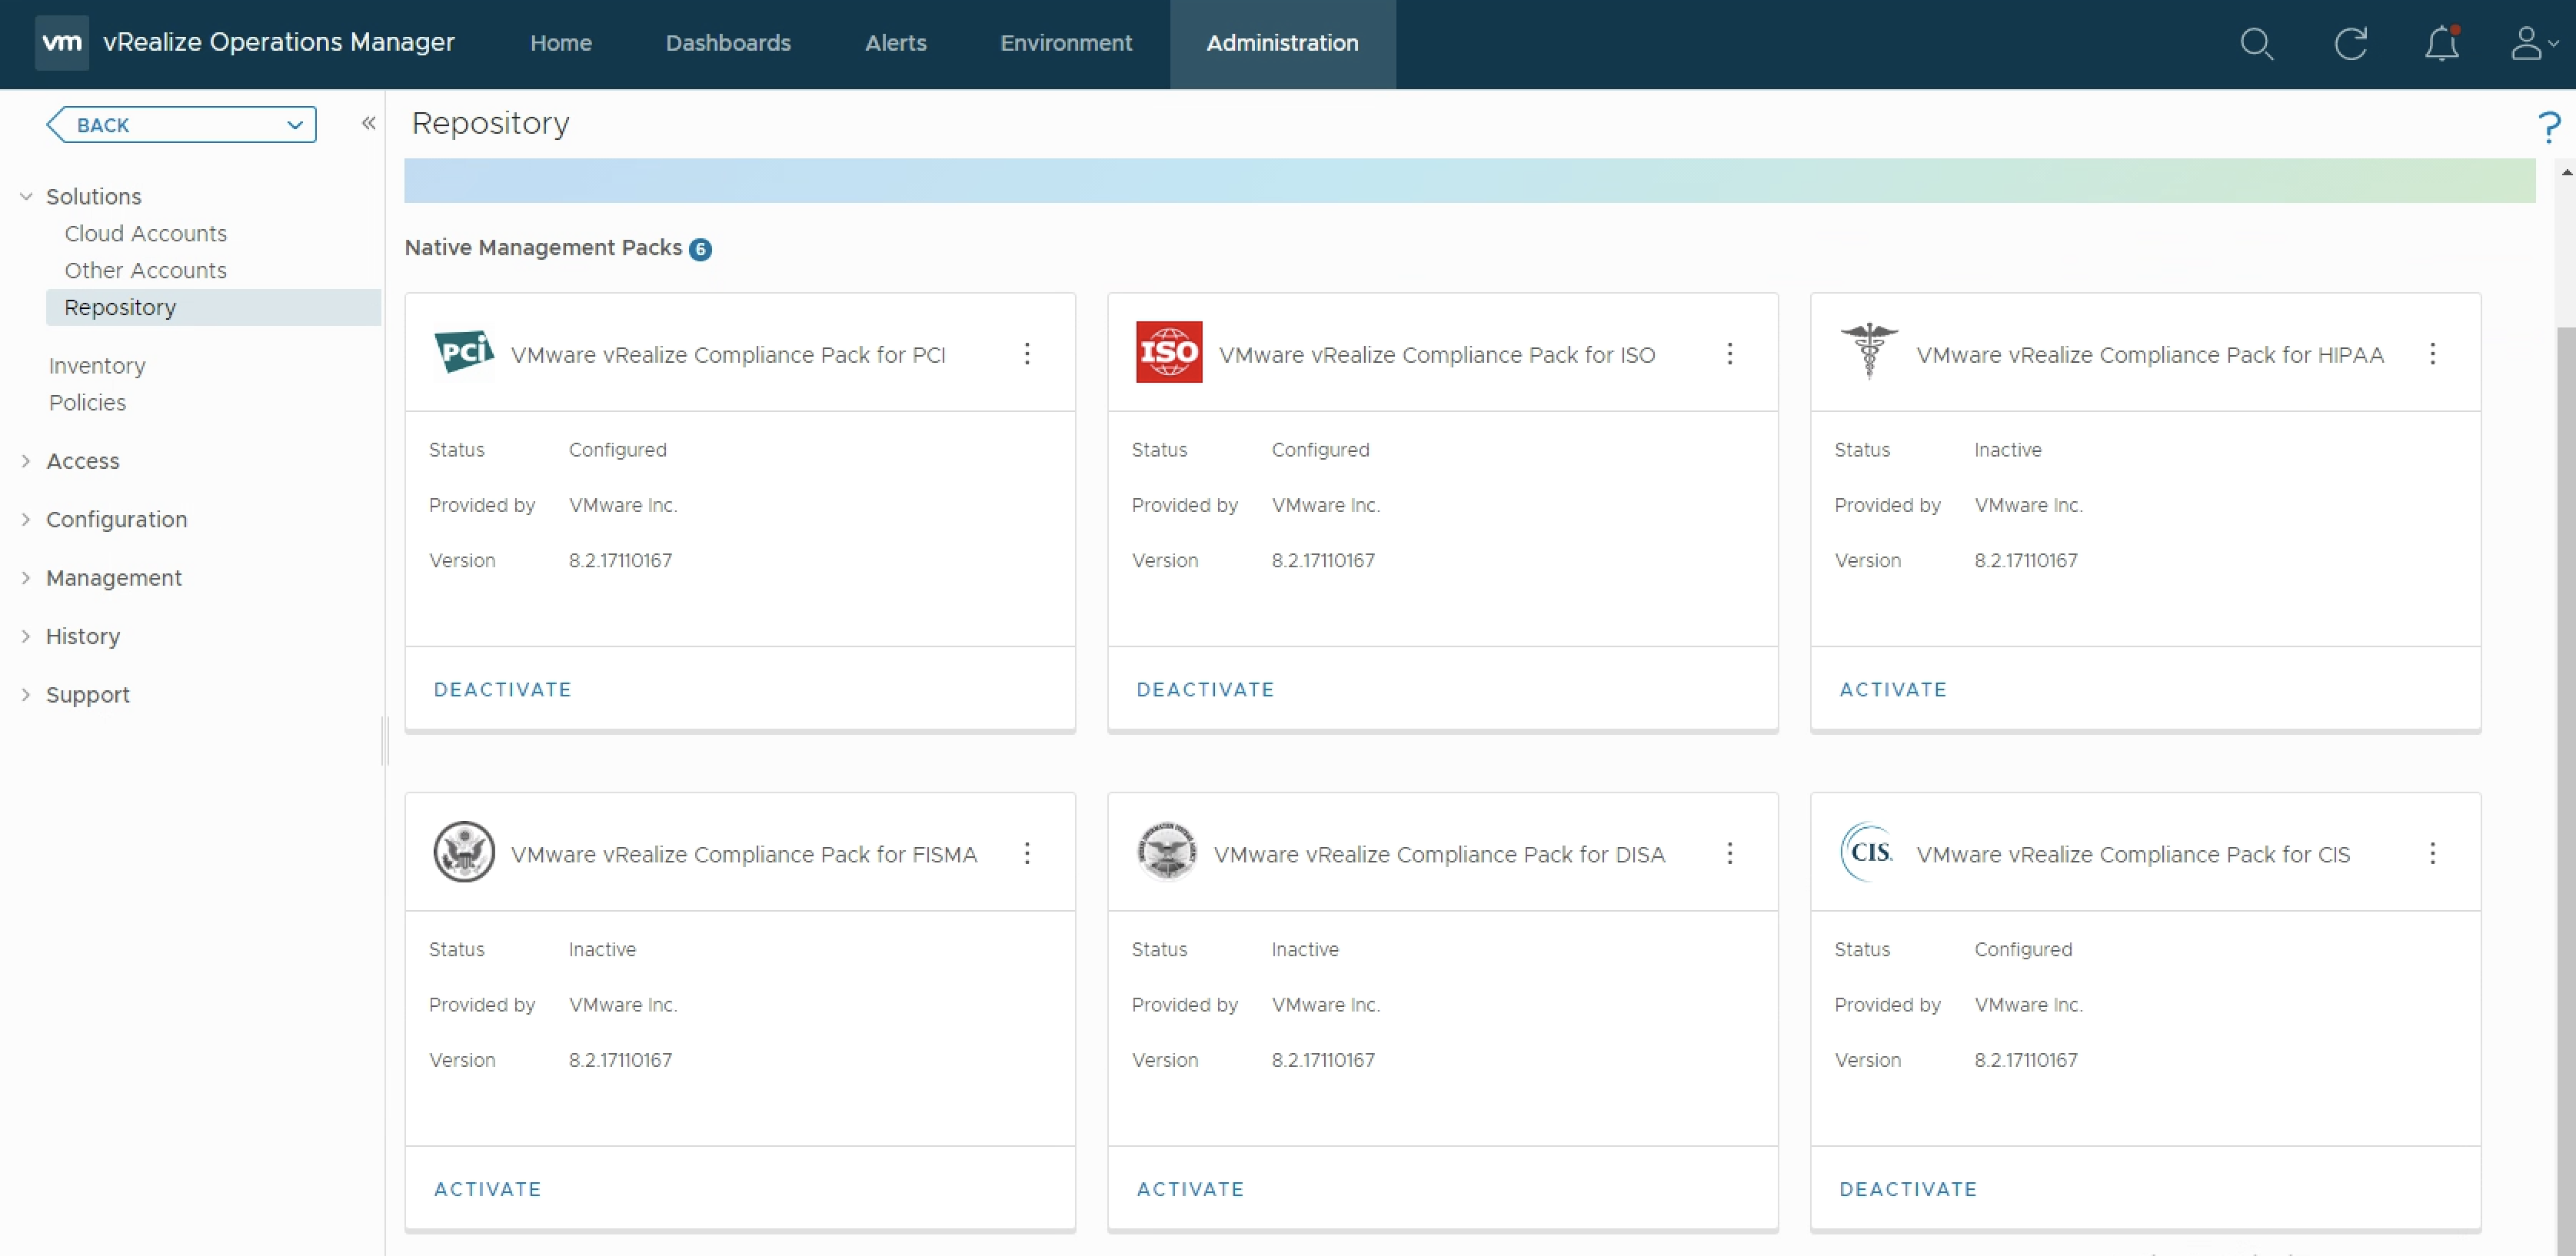
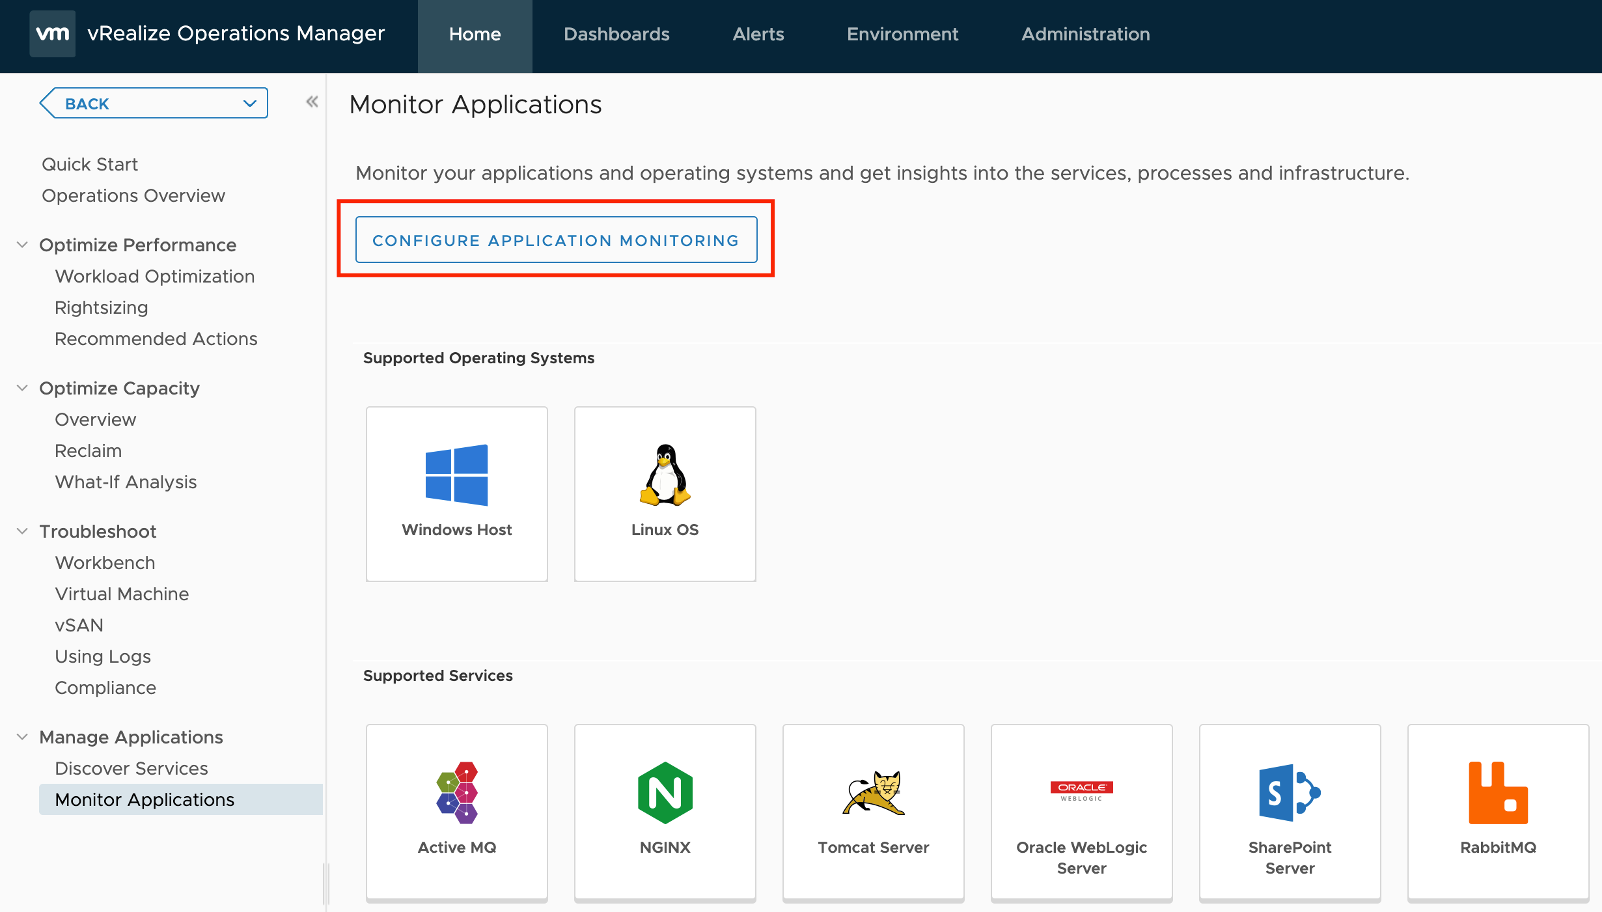
Maintenance Mode for vRealize Operations Objects, Part 2

Part 1 of the “Maintenance Mode in vRealize Operations” blog series focused on a very basic scenario.

Simplified, we turned off data collection and made the object basically not existent from vROps point of view as the requirements were straight forward. To accomplish this, we used the vROps Maintenance feature.

In this part we consider a slightly more complex scenario. The use case for this blog post is:

“In case of ESXi host maintenance mode I do not want to receive any alerts for the affected Host System objects.” As always during assessment we collected following additional information:

  • There are only few ESXi hosts in maintenance at the same time
  • The team doing the maintenance in vCenter has read-only access to vROps UI
  • Automation could be used but is not mandatory
  • Metrics and properties need to be collected during the maintenance

Obviously, we cannot use the vROps Maintenance feature as this would violate the last requirement and the vCenter team would need additional permissions in vROps.

The ingredients for one possible solution are:

  • vCenter Maintenance Mode – Interface for the vCenter team to start the host maintenance
  • vROps Policy – place where we modify the behavior of vROps with regard to distinct objects
  • vROps Custom Group – place where we group objects to apply a vROps policy to them

The following picture describes (simplified) the model of Objects, Custom Groups and Policies in vROps:

Figure 1: Simplified object model – vROps objects and policies

Step 1 – Create a vROps Policy which implements the requirements.

In our case the requirement is to disable all alerts for Host Systems during ESXi maintenance hence we need a vROps Policy in which we are going to disable the corresponding alert definitions.

A new policy is being created based on an existing one, so only few changes will be needed to tweak the default behavior of vROps.

Figure 2: Creating new vROps Policy

In my test environment I am using my default policy as the base line for the new policy.

Figure 3: Setting the policy baseline

We go to the Alert Definitions section and disable the corresponding alert definitions for the Host System objects.

To reduce the list of alert definitions some filtering options may be applied. In the following picture you see filters for object type and the current state of the alert definitions. We do not care about disabled alert definitions as this is the is the desired state.

Figure 4: Alert definitions – display filter

The easiest way to get rid of all vROps Host System related alerts is to select all alert definitions in the list and disable them locally.

NOTE: This is a very simplified approach. In real life scenarios the requirements may be more complex and could result in alert definitions left enabled even during ESXi maintenance operations.

Figure 5: Disabling all Alert Definitions – 1
Figure 6: Disabling all Alert Definitions – 2

Step 2 – Create vROps Custom Group which will contain ESXi hosts being in Maintenance Mode

Following the simplified object model we need a dedicated vROps Custom Group to pool the objects we want to receive the new policy.

Figure 7: Creating a vROps Custom Group

Group Type” is just an arbitrary categorization to reflect your environment, once you have created a custom group, you cannot change the “Group Type” (at least not using the UI).

In Policy we select the newly created vROps Policy which disables the alert definitions.

Keep group membership up to date” ticked ensures that the membership will be re-validated every 20 minutes.

To tell vROps which object should be members of the group we need to specify appropriate membership criteria.

Figure 8: Specifying the vROps Custom Group – 1

In the previous figure we select the “Maintenance Mode” property of the Host System object type as the criteria to determine if a certain ESXi host system should become member of the custom group or not.

In the following picture we see a host being in vCenter Maintenance Mode.

Figure 10: vCenter – ESXi in Maintenance Mode

The “Preview” button let us check the configured membership criteria.

Figure 11: Host in Maintenance Mode and member of the custom group

Now the ESXi host system is member of the custom group and receives the new policy which disables all alert definitions for this particular object. In vROps one can see the current policy for any selected object in the upper right corner.

Figure 12: Host in Maintenance Mode receiving the new vROps Policy

Once the maintenance has been completed, vCenter admin disables the Maintenance Mode in vCenter and after up to 20 minutes the ESXi host is no longer member of our custom group and the previous (could be default) policy is being applied again.

Figure 13: Maintenance Mode ended – ESXi host receiving the original vROps Policy

As you probably noticed, one drawback of this method is a possible gap of max. 20 minutes between entering the vCenter Maintenance Mode for a host and vROps completing the re-evaluation of the custom group membership. That fact should be taken into account while designing the maintenance procedure.

In case automation plays a role in your environment and the policy needs to be applied immediately after entering the vCenter Maintenance Mode the corresponding vROps REST API call can be leveraged to programatically retrieve a list of ESXi hosts from vCenter and populate the custom group with the appropriate vROps objects. But this is another story…

Figure 14: vROps Custom Group REST API method

In Part 3 I will focus on use cases comprising additional objects types.

Maintenance Mode for vRealize Operations Objects, Part 1

In this and following posts I will show you few different ways of putting vROps objects into maintenance.

Objects in vROps – short intro

The method used to mark an object as being in the maintenances state depends on the actual use case. As usually, the use case itself is being defined by:

  • Requirements – what does “maintenance” mean from technical perspective, what exactly needs to be achieved?
  • Constraints – is there any automation in place, which team is involved, what and how many objects are involved?
  • Assumptions – can we assume that especially the number and kind of objects will stay the same or what is the expected growth?
  • Risks – what are the risks of using a certain method?

Let us assume our first use case is:

“In case of ESXi host maintenance mode I will to stop collecting any data for this host and disable all alerts.”

As always, before we start any design and implementation, we did a proper assessment and collected further information:

  • There are only few ESXi hosts in maintenance at the same time
  • The team doing the maintenance in vCenter can also access and use the vROps UI
  • Automation could be used but is not mandatory
  • All implications from stopping metrics and property collection for a given object, like ESXi host are known and accepted

Let us first look at one specific vROps object, in that case a Host System (ESXi host), using the vROps inventory option:

Host System object in vROps Inventory – “Show Detail” option

We see that the object is properly collecting metrics and properties according to both indicators. The details of the selected object can be checked by clicking the “Show Detail” button. This redirects you to the Summary page of the object. The currently collected metrics and properties can be checked by activating the “Show collecting metrics” option:

Collected metrics for the selected object

Activating the maintenance mode – the UI-way

The easiest way to put an object into maintenance mode is to use the “Start Maintenance” button in the Inventory overview:

Enabling Maintenance Mode in vROps UI

In the following dialog you can specify how long the object should be put into maintenance:

Specifying the Maintenance duration

After starting the Maintenance, you can again check the new status of the object in the Inventory view:


Object status during vROps Maintenance

Now, if you use the same “Show collecting metrics” option in the metrics tab of the object you can see that there are no metrics or properties collecting data. The object stopped the data collection entirely:

No collected metrics and/or properties during vROps Maintenance for an object

At this point you need to know that from the monitoring perspective this object is still in the inventory but the is no single data point being collected, stored and calculated in any way. Any calculations relying on data points coming in for that particular object will not provide new data or calculate nor entirely correct data. What “correct” means, depends on the actual metric, dashboard, view etc.

Deactivating the maintenance mode – the UI-way

As easy as we started the maintenance as easy it can be stopped again using the UI:

Disabling Maintenance Mode in vROps UI

After clicking on the “End Maintenance” button, vROps will start collecting all data for the object again.

Activating the maintenance mode – the REST-API-way

Starting and ending the Maintenance Mode using the UI is easy and convenient if you have to deal with a small number of objects and there are no other constraints like complying with e.g. change management process which may require automation.

If you need to deal with a large number of objects or if the vROps Maintenance Mode should be part of an automated process, leveraging the vROps API is the best way to implement it.

As always when using the REST API, the first step is to obtain the Access Token. To acquire the token, following POST method needs to be used:

POST /api/auth/token/acquire
aquireToken REST API call

Once we have a valid token, we can call the Maintenance Mode related operations. Following REST operation starts the Maintenance Mode for a given object:

REST API method to start the maintenance mode

As you can see, you will need to determine the vROps Object ID of the object(s) you need to put into maintenance before you can call the actual Maintenance Mode calls.

Once you have the ID(s) the method can be used:

REST API Call – Start Maintenance Mode

Deactivating the maintenance mode – the REST-API-way

To end the maintenance following REST API method has to be used:

REST API Call – End Maintenance Mode

Again, you will need the vROps Object ID to call this method.

Part 2 – Outlook

In the upcoming Part 2 of this post, I will describe other methods which may be used in cases when the requirements differ from the use case described in this post.

vRLI JSON Parser and vRO Log Messages

Problem statement:

In certain cases vRO workflow(s) are producing not very well structured  log messages.

“not well structured” means in this case that various workflow runs  may generate log messages which could include variable information in terms of number of key:value pairs as well as the values themselves.

For example we might have a workflow doing a certain complex automation job and depending on the job details the number and the actual content of information may be totally different.

What we could do is to try to put structure in the unstructured data in the workflow logic and use one of the well known vRLI parsers (KVP, CSV etc.) to parse the values for future use in vRealize Log Insight.

But what if this is not possible because for example the number of key:value pairs is unknown. Or the “keys” might change in every run?

Solution:

This is where the vRealize Log Insight JSON parser helps you.

The only two things you need to do is:

  • write your vRealize Orchestrator log messages in JSON format
  • Include the JSON parser in your vRLI agent config

vRLI will automatically recognize the format and parse the key:value pairs accordingly.

Example:

Here a very simple example of two lines of code doing nothing but writing log:

myLogMessage ="{\"command\":\"adduser\",\"orderId\":\"123456789\",\"orderCustomer\":\"customer01\",\"message01\":\"text01\",\"message02\":\"text02\",\"message03\":\"text03\",\"message04\":\"text04\"}";

System.log (completeMessage);

In this simple example you see several key:value pairs:

"command":"adduser",
"orderId":"123456789",
"orderCustomer":"customer01",
"message01":"text01",
"message02":"text02",
"message03":"text03",
"message04":"text04"

The format of the JSON can be completely unknown for the vRLI parser.

To enable vRLI parse the JSON message, we need to edit the vRLI Agent configuration. This is how the configuration looks like in the template provided by the vRealize Orchestrator Content Pack vor vRLI:

The default configuration uses the clf-parser as the parser for the log message.

Inserting the JSON-parser here let vRLI recognize all key:value pairs in the log message:

And here the parsed message in vRLI (open image in an new tab too see details):

If your message contains new key:value pairs during the next run, you do not need to adjust anything, the parser is automatically parsing any new or changed key:value pairs:

Have fun with the vRLI JSON parser:-)

Thomas

Adding custom objects to vRealize Operations with the REST API and vRealize Orchestrator workflows

In a recent blog post “Adding Custom Metrics and Properties to vRealize Operations Objects with the REST API” I have described how to add additional metrics and properties to existing objects in vRealize Operations using the REST API and Postman.

But what if you would like to use the outstanding vRealize Operations engine to manage and visualize objects which cannot be collected using the rich Management Pack ecosystem?

Let’s imagine you have a cool Smart Home system and you would like to get it integrated into your vRealize Operations. You would like to have all the various elements as objects in vRealize Operations to push metrics and properties to those objects.

In this post I will show you how to create your own custom environments in vRealize Operations using REST and vRealize Orchestrator.

Of course, this is just an example and the environment, and the corresponding inputs are “virtual”. The used vRealize Orchestrator workflows are examples and there are different ways to achieve the same outcome.

The vRealize Orchestrator workflows, actions etc. related to this post can be found here:

https://code.vmware.com/samples?id=5457

The REST API call

There are several REST API calls available to create new objects in vRealize Operations. In this example we will use the method “createResourceUsingAdapterKind”:

POST /api/resources/adapterkinds/{adapterKindKey}

A sample URL body of the call can be as complex as in the official documentation or as easy as this one:

https://VROPS-FQDN/suite-api/api/resources/adapterkinds/MySmartHome
{
    "description": "My new entry",
    "creationTime": null,
    "resourceKey": {
        "name": "Living Room",
        "adapterKindKey": "MyHouse",
        "resourceKindKey": "Lightning"
    },
    "resourceStatusStates": [],
    "dtEnabled": true,
    "monitoringInterval": 5
}

This Entry will initially create our OPENAPI adapter instance for the new custom environment using the REST API. This environment will reflect a Smart Home installation containing various devices. This call will create a lightning device located in the living room. How to execute that call using vRealize Orchestrator will be described later on.

Input data

If we are going to use automation to create our objects it would be not very sophisticated to enter every value manually. Therefor as first step we design and create a JSON file describing the model of our Smart Home. This is an example how a very simple model may look like. The included properties and metrics will play a role in some subsequent blog posts.

{"SmartHome": {
    "Climate": [
      {"Name": "Living Room", "Properties": [
        { "Manufacturer" : "CompanyA", "FWVersion" : "2.01" }
        ], "Metrics": [
          { "Temperatur" : "21", "Humidity" : "40", "BateryStatus" : "94%"}
          ]},
      {"Name": "Kitchen", "Properties": [
        { "Manufacturer" : "CompanyA", "FWVersion" : "1.90" }
        ], "Metrics": [
          { "Temperatur" : "13", "Humidity" : "87", "BateryStatus" : "10%"}
          ]},
      {"Name": "Bedroom", "Properties": [
        { "Manufacturer" : "CompanyA", "FWVersion" : "2.1" }
        ], "Metrics": [
          { "Temperatur" : "16", "Humidity" : "35", "BateryStatus" : "74%"}
          ]}
    ],
    "Door": [
        {"Name": "Front", "Properties": [
          { "Manufacturer" : "CompanyA", "FWVersion" : "1.95" }
          ], "Metrics": [
            { "Status" : "OPEN"}
            ]},
        {"Name": "Garden", "Properties": [
          { "Manufacturer" : "CompanyA", "FWVersion" : "2.1" }
          ], "Metrics": [
            { "Status" : "CLOSED"}
            ]}
      ],
      "Lightning": [
        {"Name": "Living Room", "Properties": [
          { "Manufacturer" : "CompanyB", "FWVersion" : "0.91" }
          ], "Metrics": [
            { "Status" : "ON", "Level (%)" : "100%", "BateryStatus" : "76%"}
            ]},
        {"Name": "Kitchen", "Properties": [
          { "Manufacturer" : "CompanyC", "FWVersion" : "1.00" }
          ], "Metrics": [
            { "Status" : "ON", "Level (%)" : "75%", "BateryStatus" : "45%"}
            ]},
        {"Name": "Bedroom", "Properties": [
          { "Manufacturer" : "CompanyA", "FWVersion" : "2.90" }
          ], "Metrics": [
            { "Status" : "OFF", "Level (%)" : "0%", "BateryStatus" : "14%"}
            ]}
      ]
  }
}

Code 1: SmartHome Data as JSON

In this JSON example our Smart Home consists of three types of devices: Climate, Door and Lightning.

The instances of those devices can be located in different rooms and have various properties and metrics.

vRealize Orchestrator Preparation – Resource Element

To consume our JSON file in a vRealize Orchestrator workflow we need to import that file as “Resource Element”.

JSON file as vRealize Orchestrator Resource Element

After importing the JSON file into vRealize Orchestrator it can be used as an attribute in any vRealize Orchestrator workflow.

vRealize Orchestrator Preparation – Configuration Element

Acquiring a valid vRealize Operations authentication token is one part of our workflow. To make the process as automated as possible, we will store frequently used values in a vRealize Orchestrator “Configuration Element”. Such values are for example user credentials and token related information.

vRealize Orchestrator Configuration Element

A vRealize Orchestrator configuration element is a kind of dictionary data structure storing key:value pairs for ease of use in vRealize Orchestrator workflows.

vRealize Orchestrator Preparation – REST Endpoint and Operations

The last pre-requisite is a working REST endpoint including REST operations configured in our vRealize Orchestrator instance. vRealize Orchestrator provides appropriate workflows in the out-of-the-box library to add new REST hosts and operations offered by those hosts. The following figure shows the location of the workflows which can be used to configure a REST API provider.

vRealize Orchestrator Out-of-the-Box REST Configuration Workflows

Basically, we will use following REST calls:

POST /api/auth/token/acquire

POST /api/resources/adapterkinds/{adapterKindKey}

For details, please check the vRealize Operations REST API documentation provided by your vRealize Operations instance at:

https://$VROPSFQDN/suite-api/docs/rest/index.html

Authenticating to vRealize Operations using vRealize Orchestrator

As described in my post “Adding Custom Metrics and Properties to vRealize Operations Objects with the REST API” we will use the token based authentication in this example, too. This is how the AquireToken workflow looks like:

AquireToken Workflow

In the first step we are creating the JSON body:

jsonBody = {
  "username": "",
  "authSource": "",
  "password": "",
  "others": [],
  "otherAttributes": {}
};

var userName = vropsConfig.getAttributeWithKey("userName");
var userPassword = vropsConfig.getAttributeWithKey("userPassword");
var authSource = vropsConfig.getAttributeWithKey("authSource");
jsonBody.username = userName.value;
jsonBody.password = userPassword.value;
jsonBody.authSource = authSource.value;

Code 2: createJsonBody Snippet

The next scripting element, callREST, executes the REST call:

  
requestBody = JSON.stringify(jsonBody);
request = aquireToken.createRequest(null, requestBody);
request.contentType = "application/json";
request.setHeader("accept", "application/json");
response = request.execute();
jsonObject = JSON.parse(response.contentAsString);
vropsToken = jsonObject.token;
vropsTokenValidity = jsonObject.validity;

Code 3: callREST Snippet

Third element saves the received token, including the expiration information, in the configuration element:

vropsConfig.setAttributeWithKey("token",vropsToken); vropsConfig.setAttributeWithKey("tokenValidity",vropsTokenValidity);

Code 4: saveToken Snippet

Creating Custom Objects

The actual job is being done in the CreateCustomObjects workflow:

CreateCustomObjects Workflow

After some URL-encoding for inputs containing e.g. white spaces, we collect information about the new objects using the JSON file (newObjecstInfo), the code snippet here has been shortened and includes only one object category. All workflows can be .

template = newObjectsJSONFile.getContentAsMimeAttachment();
jsonObject = JSON.parse(template.content);
var objects1 = jsonObject.SmartHome["Climate"];……
newResources1 = new Array();
for (object1 in objects1) {
  newResources1.push(objects1[object1].Name);
}
numberResource1 = newResources1.length;

Code 5: newObjectsinfo Snippet

What we are doing here is basically creating an array of strings containing the names of our new custom objects. At this point the code needs to be adopted to the model defined in the JSON file to parse the data correctly.

The next steps are fairly simple, we check the validity of the token which we saved in a configuration element and acquire a new token in case our token is valid for less than 10 minutes:

var vropsTokenValidity = vropsConfig.getAttributeWithKey("tokenValidity");
if (vropsTokenValidity.value != null) {
  var dateNow = new Date();
  var diff = vropsTokenValidity.value - dateNow.getTime();
  tokenRemainigVaidity = diff / 1000 / 60;
} else {
  tokenRemainigVaidity = 0;
}

Code 6: checkToken Snippet

The following scripting elements take care of looping through the arrays of strings to create all object one by one.

The main part related to creating new vR Ops objects consists of creating the JSON body:

jsonBody = {
  "description": "New SmartHome entry",
  "creationTime": null,
  "resourceKey": {
    "name": "",
    "adapterKindKey": "",
    "resourceKindKey": ""
  },
  "resourceStatusStates": [],
  "dtEnabled": true,
  "monitoringInterval": 5
};
if (creatingResource1) {
  jsonBody.resourceKey.name = newResources1[numberResource1 - 1];
  jsonBody.resourceKey.adapterKindKey = adapterKindKey;
  jsonBody.resourceKey.resourceKindKey = resourceKind1;
  numberResource1--;
}

Code 7: createJSONBody Snippet

The very last step is to execute the REST API call to create a custom object:

var params = [encodedAdapterKind];
var token = vropsConfig.getAttributeWithKey("token").value;
var request = createResourceCall.createRequest(params, JSON.stringify(jsonBody));

request.contentType = "application/json";
request.setHeader("accept", "application/json");
request.setHeader("Authorization", "vRealizeOpsToken " + token);
var response = request.execute();

if (response.statusCode >= 400) {
  System.log(response.contentAsString);
  throw "HTTPError: status code: " + response.statusCode;
}

Code 8: callREST Snippet

If everything worked out as expected, we will see our new object types and instances of those types in vRealize Operations.

After importing the vRealize Orchestrator package you will need to configure the REST operation according to your environment:

Workflow Attributes – REST Operation

Our Smart Home in vRealize Operations

The Environment view in vRealize Operations 7.0 including our custom objects:

vRealize Operations Environment View

In some subsequent posts I am going to explain how to push metrics and properties to such custom objects.

Some other interesting object types which may become relevant in the future, where vRealize Operations instances will be found even on space ships use the following JSON as input:

{
  "StarFleet": {
      "Ships": [
          {
              "Name": "Enterprise",
              "Properties": [
                  {
                      "Class": "Galaxy",
                      "Registry": "NCC-1701-D",
                      "Captain": "Picard"
                  }
              ],
              "Metrics": [
                  {
                      "CurrentSpeed": "9",
                      "ShieldStatus": "100"
                  }
              ]
          },
          {
              "Name": "Voyager",
              "Properties": [
                  {
                      "Class": "Intrepid",
                      "Registry": "NCC-74656",
                      "Captain": "Janeway"
                  }
              ],
              "Metrics": [
                  {
                      "CurrentSpeed": "9",
                      "ShieldStatus": "90"
                  }
              ]
          },
          {
              "Name": "Defiant",
              "Properties": [
                  {
                      "Class": "Defiant",
                      "Registry": "NX-74205",
                      "Captain": "Worf"
                  }
              ],
              "Metrics": [
                  {
                      "CurrentSpeed": "7",
                      "ShieldStatus": "80"
                  }
              ]
          }
      ],
      "Planets": [
          {
              "Name": "United Earth",
              "Properties": [
                  {
                      "Capital": "San Francisco, Paris",
                      "Founded": "2150",
                      "MajorSpecies": "Humans"
                  }
              ],
              "Metrics": [
                  {
                      "Population": "0"
                  }
              ]
          },
          {
              "Name": "Vulcan",
              "Properties": [
                  {
                      "Capital": "ShiKahr",
                      "Founded": "400",
                      "MajorSpecies": "Vulcanians"
                  }
              ],
              "Metrics": [
                  {
                      "Population": "0"
                  }
              ]
          },
          {
              "Name": "Andorian Empire",
              "Properties": [
                  {
                      "Capital": "Andor",
                      "Founded": "0000",
                      "MajorSpecies": "Andorians"
                  }
              ],
              "Metrics": [
                  {
                      "Population": "0"
                  }
              ]
          },
          {
              "Name": "Tellar",
              "Properties": [
                  {
                      "Capital": "Tellar Prime",
                      "Founded": "0000",
                      "MajorSpecies": "Tellarites"
                  }
              ],
              "Metrics": [
                  {
                      "Population": "0"
                  }
              ]
          }
      ]
  }
}

With some modifications to the newObjectsInfo scripting element:

template = newObjectsJSONFile.getContentAsMimeAttachment();
jsonObject = JSON.parse(template.content);

var objects1 = jsonObject.StarFleet["Ships"];
var objects2 = jsonObject.StarFleet["Planets"];
var properties;
var metrics;

newResources1 = new Array();
newResources2 = new Array();

for (object1 in objects1)
{
	System.log(objects1[object1].Name);
	
	newResources1.push(objects1[object1].Name);
	
	properties = objects1[object1].Properties;
	metrics = objects1[object1].Metrics;
	
	for (property in properties)
	{
		System.log(objects1[object1].Properties[property].Class);
		System.log(objects1[object1].Properties[property].Registry);
		System.log(objects1[object1].Properties[property].Captain);
	}
	
	for (metric in metrics)
	{
		System.log(objects1[object1].Metrics[metric].CurrentSpeed);
		System.log(objects1[object1].Metrics[metric].ShieldStatus);
	}
}

for (object2 in objects2)
{
	System.log(objects2[object2].Name);
	
	newResources2.push(objects2[object2].Name);
	
	properties = objects2[object2].Properties;
	metrics = objects2[object2].Metrics;
	
	for (property in properties)
	{
		System.log(objects2[object2].Properties[property].Capital);
		System.log(objects2[object2].Properties[property].Founded);
		System.log(objects2[object2].Properties[property].MajorSpecies);
	}
	
	for (metric in metrics)
	{
		System.log(objects2[object2].Metrics[metric].Population);
	}
}

numberResource1 = newResources1.length;
numberResource2 = newResources2.length;

Run the adjusted workflow:

And vR Ops ready to help to boldly go where no one has gone before…

Happy coding…

Thomas

vRA Dashboard – Tenant Focused View How-To

As many of you are probably aware, vROps provides an easy and comprehensive way to monitor and manage a vRealize Automation (vRA) environment through utilizing the Native Management Pack (NMP) for vRealize Automation.

The MP gives you a variety of pre-configured dashboards, view, alerts etc. which all work perfectly fine and give you a sufficient view of the environment if your vRA is dealing with only one tenant.

Of course are vROps and the Management Pack capable of collecting and displaying information for multiple tenants, the problem is, that some content aggregates numbers across all tenants. You can see this in the following screenshot:

OOB vRA Environment Overview Dashboard

But what if you have multiple tenants and you would like to see e.g. environment numbers for each and every tenant separately? How many deployments have been done by tenant X and how many Linux VMs have been deployed by tenant Y?

In this blog I will show you the basic techniques you can utilize to create your own content focusing on a per tenant view.

At the end of this blog post you will find a link to VMware Code where you can download sample content.

The foundation of the solution described in this post are Custom Groups.To have all the needed groups in one place, I have created a distinct Group Type:

Custom Group Type

Since I cannot describe all possible requirements this are my assumptions:

  • vRA configured with two tenants (vsphere.local, corporation.local in my environment)
  • requirement for having a Dashboard displaying how many Linux and Windows VMs have been deployed per tenant
  • requirement for having a Dashboard displaying number of Blueprints per tenant
  • requirement for having a Dashboard displaying number of Deployments per tenant

Based on these requirements we need following Custom Groups in our vROps:

Custom Groups

How to populate those groups dynamically with the corresponding objects?

Actually, this is pretty easy as the Management Pack provides the required Navigation Trees:

OOB vRA MP Navigation Trees

Let’s see how to create the Custom Groups.

As an example you see here the Custom Group for Windows VMs deployed by the corporation-Tenant. The most important part is bordered in red, it is the relationship of an given object in a navigation tree.

The “contains” statement has to reflect the actual name of the tenant.

Custom Group for Windows VMs per Tenant

Obviously, for the Linux group only the Properties part looks a bit different and needs to reflect the actual environment:

Custom Group Settings – Linux VMs

Now, let’s inspect the group configuration for Deployments and Blueprints:

Custom Group Settings – Deployments per Tenant

For the Blueprints Custom Group we need to use another Navigation Tree:

Custom Group Settings – Blueprints per Tenant

As there is no metric or property reflecting the count of objects belonging to a Custom Group, appropriate Super Metrics need to be created, associated with the corresponding Custom Group Type and enabled in their respective Policy:

Super Metrics

Super Metrics enabled in the policy:

Super Metrics Enabled in the Policy

Here an example of the actual formula for the first Super Metric:

count(${adaptertype=VMWARE, objecttype=VirtualMachine, attribute=badge|health, depth=1})

After few collection cycles the new Super Metric will show up on our new Custom Groups and the values can be used in the content.

Now we have all ingredients to create our own custom dashboard displaying the various numbers separately for all our vRA Tenants.

This is how my sample dashboard looks like:

Sample Dashboards for vRA – Tenant focused View

What is happening behind the scenes is fairly easy. The Scoreboards are configured as self-provider and are using previously created Custom Groups as source of the objects and the respective Super Metrics to show the correct numbers.

At the bottom of Dashboard some additional information regarding the selected Blueprint is displayed. To achieve this correct wiring of the sources and destinations is required:

Wiring the Components

A zip file containing all elements can be found here:

https://code.vmware.com/samples?id=5348

Thomas

vRealize Log Insight Data Sets using custom filters

IMPORTANT NOTE: All log file examples are not real and exact PCF log files. Since I do not have a running PCF environment while writing this post, I have used some fake examples and modified them to meet my needs.

Let’s consider following use case.

You are responsible for operating a Pivotal Cloud Foundry (PCF) environment.

PCF is sending all log messages for all spaces, orgs and apps etc. to one central vRealize Log Insight cluster.

Your developers using the PCF services would like to access their log messages. 

Now, you could just grant read access to all developers but doing that you would allow every developer see all messages received by vRLI, not only PCF related.

The first and pretty easy solution is to leverage the static tag already being used by the PCF Content Pack.

The installation instruction of the content pack says:

Log Insight Setup:

1.      Obtain a Virtual IP from your IT department that will be under the same Subnet as your Log Insight environment. 

2.    Follow the `Procedure` defined in the following link: http://pubs.vmware.com/log-insight-33/topic/com.vmware.log-insight.administration.doc/GUID-72CB469A-F276-438D-BC93-77853E2CC0B9.html

3.    When prompted for `a list of static tags (key=value)`, enter the following:

            product=pcf

This static tag can be used for creation of an appropriated data set, which will contain only logs from your PCF environment.

If you run this settings in interactive analytics you will get only those log messages which are tagged with “product=pcf”:

But what if you want your developers to access only logs which belongs to their PCF org or/and space?
Reading the documentation, you could come up with the idea of using extracted fields:


“Use the first drop-down menu to select a field defined within vRealize Log Insight to filter on. 
For example, hostname
The list contains all defined fields that are available statically, in content packs, and in custom content.”

But if you try to use your own extracted fields in a data set you will notice that this kind of fields are not available in a data set configuration.
The solution I have used with my last customer was to configure the vRLI agent on the PCF syslog server to set static fields “dynamically” via RegEx expression. These static fields based on app or space IDs can be used in data set filters. 


NOTE: This is just an example (fake messages):


[filelog|pcf-syslog]
directory=/var/log/pcf_sample
include=*.log
tags={"tkopton_tag01":"testing-orgs"}
parser=pcforg-parser
enabled=yes

[parser|pcforg-parser]
base_parser=regex
format=cf_org_id=(?<tkopton_tag02>\S+\b)
debug=no
next_parser=pcfspace-parser

[parser|pcfspace-parser]
base_parser=regex
format=cf_space_id="(?<tkopton_tag03>\S+\b)
debug=no
next_parser=syslog_parser

Now, you can use those fields as filters in data sets, like:

And the test using “Run in Interactive Analytics”:

IMPORTANT NOTE: Tested on a PCF Linux syslog server, I do not think, this will work on a Windows system;-)

vROps SuperMetric using logical expressions

vRealize Operations Super Metrics are a very flexible and powerful way to extend the capabilities of the product way beyond the OOB content.
There are many blog articles out there explaining how to basically use super metrics but only very few sources gives some examples how to put logical expressions into your formulas. So the question is, how dos this work?

vROps Super Metric

Using some simple examples I am going to explain how the magic of logical expressions work in vROps Super Metrics.

First of all some fundamentals:
  • Super Metric working on a selected object itself, like ESXi cluster in this example, which is just showing the actual metric (we will need soon):
avg(${this, metric=summary|total_number_hosts})
  • Super Metric working on direct descendants of a selected object, in this case ESXi hosts in a cluster, which is counting the powered on hosts:
count(${adaptertype=VMWARE, objecttype=HostSystem, metric=sys|poweredOn, depth=1})
Now, let’s put the pieces together and build a super metric which follows this pattern:
condition ? inCaseOfTrue : elseCase;

Even if this doesn’t mean anything in terms of semantics, the syntax of such an expression might look like this one:

count(${adaptertype=VMWARE, objecttype=HostSystem, metric=sys|poweredOn, depth=1}) == avg(${this, metric=summary|total_number_hosts}) && avg(${adaptertype=VMWARE, objecttype=HostSystem, metric=cpu|usage_average, depth=1} as cpuUsage) > 40 ? avg(cpuUsage ):5

One could translate this formula into that statement:

If all ESXi hosts in a given cluster are powered on AND
clusters average CPU usage is greater than 40
THEN show me the average CPU usage,
ELSE show me 5
Working vROps Super Metric

Have fun creating your own Super Metrics based on logical expressions.

How to backup and restore vRealize Log Insight master node configuration?


Even configured as a cluster vRealize Log Insight does not support high availability in terms of availability of data and availability of all functions and configuration data.

What does it mean exactly?

In a vRLI cluster there are basically two types of nodes:
  • one master node
  • up to 11 worker nodes (as for vRLI 4.5)
What will happen if one (or more) of those nodes fails?
  • worker node

In case it is a worker node, the cluster remains fully accessible but we will not be able to access the data which was stored on this particular node. It might also be, that exactly this node was holding the VIP, in this case the cluster will elect a new node to hold the VIP. But what if this node cannot be restored anymore?

  1. You have a full backup of this node – everything will be fine, just run you restore procedure and your back to business.
  2. You, for some reason, don’t have any backups. For sure, you will loose the data but “restoring” the node is as easy as removing the failed node from the cluster (https://docs.vmware.com/en/vRealize-Log-Insight/4.3/com.vmware.log-insight.administration.doc/GUID-116098CD-6F9D-4FC9-A037-CB2CAE035B29.html) adding a new node to the cluster, you can just use the same name and IP.
  • master node

In case it is a master node, again the same applies: the cluster remains fully accessible but we will not be able to access the data which was stored on this particular node. It might also be, that exactly this node was holding the VIP, in this case the cluster will elect a new node to hold the VIP. BUT you will not be able to access and change the cluster configuration, the status will be unavailable etc.:

But what if this node cannot be restored anymore?

  1. You have a full backup of this node – everything will be fine, just run you restore procedure and your back to business.
  2. You, for some reason, don’t have any backups, nothing, not even a single file. You’re screwed!

But there is good news even if you cannot backup the whole node (maybe it is just too big, or for whatever reason) – just backup the right data to make a master node restore as easy as restoring a worker node.

### to edit ###

These are the steps to backup and restore the master node (minimal version), for a regular full backup, please follow the official VMware documentation (vRLI 4.5) https://docs.vmware.com/en/vRealize-Log-Insight/4.5/com.vmware.log-insight.administration.doc/GUID-FB70EF83-7E6B-4AEE-9522-CD6173F52FA0.html:

  • Backup following files on your master node on a regular basis:
/storage/core/loginsight/config/loginsight-config.xml#number

/storage/core/loginsight/config/node-token

/storage/var/loginsight/apache-tomcat/conf/keystore

which is the target of the symlink:

The restore procedure after the master node is lost:

  1. Spin up a new log insight server with same IP and FQDN as the old master node
  2. Stop the loginsight service (connected via ssh): service loginsight stop
  3. Create the config folder: /storage/core/loginsight/config
  4. Copy all loginsight-config.xml#number and node-token files to /storage/core/loginsight/config/ (Note: “config” folder has to be manually created)
  5. Copy keystore file to /storage/var/loginsight/apache-tomcat/conf/
  6. Check the symlink: /usr/lib/loginsight/application/3rd_party/apache-tomcat-8.5.15/conf -> /storage/var/loginsight/apache-tomcat/conf
  7. Reboot the log insight appliance
  8. Login to UI and checked the cluster status


Disclaimer: This method does not replace a proper backup of the system as described in the VMware documentation!

vROps SuperMetric using logical expressions

vRealie Operations Super Metrics are a very flexible and powerful way to extend the capabilities of the product way beyond the OOB content.

There are many blog articles out there explaining how to basically use super metrics but only very few sources gives some examples how to put logical expressions into your formulas. So the question is, how dos this work?

Using some simple examples I am going to explain how the magic of logical expressions work in vROps Super Metrics.

First of all some fundamentals:
  • Super Metric working on a selected object itself, like ESXi cluster in this example, which is just showing the actual metric (we will need soon):
avg(${this, metric=summary|total_number_hosts})
  • Super Metric working on direct descendants of a selected object, in this case ESXi hosts in a cluster, which is counting the powered on hosts:
count(${adaptertype=VMWARE, objecttype=HostSystem, metric=sys|poweredOn, depth=1})
Now, let’s put the pieces together and build a super metric which follows this pattern:
condition ? inCaseOfTrue : elseCase;

Even if this doesn’t mean anything in terms of semantics, the syntax of such an expression might look like this one:

count(${adaptertype=VMWARE, objecttype=HostSystem, metric=sys|poweredOn, depth=1}) == avg(${this, metric=summary|total_number_hosts}) && avg(${adaptertype=VMWARE, objecttype=HostSystem, metric=cpu|usage_average, depth=1} as cpuUsage) > 40 ? avg(cpuUsage ):5

One could translate this formula into that statement:

If all ESXi hosts in a given cluster are powered on AND clusters average CPU usage is greater than 40 THEN show me the average CPU usage, ELSE show me 5