As you probably know vRealize Operations provides several symptom definitions based on message events as part of the vCenter Solution content OOTB. You can see some of them in the next picture. These events are used in alert definitions to raise vReaalize Operations alarms any time one of those events is triggered in any of …
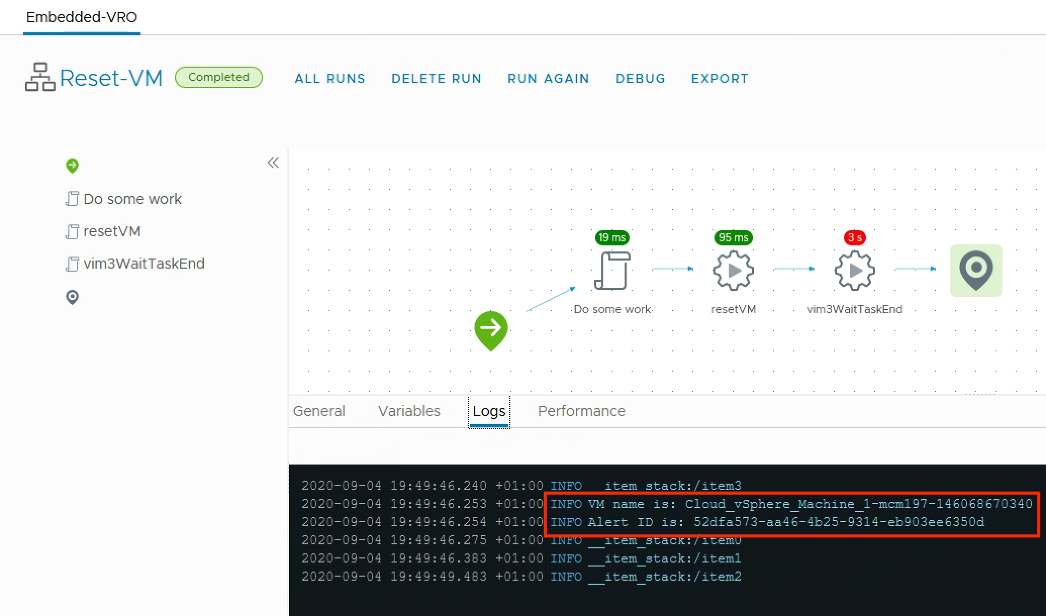
vCenter Events as vRealize Operations Alerts using vRealize Log Insight