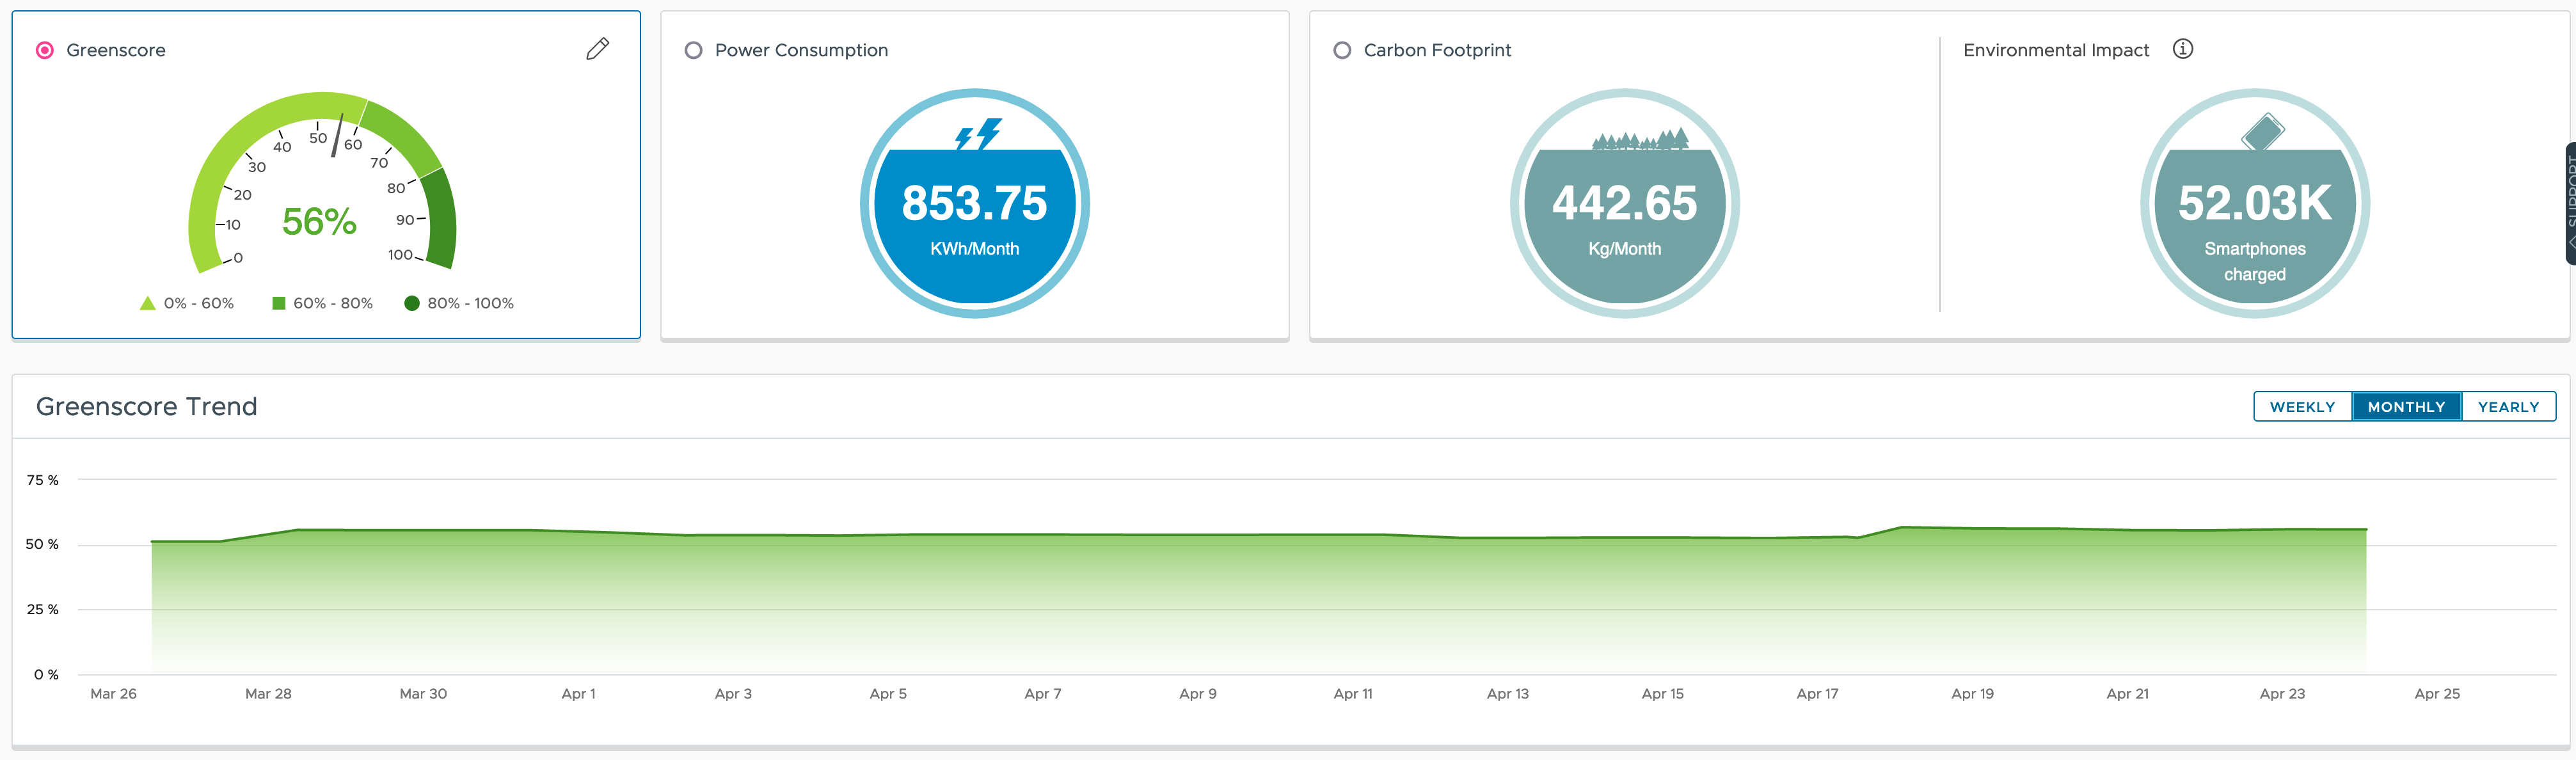
My last posts focused on sustainability and how VMware Aria Operations can help get more insights into energy consumption, infrastructure efficiency and how to improve operations and make the virtual infrastructure more sustainable. In this post I will describe how I used an old Raspberry Pi, a DHT22 sensors, few Shelly Plug S smart plugs …
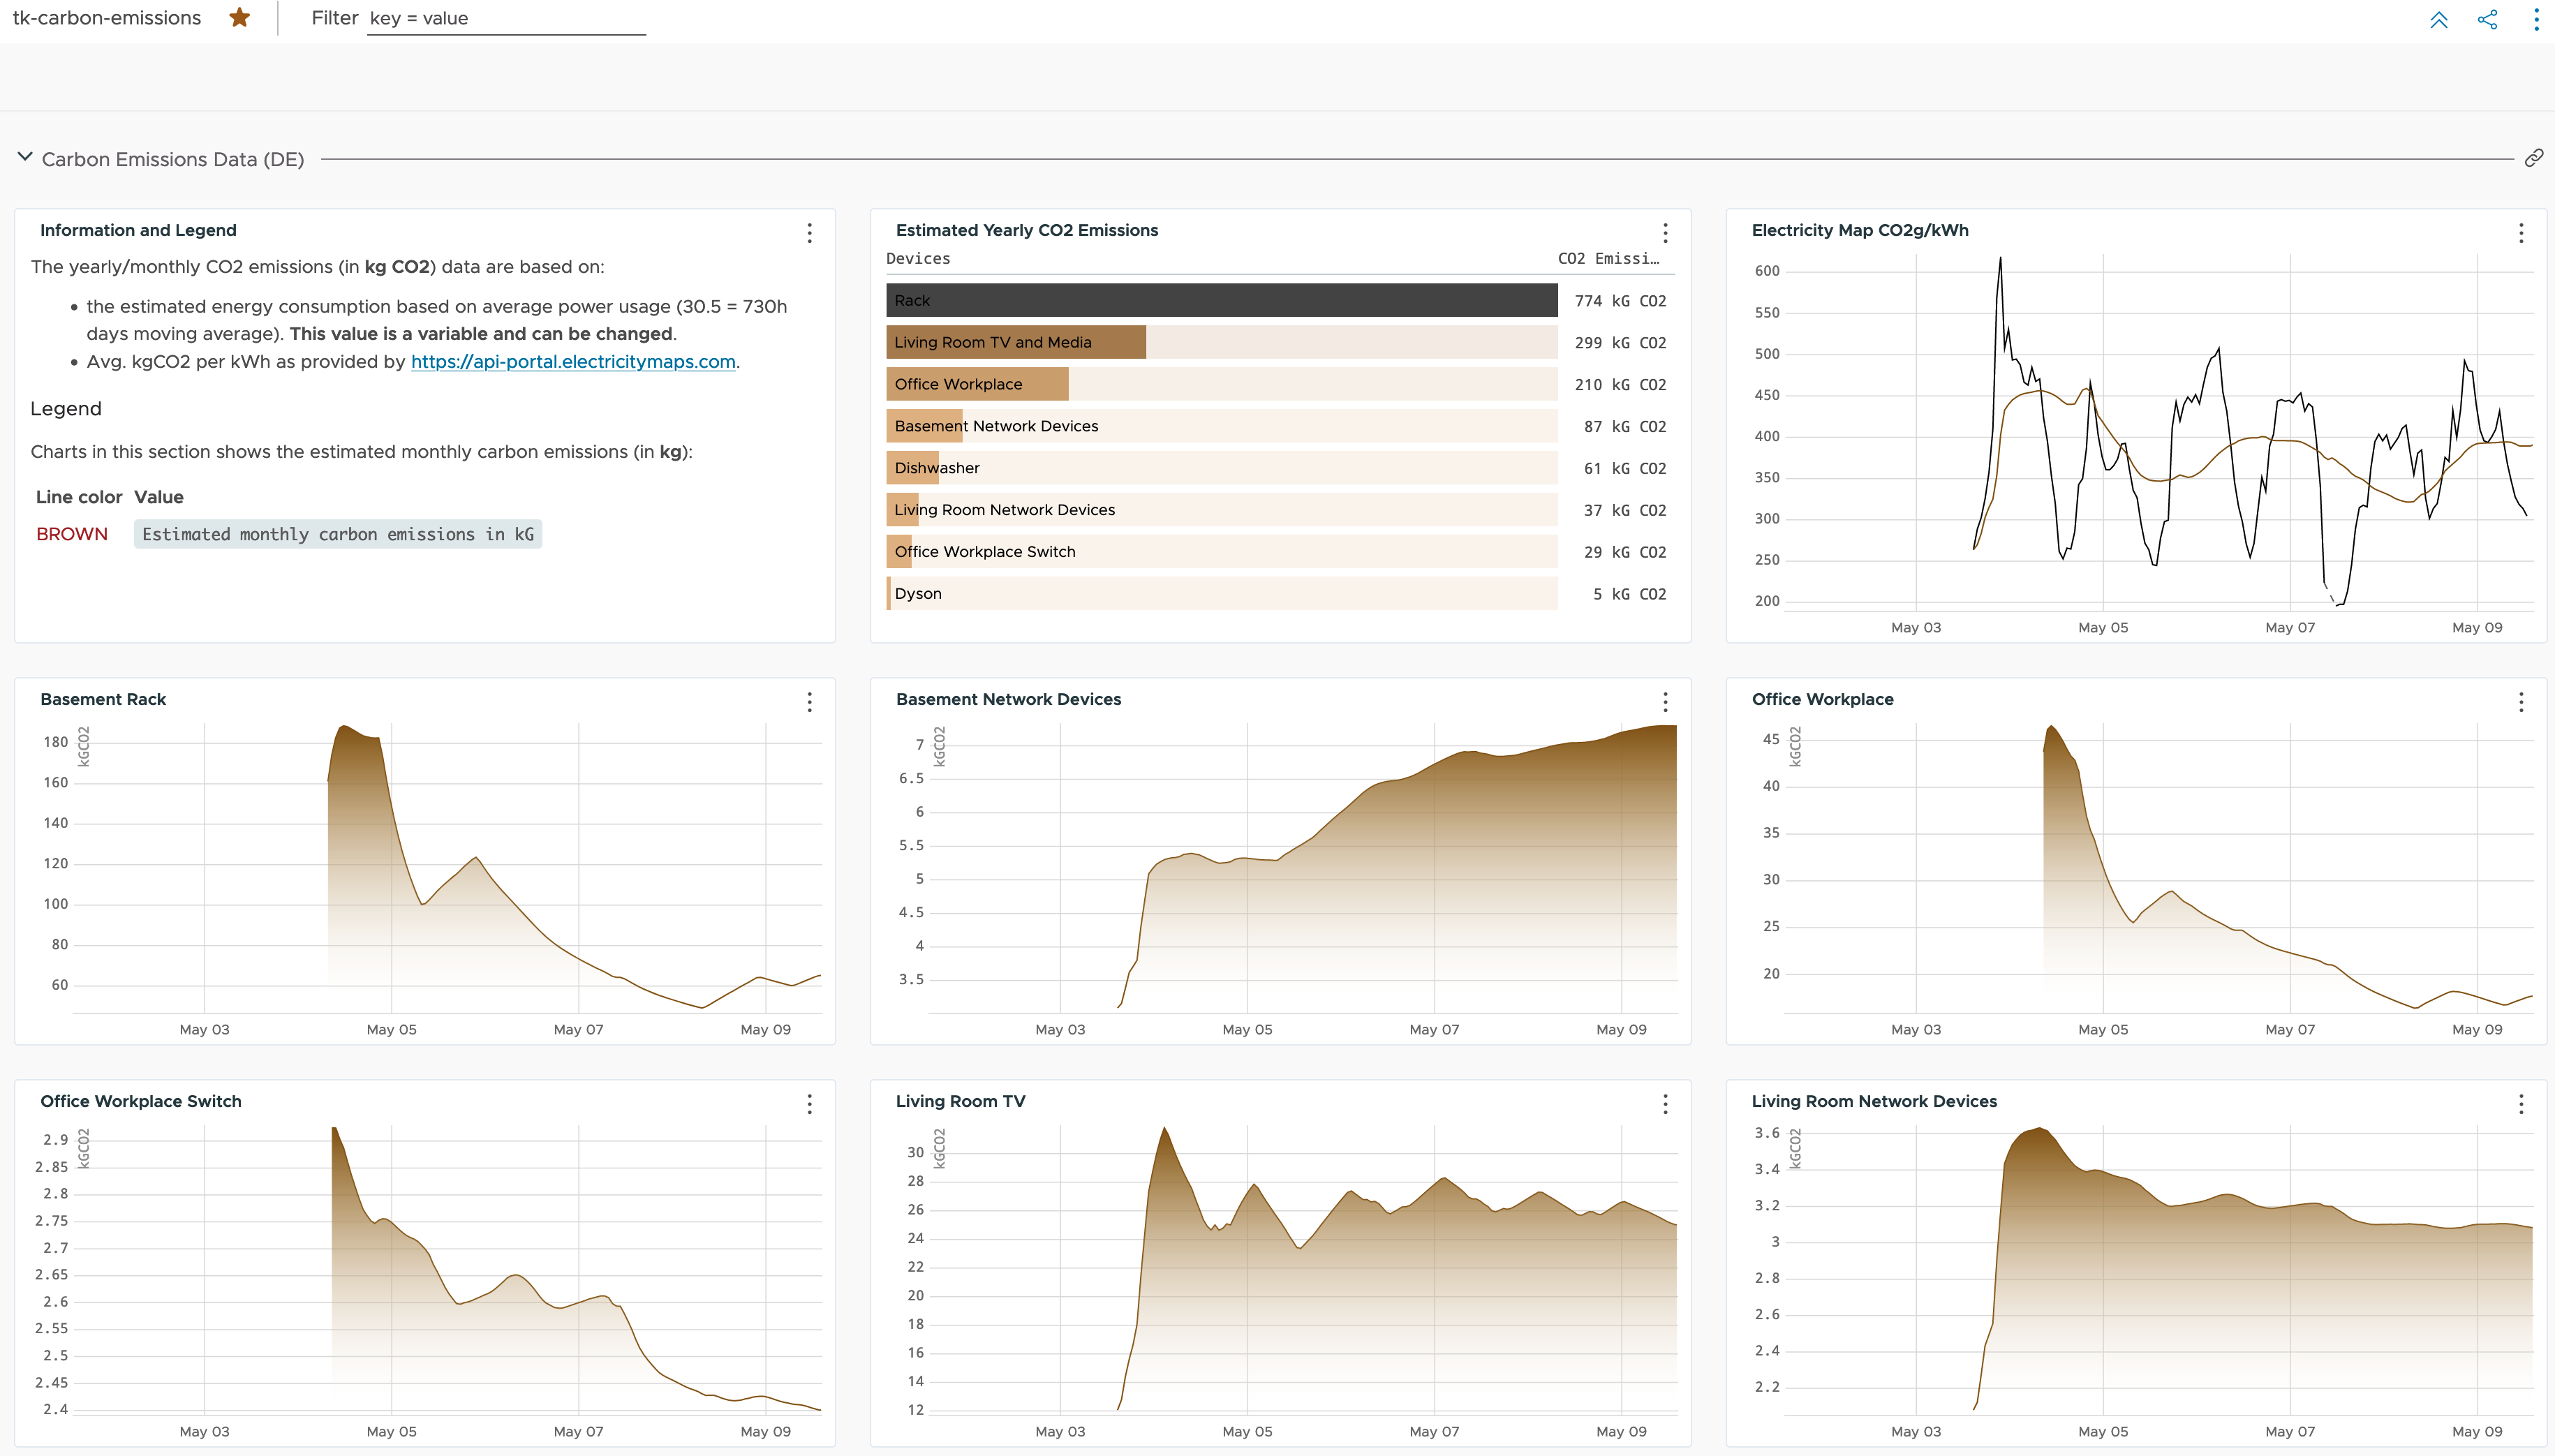
Energy Consumption Data in VMware Aria Operations for Applications (FKA Tanzu Observability, FKA Wavefront)